Farm lending activity at commercial banks accelerated in the first quarter of 2022 due to a significant increase in the size of operating loans. With some input costs surging in recent months, the volume of operating loans increased sharply from a year ago and non-real estate lending increased on a rolling four-quarter basis for the first time since mid-2019. The average size of operating notes increased notably alongside a record high share of credits that were greater than $1 million.
While the outlook for the U.S. agricultural economy in 2022 remained strong alongside elevated commodity prices, rising input costs have raised concerns about future profitability. The escalation of the Russia-Ukraine conflict and associated market disruptions pushed crop prices even higher. However, the turmoil also led to rapid increases in the prices of major inputs such as fuel and some agricultural fertilizers that are sourced from those countries. While higher crop prices are likely to support farm revenues, concerns about the cost and availability of agricultural inputs intensified and higher feed prices could also pressure profit margins for livestock producers. Higher prices for key farm inputs and broad inflation could also put upward pressure on credit needs moving forward.
First Quarter National Survey of Terms of Lending to Farmers
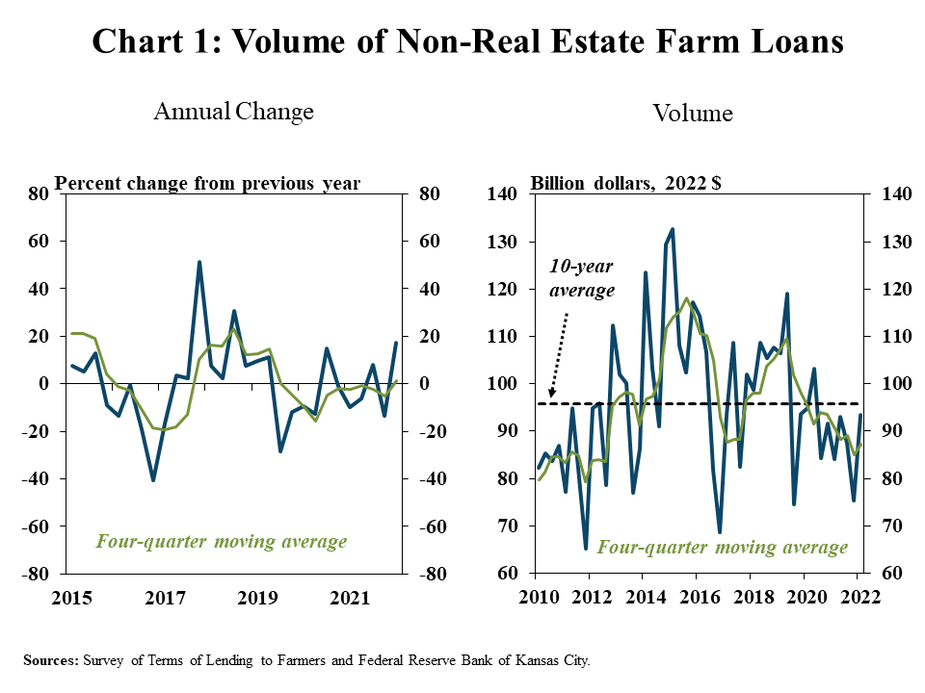
Farm lending activity increased at the fastest pace in nearly four years, but remained modest by recent historical standards. The total volume of non-real estate farm loan was about 17% higher than a year ago, the largest year-over-year increase since 2018 (Chart 1, left panel). Despite the notable increase from a year ago, however, farm lending remained below the average of recent years on an inflation-adjusted basis (Chart 1, right panel).
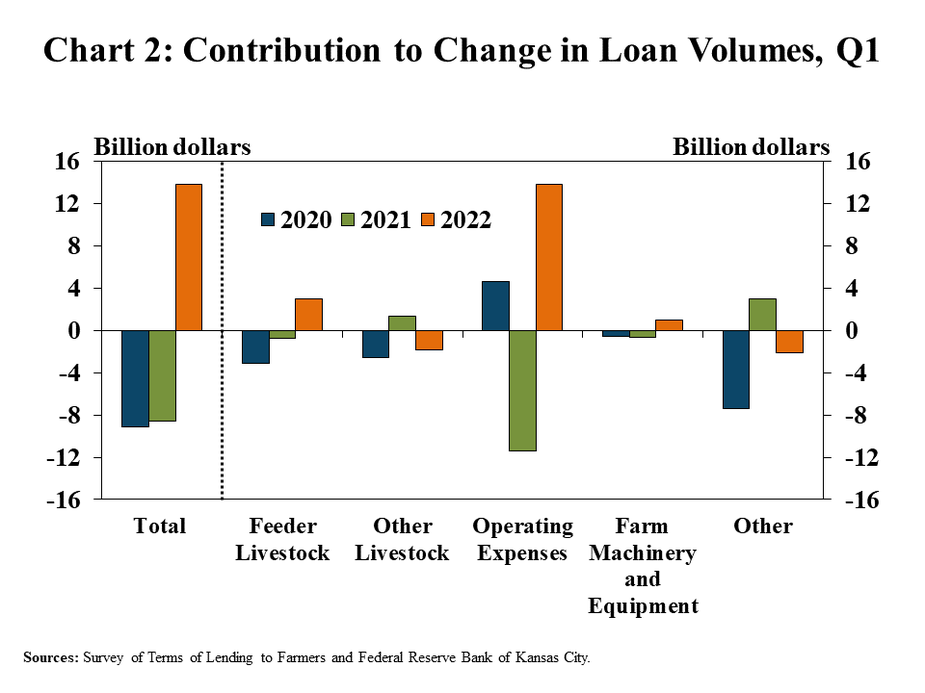
Alongside substantial increases in the prices of key inputs, loans for operating expenses increased sharply and boosted overall lending activity. Operating loans increased about 30% from a year ago and accounted for nearly all of the increase in non-real estate loan volumes (Chart 2). Feeder livestock loans also increased at a rapid pace alongside higher livestock prices, but the volume of increase was comparatively smaller.
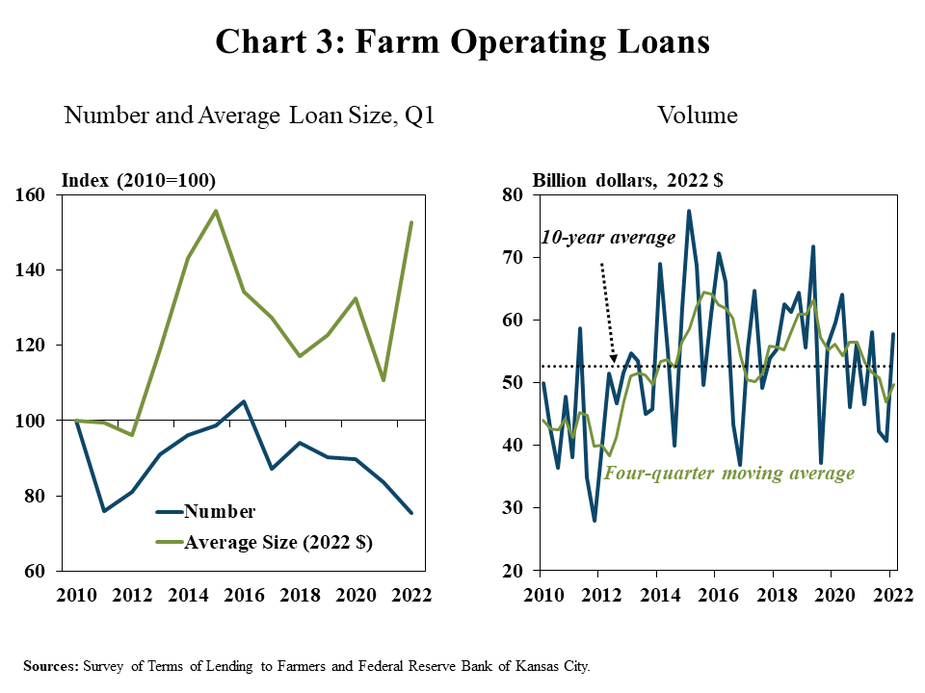
A sharp increase in the size of operating loans was the primary contributor to the increase in loan volume. Although the number of operating loans continued to decline and reached an all-time low for the first quarter, the average size of those loans neared a record high (Chart 3, left panel). Similar to non-real estate loans in total, operating loan volumes over the past four quarters also remained less than recent averages after adjusting for inflation (Chart 3, right panel).
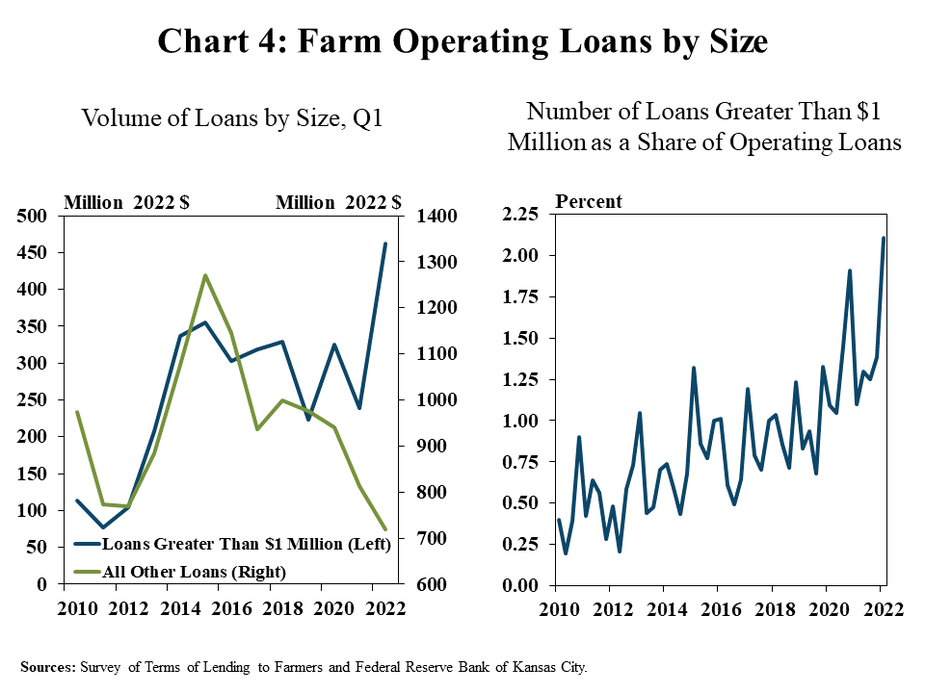
Average loan sizes increased in the first quarter due to a much higher volume of large loans. The volume of loans greater than $1 million reached a record high for the first quarter, while the volume of loans less than $1 million dropped considerably (Chart 4). The number of large loans remained steady alongside a drop in smaller loans and, as result, the share of loans that were larger than $1 million reached a record high for all quarters.
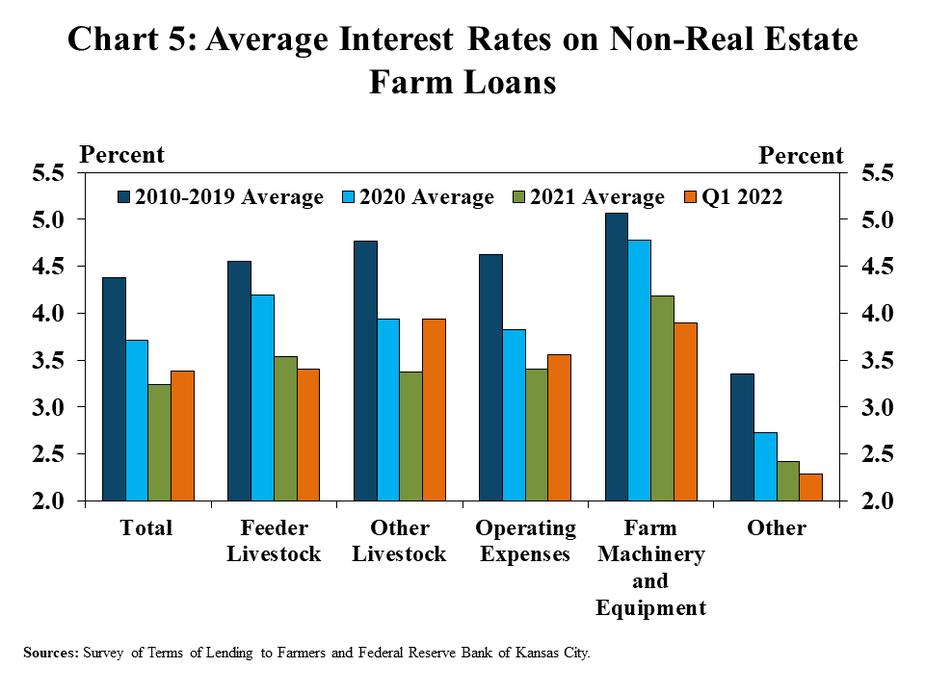
Interest rates on non-real estate loans remained historically low, but increased slightly ahead of the increase in the federal funds rates in March. The average rate charged on non-real estate loans during the February survey period was slightly higher than the average during 2021, driven by an uptick in interest charges for operating and other livestock loans (Chart 5). The average rate on feeder livestock, machinery and equipment, and other loans was slightly lower.
Data and Information
National Survey of Terms of Lending to Farmers Historical Data
National Survey of Terms of Lending to Farmers Tables
About the National Survey of Terms of Lending to Farmers
The views expressed in this article are those of the authors and do not necessarily reflect the views of the Federal Reserve Bank of Kansas City or the Federal Reserve System.
Authors

Nate Kauffman
Senior Vice President, Economist, and Omaha Branch Executive; Executive Director of the Center for Agriculture and the Economy
