Agricultural credit conditions improved in the first quarter, and farm real estate values continued to increase alongside strength in the U.S. farm economy. Following a year of accelerating increases, the value nonirrigated cropland across much of the U.S. has soared in 2022 through March. The sharp growth in land values persisted despite a slight increase in farm loan interest rates. With broad strength in farm finances, farm loan repayment rates continued to increase and credit conditions remained strong.
The outlook for agricultural credit conditions remained optimistic alongside persistently strong commodity prices. However, External Linkmany lenders expected conditions to soften in coming months alongside the pressures to profit margins from higher input costs and harsh drought conditions in large portions of the country. Farm real estate markets also remained strong, but reduced profit margins or higher interest rates could limit gains in land values in the year ahead.
First Quarter Federal Reserve District Ag Credit Surveys
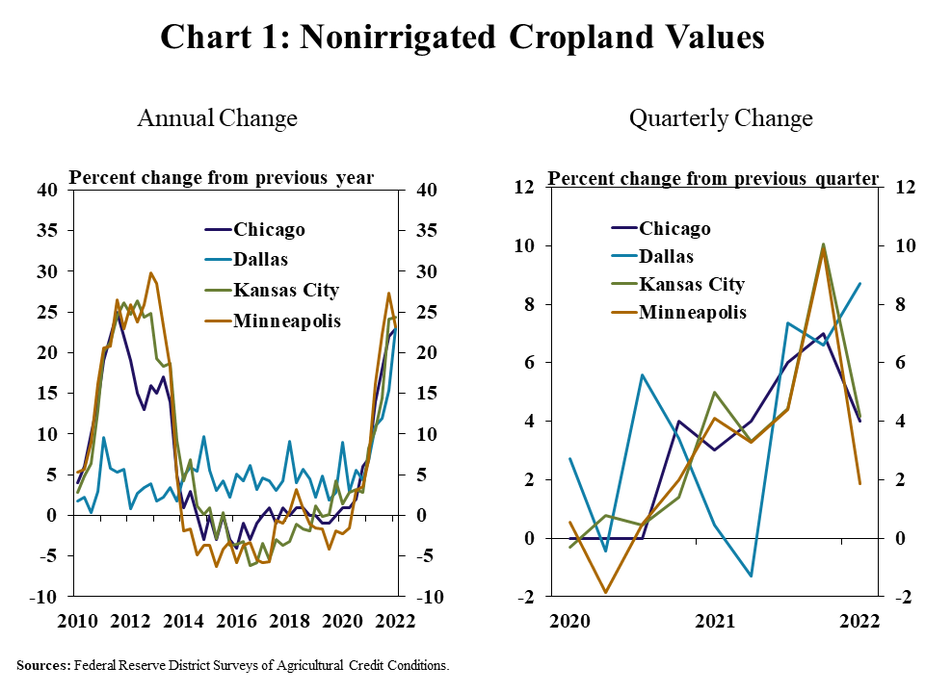
Growth in farm real estate values remained high and accelerated in some regions. Similar to the previous quarter, the value of nonirrigated cropland rose by more than 20% from a year ago in Federal Reserve Districts with a large agricultural concentration (Chart 1). The annual pace of growth increased from the previous quarter in the Dallas and Chicago Districts. Values in the Dallas region also accelerated on a quarterly basis, but steadied to a pace similar to early 2021 in other areas.
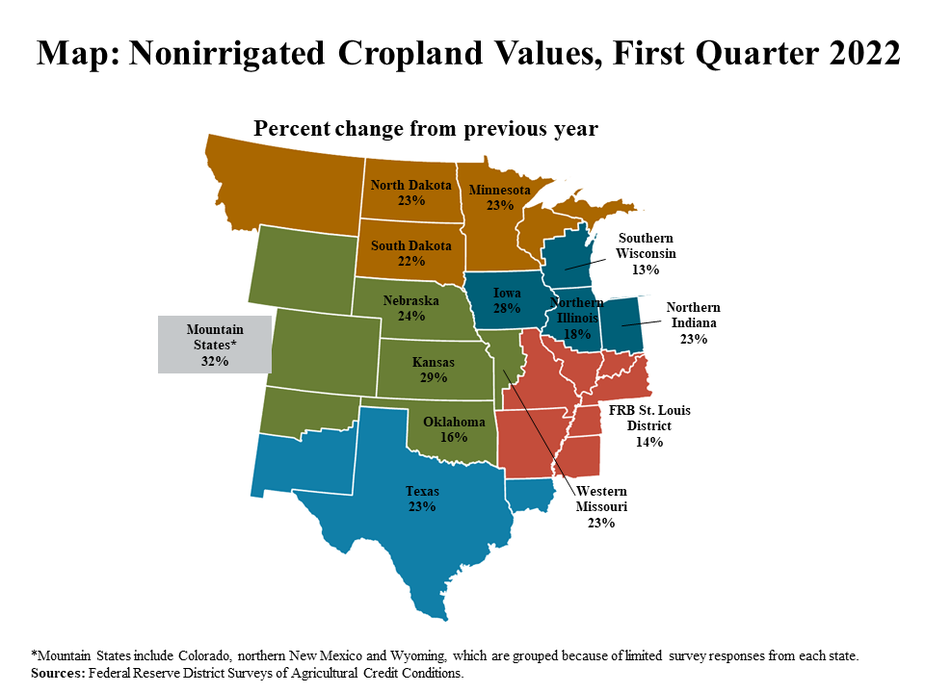
The strength in farm real estate values remained consistent across all states. The value of nonirrigated cropland increased by more than 20% in the majority of states represented in the participating Districts during the first quarter (Map). The increase was particularly sharp in Iowa, Kansas and the Mountain States where values were about 30% higher than a year ago.
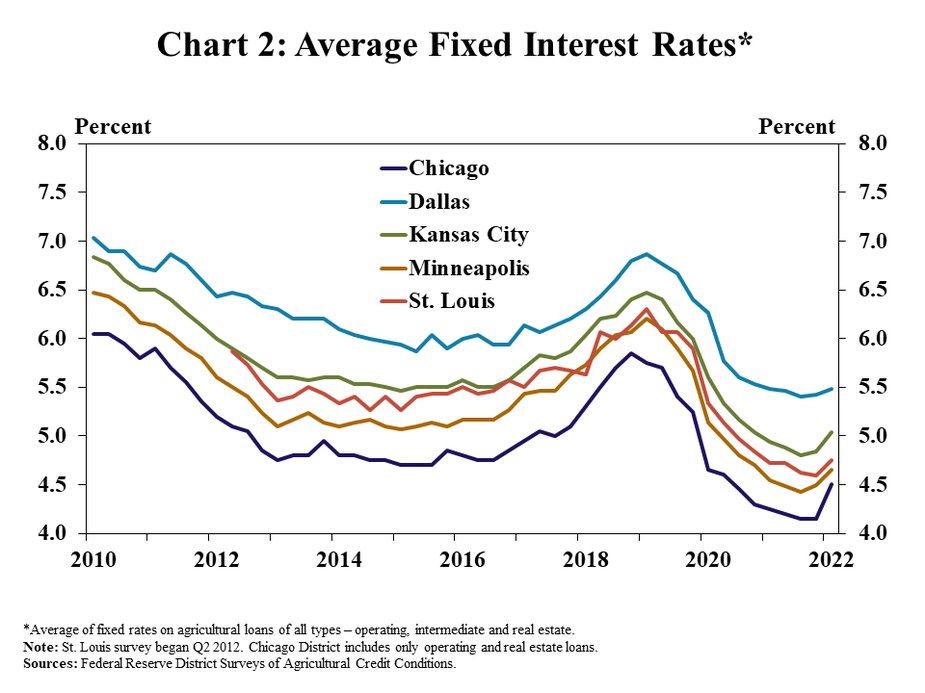
Agricultural real estate values continued to rise sharply despite a slight uptick in interest rates. The average fixed rate charged on farm loans increased in all Districts following an increase in the federal funds rate in mid-March (Chart 2). Fixed rates increased by an average of 20 basis points from the previous quarter across all regions, with a slightly faster rise in the Chicago District.
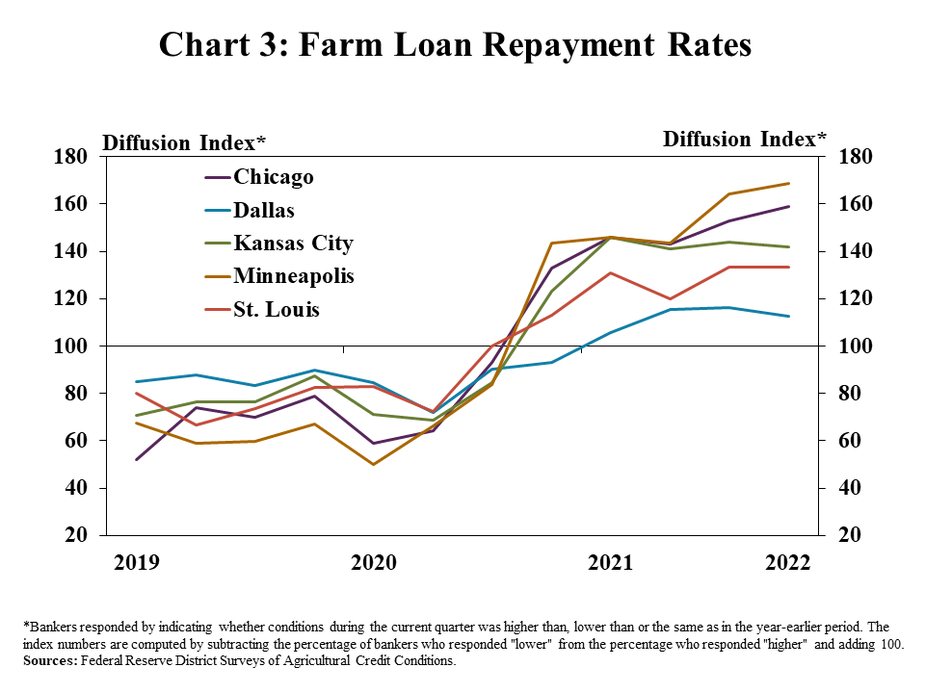
With high commodity prices supporting farm finances, credit conditions improved further. Farm loan repayment rates increased at a pace similar to recent quarters in most regions and rose at a slightly faster pace in the Chicago and Minneapolis Districts (Chart 3). It marked the fifth consecutive quarter of higher rates of repayment in nearly all regions.
Data and Information
Federal Reserve Ag Credit Surveys Historical Data
The views expressed in this article are those of the authors and do not necessarily reflect the views of the Federal Reserve Bank of Kansas City or the Federal Reserve System.
Authors

Nate Kauffman
Senior Vice President, Economist, and Omaha Branch Executive; Executive Director of the Center for Agriculture and the Economy
