Farmland values continued to increase at a rapid pace through the end of 2021. Alongside sustained strength in farm income and credit conditions, the value of all types of farmland in the Tenth District was more than 20% higher than a year ago. The recent strength in agricultural real estate markets has been supported by strong demand, historically low interest rates and vastly improved conditions in the farm economy.

Lenders reported a mostly favorable outlook for agriculture in the District but cited the rise in input costs as a risk to the sector. Even with uncertainty around input costs, lenders expected favorable conditions in the economy to support farm finances and lead to further gains in farmland values in 2022. The possibility of weaker agricultural income and higher interest rates in the economy remain as risks for farmland markets. Despite the risks, the agricultural sector appears to be well positioned for the year ahead, supported by strong balance sheets, high agricultural commodity prices and sharp gains in farmland values.

Section 1: Farmland Values and Interest Rates

Farm real estate values increased in the first quarter at a pace similar to recent quarters. The value of all types of agricultural real estate in the District was about 20% higher than a year ago, which was similar to the previous quarter and followed several periods of mounting increases (Chart 1, left panel). Following a sharp rise in the value of nonirrigated farmland at the end of 2021, values increased about 5% from the previous quarter, which was a rate similar to the average over the past year (Chart 1, right panel).

Chart 1: Tenth District Farm Real Estate Values– includes two individual charts. Left, Annual Change- is a line graph showing the percentage change from the previous year* in nonirrigated farmland, irrigated farmland and ranchland values in every quarter from 2010 to 2022. Right, Quarterly Change - is a clustered column chart showing the percent change from the previous quarter* in nonirrigated farmland, irrigated farmland and ranchland values in every quarter from 2020 to 2022.  *Percent changes are calculated using responses only from those banks reporting in both the past and the current quarters.

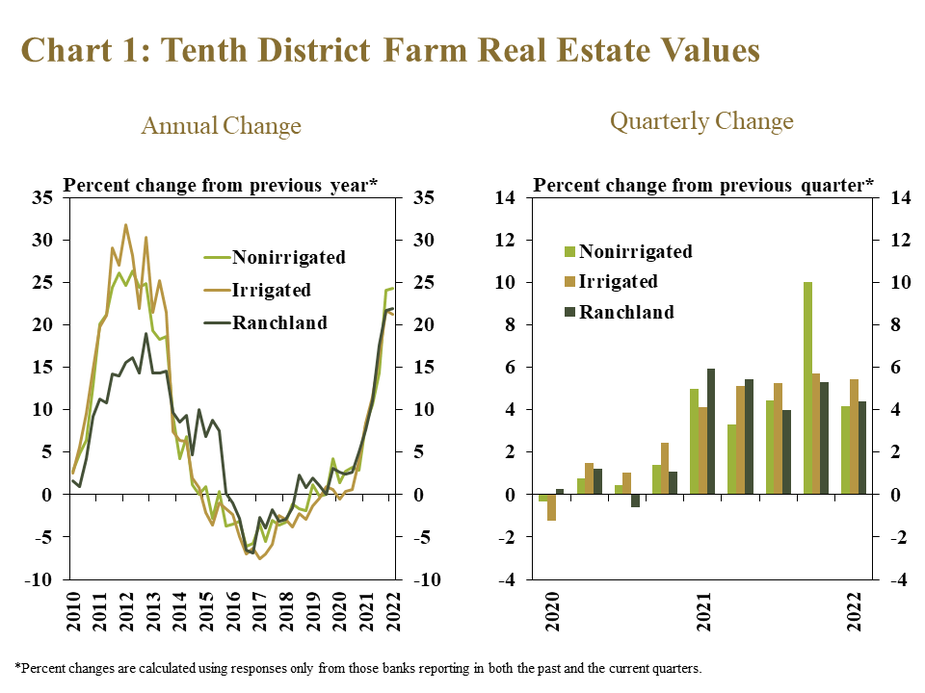
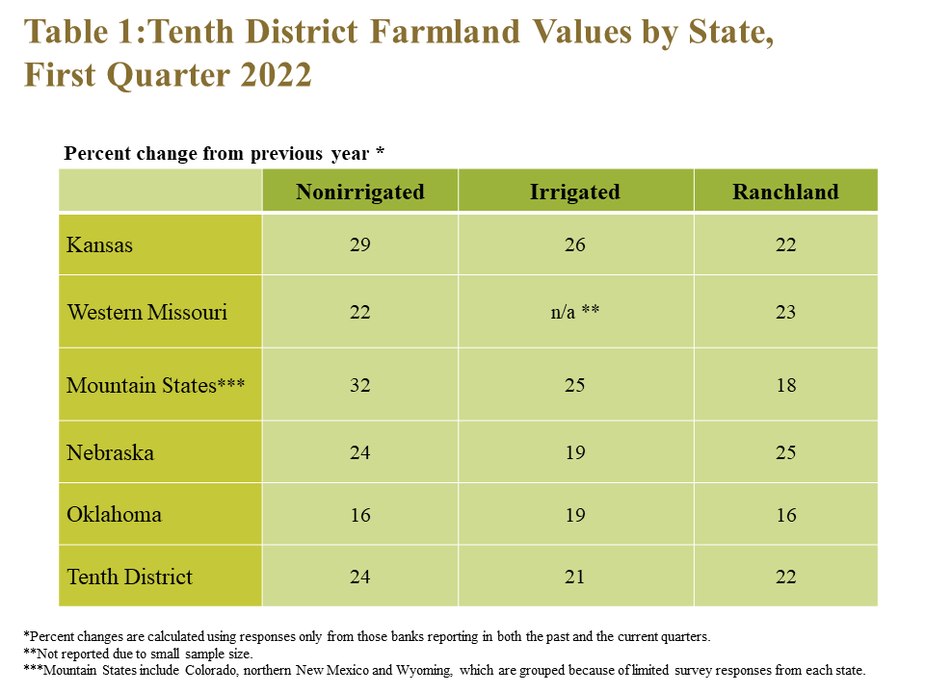
Strength in farm real estate values was consistent across all states in the District. The value of all land types increased by at least 15% from a year ago in all states (Table 1). The increase in nonirrigated and irrigated cropland values was most notable in the Mountain States and Kansas, while the rise in ranchland values was highest in Nebraska.

Table 1: Tenth District Farmland Values by State, Fourth Quarter 2021– is a table showing the percent change from the previous year* in farm real estate values for non-irrigated cropland, irrigated cropland and ranchland during Q1 2022 for the Tenth District and each state.   *Percent changes are calculated using responses only from those banks reporting in both the past and the current quarters. **Not reported due to small sample size. ***Mountain States include Colorado, northern New Mexico and Wyoming, which are grouped because of limited survey

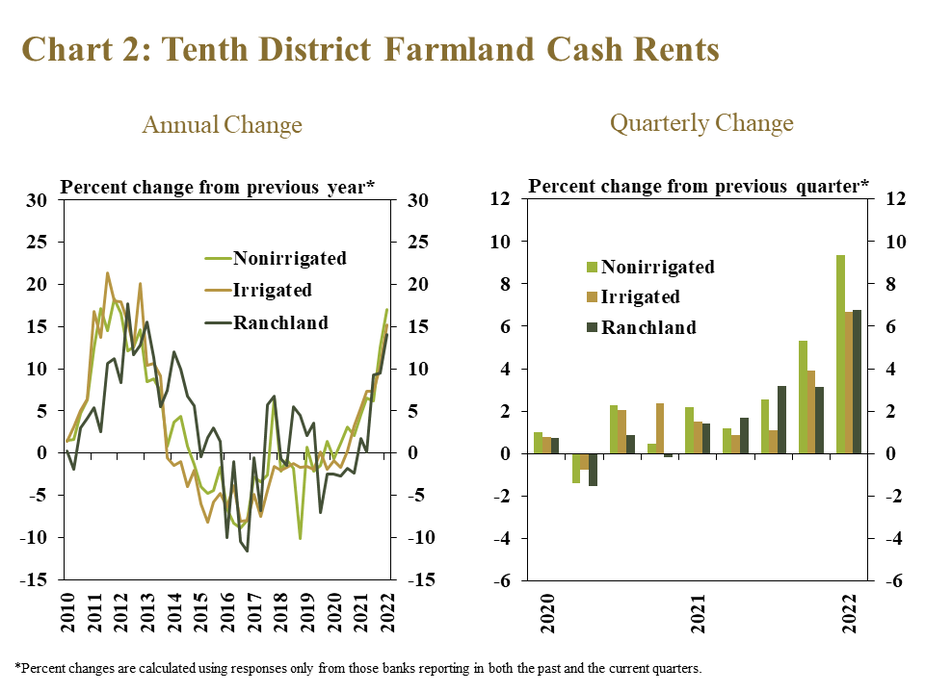
After a year of rapid growth in farm real estate values, gains in cash rents also accelerated. Cash rents for all types of land in the District were about 15% higher than a year ago, the fastest increase since 2013 (Chart 2, left panel). As landowners likely began to adjust rental rates along with growth in land values, leasing costs increased from the previous quarter at a notably quicker pace than previous periods (Chart 2, right panel).

Chart 2: Tenth District Farmland Cash Rents– includes two individual charts. Left, Annual Change- is a line graph showing the percentage change from the previous year* in cash rents for nonirrigated farmland, irrigated farmland and ranchland in every quarter from 2010 to 2022. Right, Quarterly Change - is a clustered column chart showing the percent change from the previous quarter* in cash rents for nonirrigated farmland, irrigated farmland and ranchland in every quarter from 2020 to 2022.  *Percent changes are calculated using responses only from those banks reporting in both the past and the current quarters.

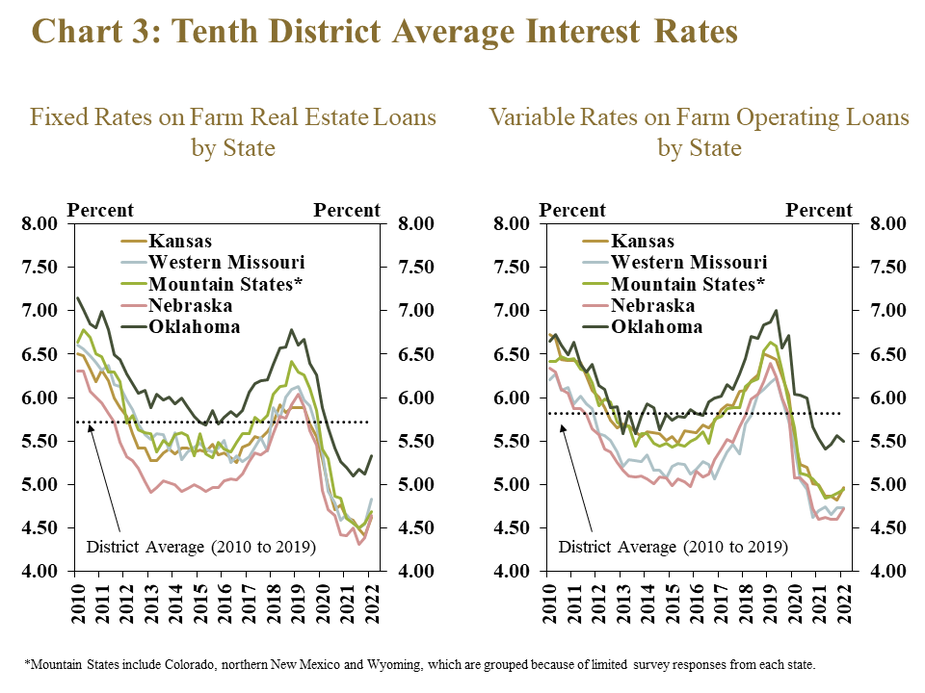
Cash rents and farm real estate values continued to rise despite a slight uptick in farm loan interest rates. The average rate charged on farm real estate loans increased across all states during the late-March survey period, which followed the recent increase in the federal funds rate (Chart 3, left panel). Variable rates on operating loans also increased across nearly all states, but at a slightly slower pace (Chart 3, right panel).

Chart 3: Tenth District Average Interest Rates– includes two individual charts. Left, Fixed Rates on Farm Real Estate Loans by State - is a line graph showing the average fixed interest rate for farm real estate loans in each quarter from 2010 to 2022 with a line for each state (Kansas, Western Missouri, Mountain States*, Nebraska and Oklahoma) and a line showing the District Average from 2010 to 2019. Right, Variable Rates on Farm Operating Loans by State - is a line graph showing the average variable interest rate for operating loans in each quarter from 2010 to 2022 with a line for each state (Kansas, Western Missouri, Mountain States*, Nebraska and Oklahoma) and a line showing the District Average from 2010 to 2019.  *Mountain States include Colorado, northern New Mexico and Wyoming, which are grouped because of limited survey

Section 2: Farm Finances and Loan Demand

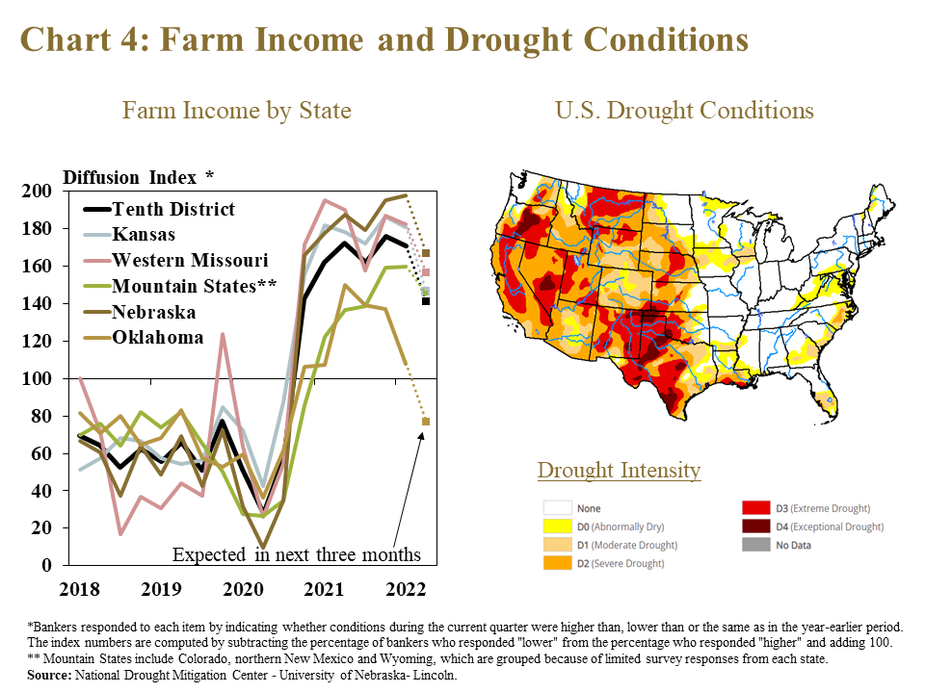
Farm income continued to improve alongside elevated commodity prices, but was expected to soften in coming months. About 75% of bankers reported that farm income was higher than a year ago during the first quarter, but less than 60% expected an increase during the next three months (Chart 4). Conditions were expected to deteriorate during the next quarter in Oklahoma, where extreme drought continued to affect large portions of cattle and livestock production areas.

Chart 4: Farm Income and Drought Conditions– includes two individual panels. Left, Farm Income by State- is a line graph showing the diffusion index* of farm income in each quarter from 2018 to 2022 expectation for the next quarter with a line for each state (Kansas, Western Missouri, Mountain States**, Nebraska and Oklahoma) and the Tenth District. Right, U.S. Drought Conditions - is a U.S. Map showing the intensity of drought with a color gradient.   *Bankers responded to each item by indicating whether the volume of land sales increased, decreased or remain the same. The index numbers are computed by subtracting the percentage of bankers who responded “decreased" from the percentage who responded “increased" and adding 100. **Mountain States include Colorado, northern New Mexico and Wyoming, which are grouped because of limited survey Source: National Drought Mitigation Center - University of Nebraska- Lincoln.

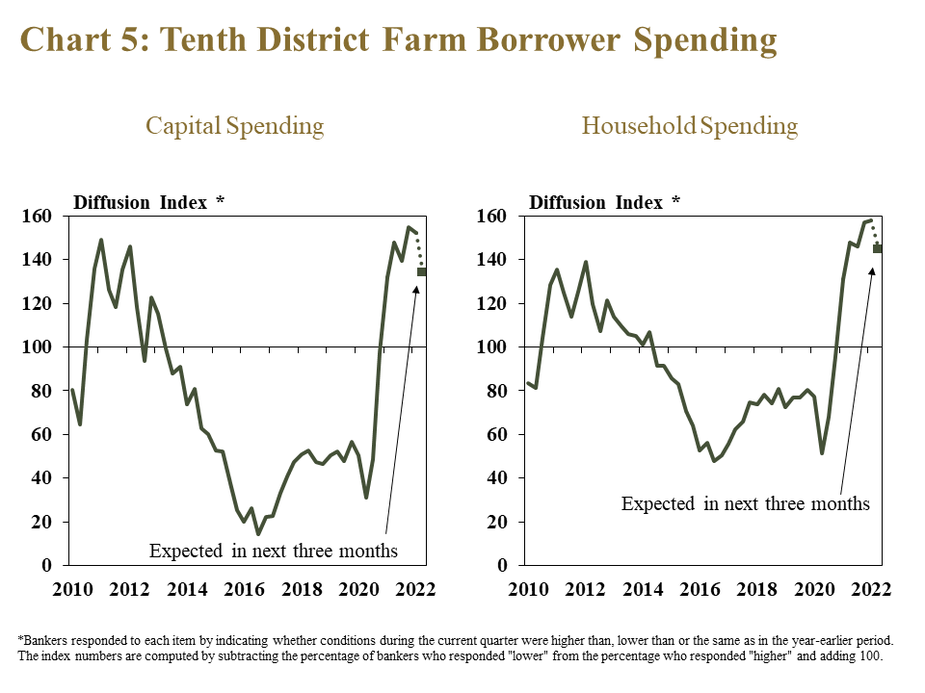
With strong incomes and ample liquidity, borrower spending also continued to increase at a rapid pace. Similar to recent quarters, about 60% of respondents reported that both household and capital spending by farm borrowers was higher than a year ago (Chart 5). Spending has expanded alongside strong liquidity and broad inflationary pressures, but was expected to rise at a slightly slower pace in the months ahead.

Chart 5: Tenth District Farm Borrower Spending – includes two individual charts. Left, Capital Spending- is a line graph showing the diffusion index* of farm borrower capital spending in the Tenth District in each quarter from 2010 to 2022 and the expectation for the next quarter. Right, Household Spending- is a line graph showing the diffusion index* of farm borrower household spending in the Tenth District in each quarter from 2010 to 2022 and the expectation for the next quarter.  *Bankers responded to each item by indicating whether the volume of land sales increased, decreased or remain the same. The index numbers are computed by subtracting the percentage of bankers who responded “decreased" from the percentage who responded “increased" and adding 100.

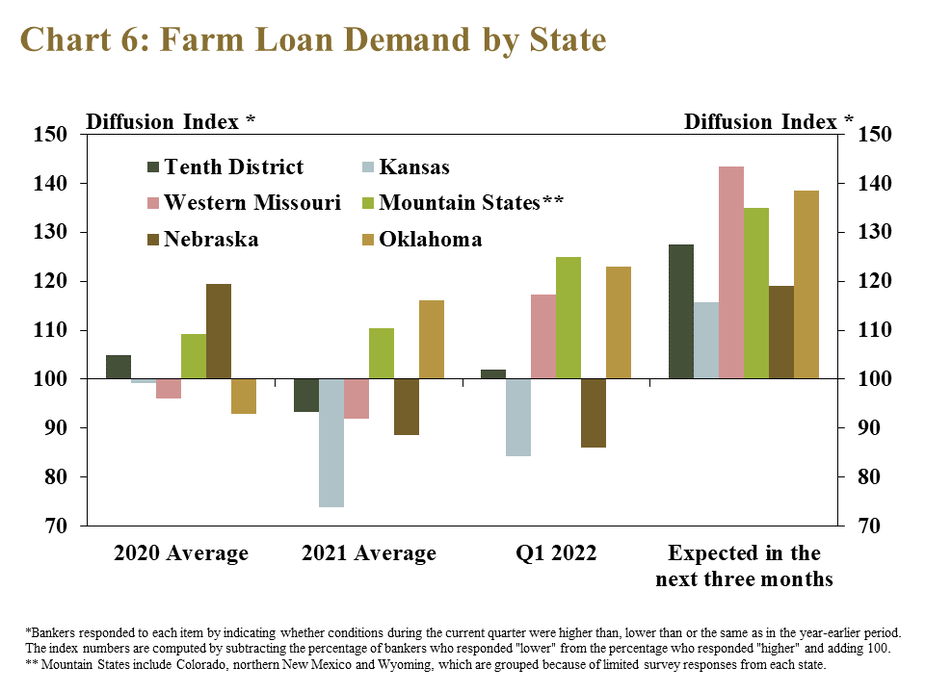
Demand for farm loans was also expected to grow throughout the region as producers absorb higher production expenses. Farm loan demand was higher than a year ago in Missouri, the Mountain States and Oklahoma and remained lower than a year ago in Kansas and Nebraska (Chart 6). Looking ahead to the next quarter, however, demand was expected to increase across all states at the fastest pace since early 2020.

Chart 6: Farm Loan Demand by State–is a clustered column chart showing the diffusion index* of farm loan demand during select periods (2020 Average, 2021 Average, Q1 2022, Expected in the next three months) with columns for each state (Kansas, Western Missouri, Mountain States**, Nebraska and Oklahoma) and the Tenth District.    *Bankers responded to each item by indicating whether the volume of land sales increased, decreased or remain the same. The index numbers are computed by subtracting the percentage of bankers who responded “decreased" from the percentage who responded “increased" and adding 100. **Mountain States include Colorado, northern New Mexico and Wyoming, which are grouped because of limited survey

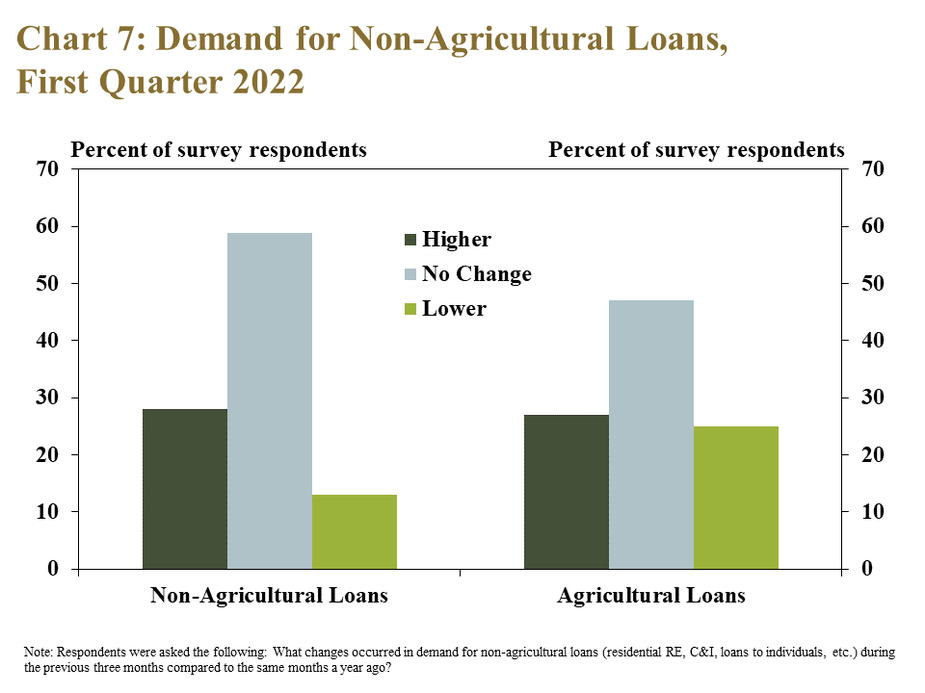
Demand for non-agricultural loans in the District was slightly higher than demand for agricultural loans. The share of banks reporting lower demand for non-agricultural loans was smaller than the share reporting lower demand for agricultural loans (Chart 7). Demand for other types of loans could help support the financial position of agricultural banks with low demand for farm lending and an abundance of liquidity that has contributed to External Linkcompressed net interest margins.

Chart 7: Demand for Non-Agricultural Loans, First Quarter 2022 – is a clustered column chart showing the percent of survey respondents that reported Higher, No Change and Lower demand for Non-Agricultural Loans and Agricultural Loans.     Note: Respondents were asked the following: What changes occurred in demand for non-agricultural loans (residential RE, C&I, loans to individuals, etc.) during the previous three months compared to the same months a year ago?

Section 3: Credit Conditions

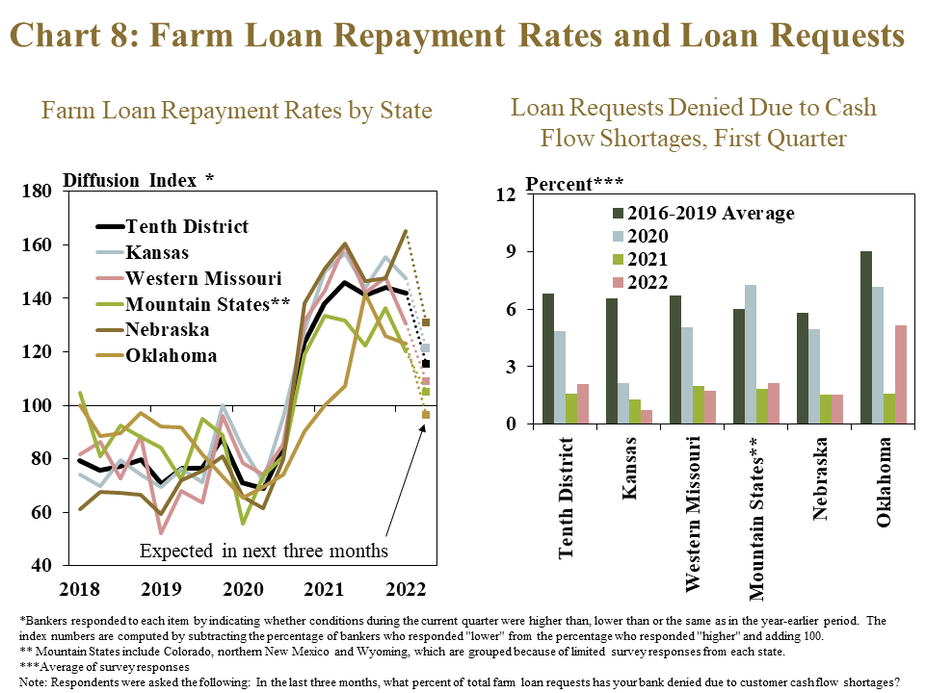
Similar to farm income and loan demand, other measures of credit conditions remained strong, but were expected to soften going forward. About 45% of banks reported that farm loan repayment rates were higher than a year ago during the first quarter, but less than 25% expected an increase during the next three months (Chart 8, left panel). Much like farm income, a decline in loan repayment rates was anticipated in Oklahoma and the rate of loan denials among those lenders was also higher than other states (Chart 8, right panel).

Chart 8: Farm Loan Repayment Rates and Loan Requests – includes two individual charts. Left, Farm Loan Repayment Rates by State- is a line graph showing the diffusion index* of farm loan repayment rates in each quarter from 2018 to 2022 and the expectation for the next quarter with a line for each state (Kansas, Western Missouri, Mountain States**, Nebraska and Oklahoma) and the Tenth District. Right, Loan Requests Denied Due to Cash Flow Shortages, First Quarter- is a clustered column chart showing the percent*** of loans denied due to cash flow shortages during the first quarter in the Tenth District and each state with columns for 2016-2019 Average, 2020, 2021 and 2022.   *Bankers responded to each item by indicating whether the volume of land sales increased, decreased or remain the same. The index numbers are computed by subtracting the percentage of bankers who responded “decreased" from the percentage who responded “increased" and adding 100. **Mountain States include Colorado, northern New Mexico and Wyoming, which are grouped because of limited survey ***Average of survey responses Note: Respondents were asked the following: In the last three months, what percent of total farm loan requests has your bank denied due to customer cash flow shortages?

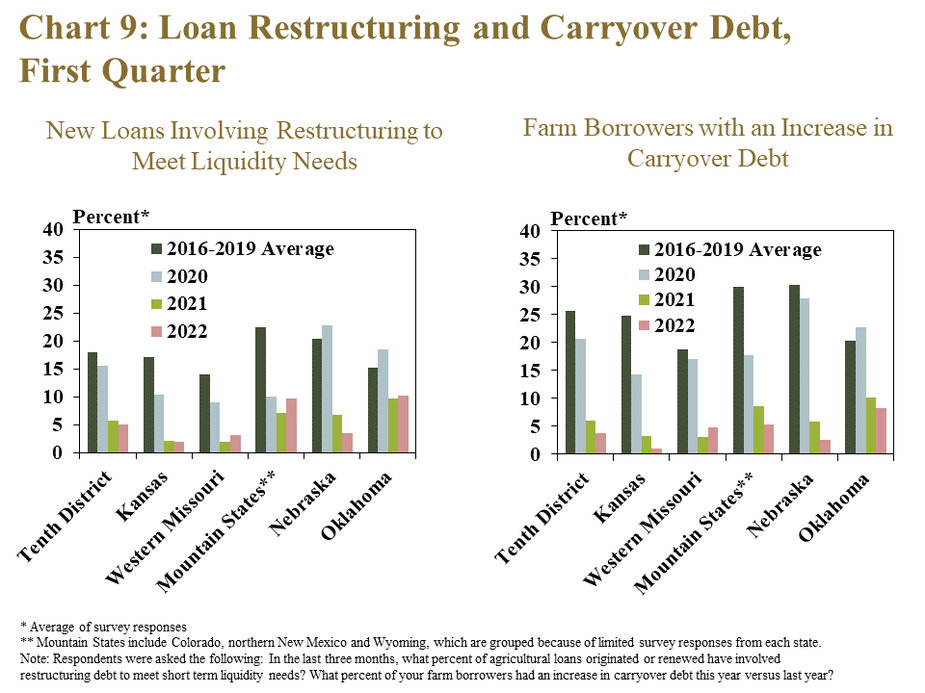
Alongside stronger repayment capacity, carryover debt and loan restructuring also remained limited. The share of new loans that involved restructuring to meet liquidity needs was low across the District despite increasing slightly from a year ago in some states (Chart 9, left panel). Instances of carryover debt reached multi-year lows in nearly all states (Chart 9, right panel).

Chart 9: Loan Restructuring and Carryover Debt, First Quarter – includes two individual charts. Left, New Loans Involving Restructuring to Meet Liquidity Needs- is a clustered column chart showing the percent* of loans involving restructuring to meet liquidity needs during the first quarter in the Tenth District and each state (Kansas, Western Missouri, Mountain States**, Nebraska and Oklahoma) with columns for 2016-2019 Average, 2020, 2021 and 2022. Right, Farm Borrowers with an Increase in Carryover Debt- is a clustered column chart showing the percent* of farm borrowers with an increase in carryover debt during the first quarter in the Tenth District and each state (Kansas, Western Missouri, Mountain States**, Nebraska and Oklahoma) with columns for 2016-2019 Average, 2020, 2021 and 2022.   *Average of survey responses **Mountain States include Colorado, northern New Mexico and Wyoming, which are grouped because of limited survey Note: Respondents were asked the following: In the last three months, what percent of agricultural loans originated or renewed have involved restructuring debt to meet short term liquidity needs? What percent of your farm borrowers had an increase in carryover debt this year versus last year?

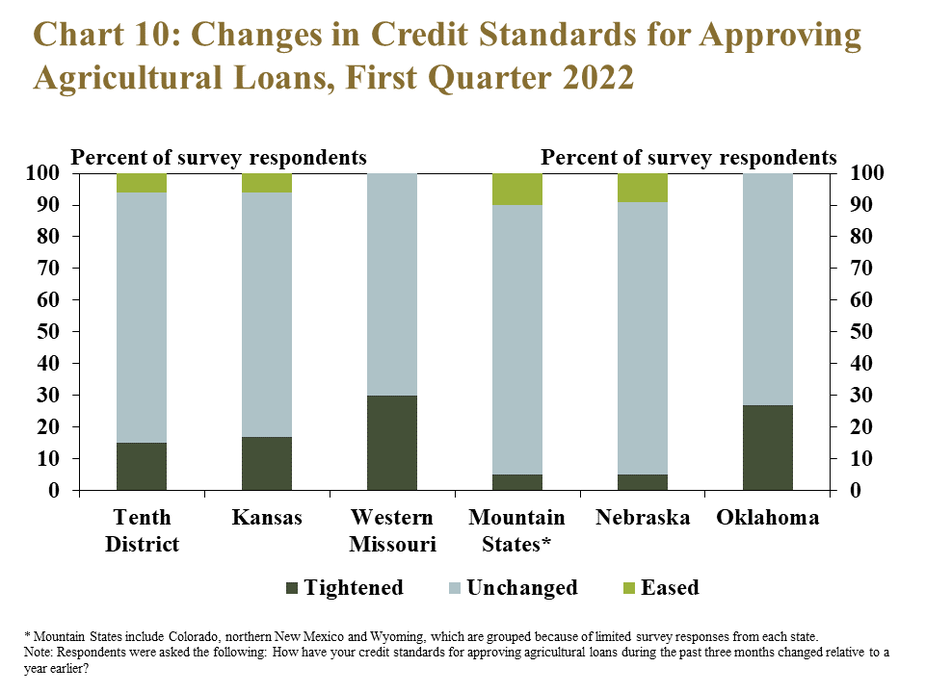
Bankers in some states with a less optimistic outlook for credit conditions were more likely to report a move toward stricter standards for loan approvals. About 15% of respondents in the District indicated that standards for approving agricultural loans tightened compared with last year (Chart 10). The share was twice as high in western Missouri and Oklahoma and lower than the regional average in the Mountain States and Nebraska.

Chart 10: Changes in Credit Standards for Approving Agricultural Loans, First Quarter 2022–is a stacked column chart showing the percent of survey respondents that reported that credit standards for approving loans were tightened, unchanged or eased during the first quarter of 2022 compared with the same time a year ago. It includes columns adding to 100 percent for the Tenth District and each state (Kansas, Western Missouri, Mountain States*, Nebraska and Oklahoma).  *Mountain States include Colorado, northern New Mexico and Wyoming, which are grouped because of limited survey Note: Respondents were asked the following: How have your credit standards for approving agricultural loans during the past three months changed relative to a year earlier?

First Quarter 2022 Banker Comments from the Tenth District

“The main concern in our area is dry conditions heading into the growing season along with higher input costs.” – Eastern Colorado

“Customers are experiencing a dramatic increase in fertilizer, chemical and fuel costs. In the year ahead I predict that overall yields will be down because of a cut back of input use, but there will also be large increases in cattle and crop prices.” – Southern Colorado

“This year is expected to be very difficult in this region due to drought and high commodity input prices.” – Northern Wyoming

“The main concerns in our area are drought and high fuel costs.” – Eastern Wyoming

“Input costs are altering farm decisions from previous years, especially in dry areas of our lending region.” – Northern Oklahoma

“The drought the Oklahoma Panhandle is going to really hurt farmers’ ability to have a good wheat crop this year and get to participate in the high grain prices.” – Western Oklahoma

“Main borrower concerns are energy prices, and while commodity prices are helping cash flow and attitudes; the uncertainty of the current political climate and inflation are difficult for some of our borrowers in planning.” – Southeast Kansas

“If the drought in our area continues it will result in negative effects on our loan customers.” – Northwest Kansas

“Inflation is a problem and higher crop input costs are eroding farm profitability.” – Central Kansas

“Strong investment demand for farmland in our area is a major driving force with new buyers from all across the map and competition for land is at an all-time high with producers looking to counteract their machinery, labor, and technology costs across more acres.” – Central Missouri

“In addition to much higher input costs, there are also concerns over the high rate of inflation and the impact that it is having on real estate, vehicle, and equipment values.” – Western Missouri

“Almost every 2022 cash flow projection we did in our bank during renewals showed that there is still room to make a good profit and increase liquidity despite the increase in fertilizer costs. Not as good as 2021, but still good.” – Northeast Nebraska

“Drought, increased fertilizer, chemical and fuel costs and rising interest rates are the primary concerns in our area.” – Southwest Nebraska

Data Files: Excel SpreadsheetCredit Conditions  | Excel SpreadsheetFixed Interest Rates | Excel SpreadsheetVariable Interest Rates  | Excel SpreadsheetLand Values

A total of 151 banks responded to the First Quarter Survey of Agricultural Credit Conditions in the Tenth Federal Reserve District—an area that includes Colorado, Kansas, Nebraska, Oklahoma, Wyoming, the northern half of New Mexico and the western third of Missouri. Please refer questions to Nathan Kauffman, economist or Ty Kreitman, assistant economist at 1-800-333-1040.

The views expressed in this article are those of the authors and do not necessarily reflect the views of the Federal Reserve Bank of Kansas City or the Federal Reserve System. 

Authors

Nate Kauffman

Senior Vice President, Economist, and Omaha Branch Executive

Nate Kauffman is Senior Vice President and Omaha Branch Executive at the Federal Reserve Bank of Kansas City. In his role as the Kansas City Fed's lead economist and represe…

Ty Kreitman

Associate Economist

Ty Kreitman is an associate economist in the Regional Affairs Department at the Omaha Branch of the Federal Reserve Bank of Kansas City. In this role, he primarily supports the F…