Lending activity in the agricultural sector increased slightly in the second quarter of 2018, supported by larger loans for livestock. In the short term, higher livestock prices in the first half of the quarter likely were responsible for the increased size of livestock loans. Longer term, the size of livestock loans also has been trending higher, suggesting that consolidation has contributed to fewer, larger farms with larger lending needs. Increased lending on farm operations comes amid increasing risk in the agricultural sector, as expectations of large supplies and trade disputes have contributed to sharp declines in June of prices for most major agricultural commodities.
Section A: Second Quarter National Farm Loan Data
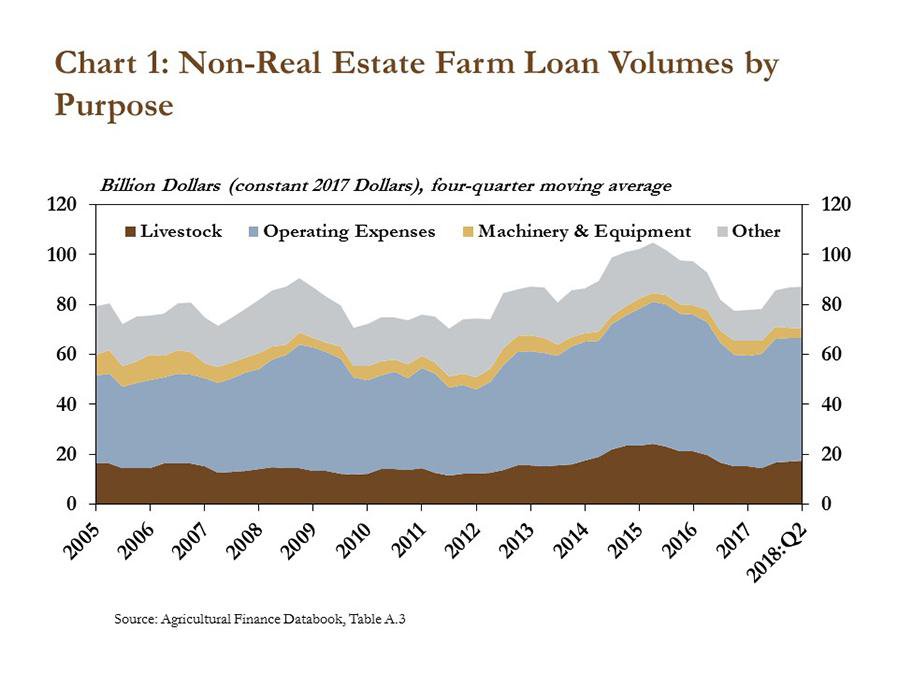
Farm lending activity increased slightly in the second quarter, according to the National Survey of Terms of Lending to Farmers. The total volume of non-real estate farm loans was about 2 percent higher than the same period last year. After falling to five-year lows in 2017, the volume of farm loans grew leading into 2018 and has continued to increase in the second quarter (Chart 1). Adjusted for inflation, livestock loans reached a historical high for the second quarter while the volume of farm machinery and equipment loans has narrowed to the lowest second-quarter level since 2015.
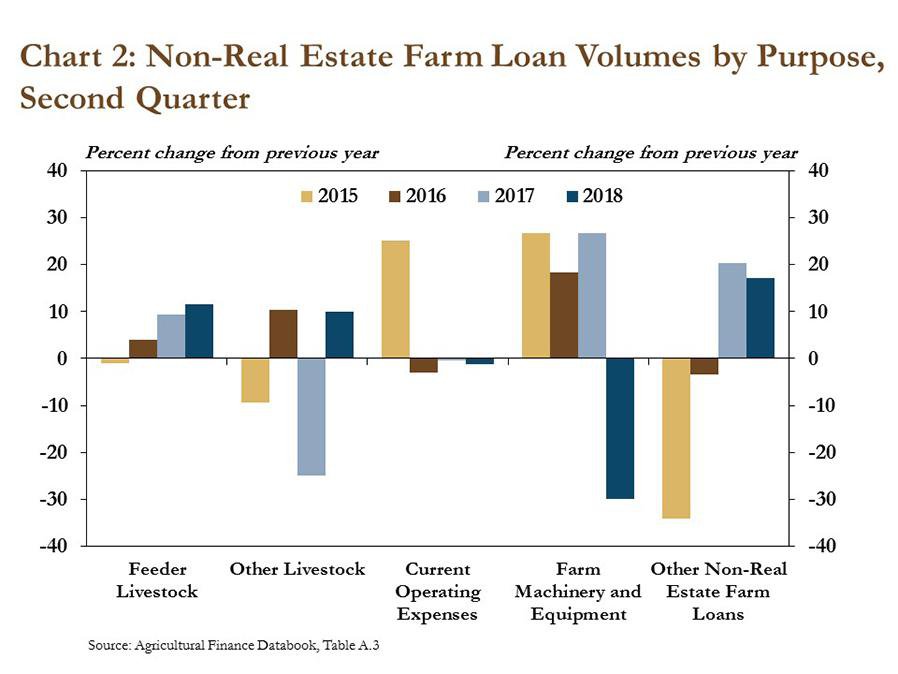
Total loan volumes increased relative to last year, driven primarily by moderate increases in livestock loans. Loans for both feeder and other livestock increased 10 percent from a year ago (Chart 2). In contrast, farm machinery and equipment lending contracted nearly 30 percent, following three consecutive years of increases. Loans to finance farm machinery and equipment make up the smallest category of agricultural loans at commercial banks. Therefore, although the decline in machinery and equipment loans was large, the overall impact on total loan volumes was relatively small. In addition, loans to finance current operating expenses, the largest category of farm loans at commercial banks, declined slightly. However, despite declines in other types of loans, the increase in livestock loans was large enough to boost total loan volumes in the second quarter.
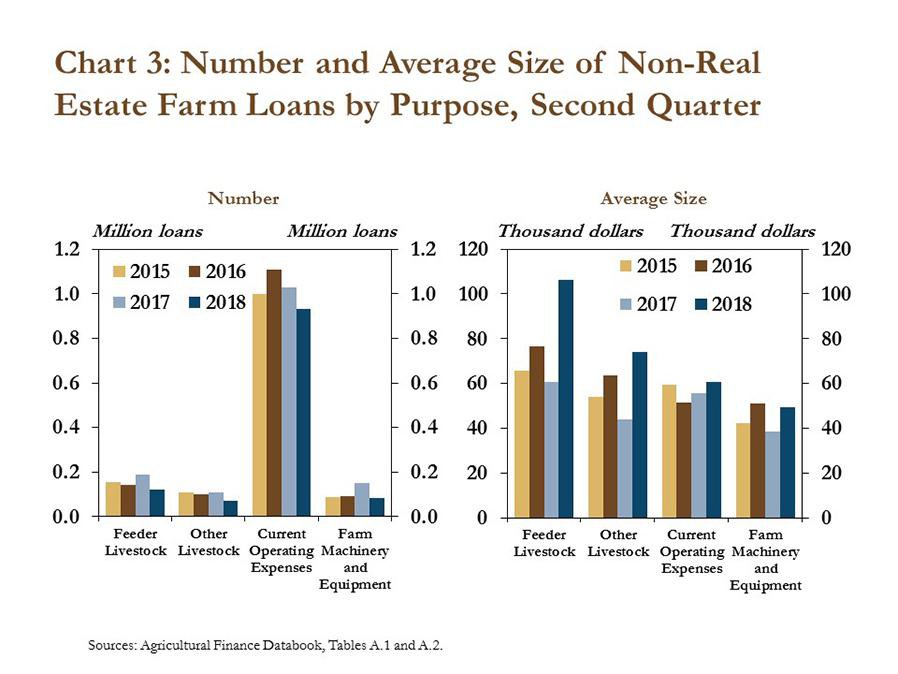
Despite fewer loans being originated in the second quarter, larger loan sizes, particularly for livestock, supported higher total loan volumes. The number of livestock loans originated in the second quarter declined 35 percent, on average, compared to the previous year (Chart 3, left panel). However, the average size of loans for feeder livestock and other livestock increased 75 percent and 70 percent, respectively (Chart 3, right panel). Larger loans in the livestock sector could be the result of higher prices for feeder and breeding animals in the second quarter and longer-term implications of increasing consolidation.
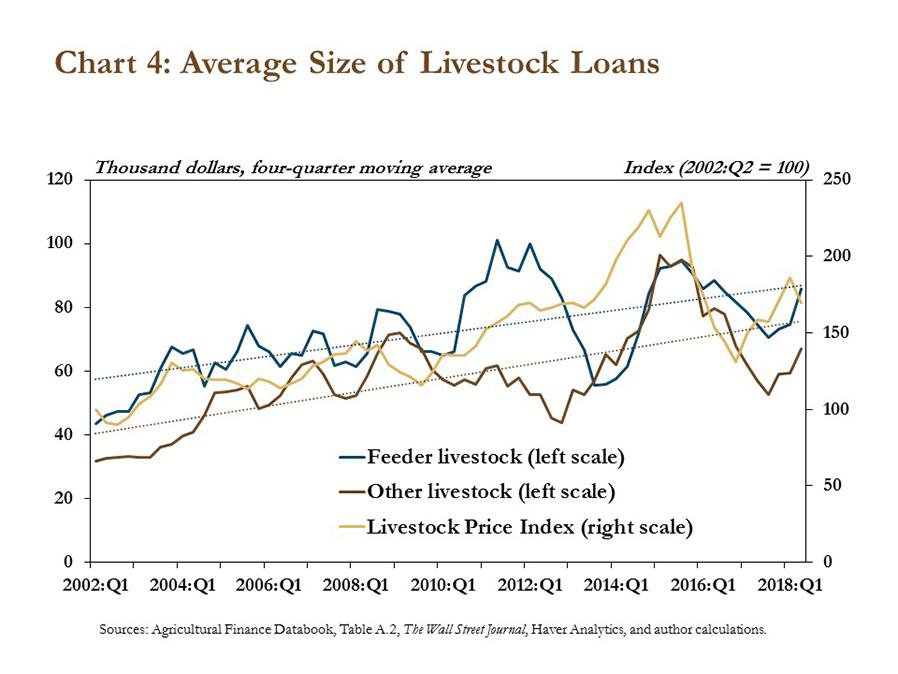
Alongside significant gains in the first quarter, the average size of livestock loans historically has trended higher. Corresponding to steep declines in market prices for livestock in 2016, the average size of livestock loans declined in 2016 and the first half of 2017 but has rebounded since (Chart 4). In fact, the size of loans to purchase feeder livestock increased back to trend levels in the second quarter of this year. The average size of loans to purchase other livestock has been below trend since the fourth quarter of 2016 but since then has increased for four quarters. Although the actual sizes of livestock loans tend to follow prices for feeder and breeding animals, trend loan sizes could continue to increase in the future due to consolidation.
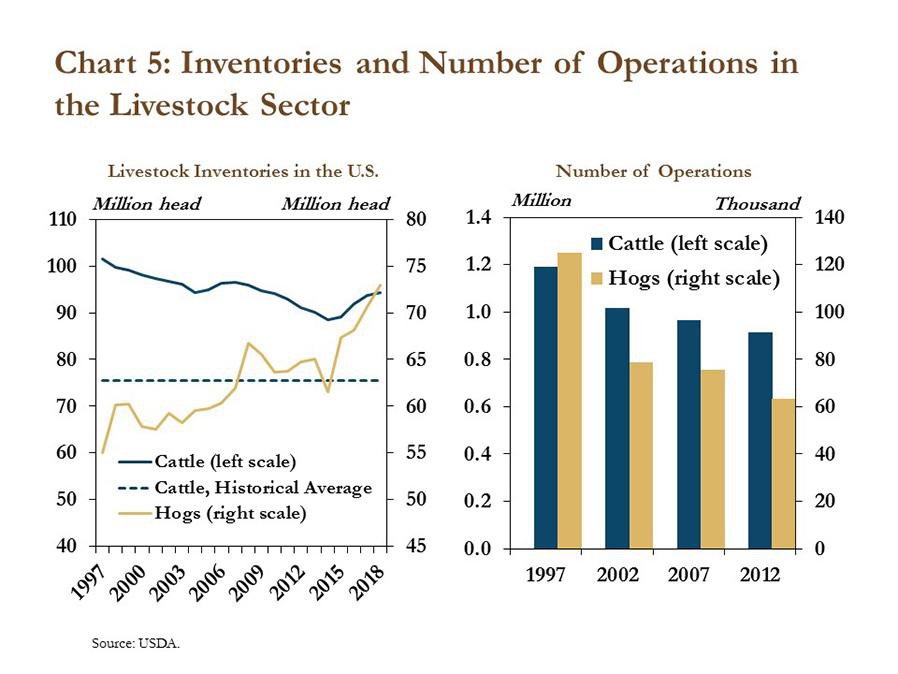
Consolidation in the livestock sector has led to larger inventories on fewer farms with greater financing needs. For example, in the hog industry, inventories in the last 20 years have grown significantly (Chart 5, left panel). Over the same period, the number of hog operations has declined almost 50 percent (Chart 5, right panel). Larger inventories on fewer farms indicate that remaining farms have grown and/or consolidated. There also has been consolidation in cattle and other industries, but at a slower pace.1 As the industry transitions to fewer, larger farms, lending needs per farm will be likely to increase.
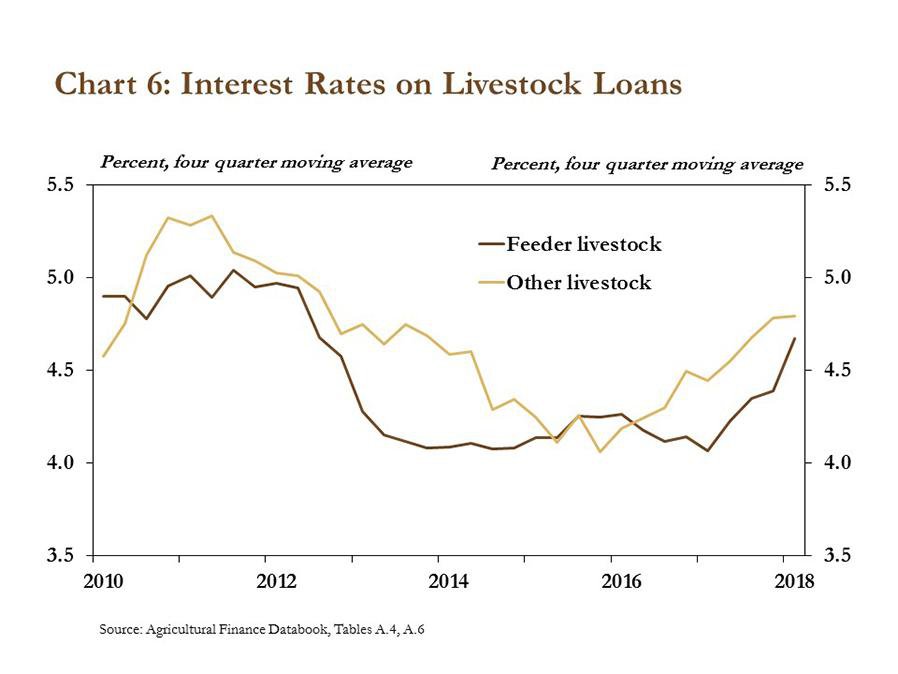
Increased lending and larger loan sizes in the livestock sector have coincided with higher interest rates on livestock loans. Interest rates on feeder livestock loans have increased 15 percent from last year, and interest rates on loans to finance other livestock have increased 18 percent since the first quarter of 2016 (Chart 6). Higher interest rates on larger loans have increased debt obligations for farmers. Although the increase in interest expense has remained relatively small compared with other expenses on farm balance sheets, higher expenses during a period of relatively tighter profit margins (compared to previous years), increased market volatility and trade uncertainty could put additional pressure on some livestock operations.
Section B: First Quarter Call Report Data
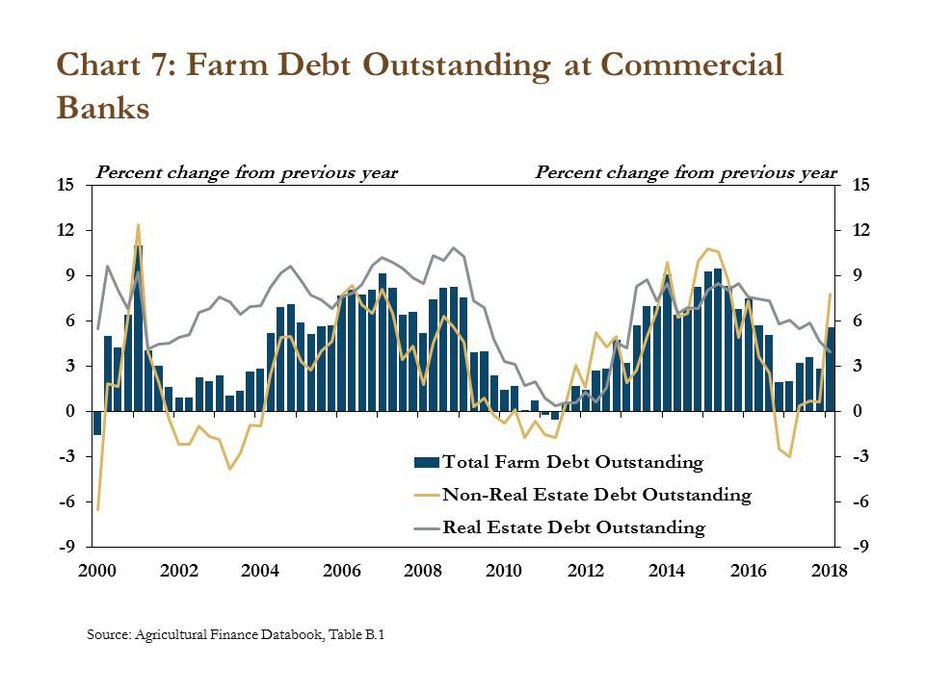
Farm debt outstanding increased at a faster pace in the first quarter. The increase primarily was driven by larger increases in non-real estate debt (Chart 7). After declining sharply in 2016 and remaining slow in 2017, the pace of growth in non-real estate debt rose to almost 8 percent in the first quarter of 2018. Although the pace of growth in real-estate debt has slowed somewhat from previous years, outstanding loans for farm real estate still were up 4 percent from the previous year.
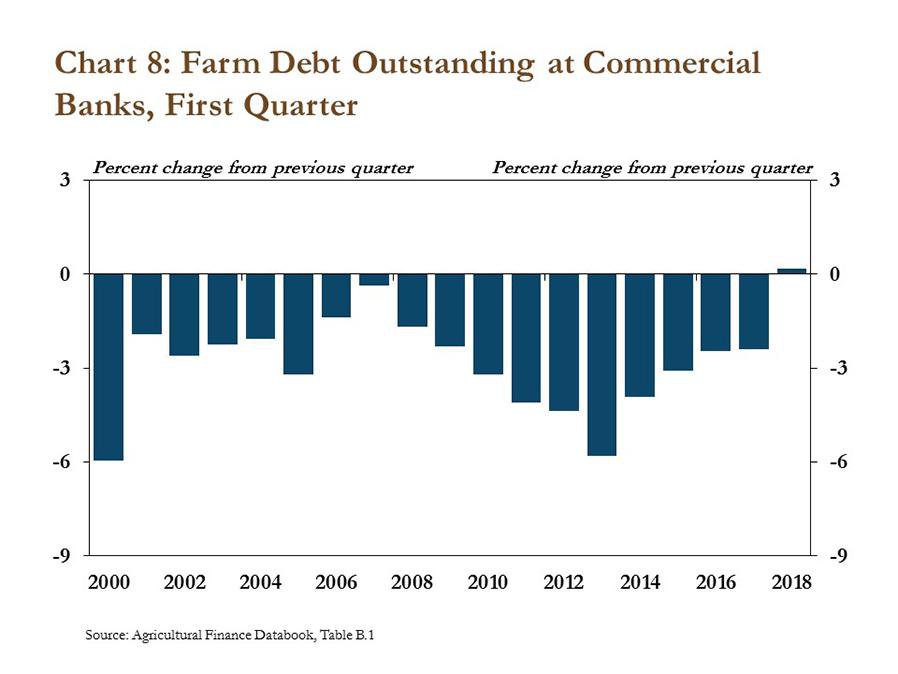
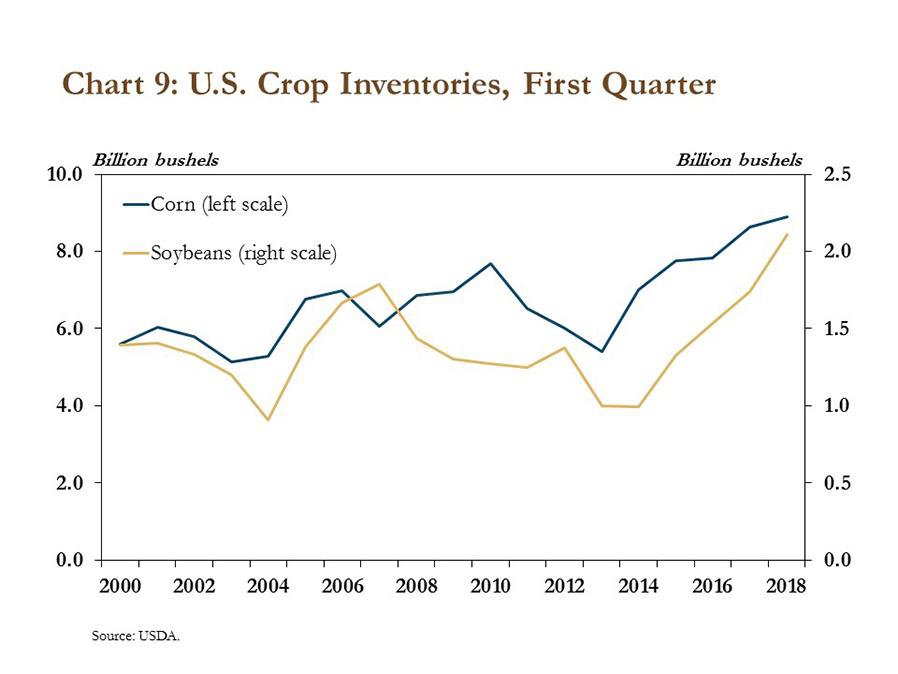
Farm debt at commercial banks also increased from the fourth quarter to the first quarter for the first time since quarterly information was collected in 1987. Loan volumes typically decrease in the first quarter as farmers pay down annual operating lines following seasonal harvest in the fall. More crops in storage seem to have contributed to a shift from typical seasonal trends as farm debt in the first quarter increased 0.2 percent from the previous quarter (Chart 8). Since 2014, stocks of soybeans have doubled, and corn inventories also have increased significantly (Chart 9). Although record levels of crop production have contributed to growing inventories, it also appears that producers are storing larger quantities of grain and oilseeds through the end of the year in hopes that prices will improve.
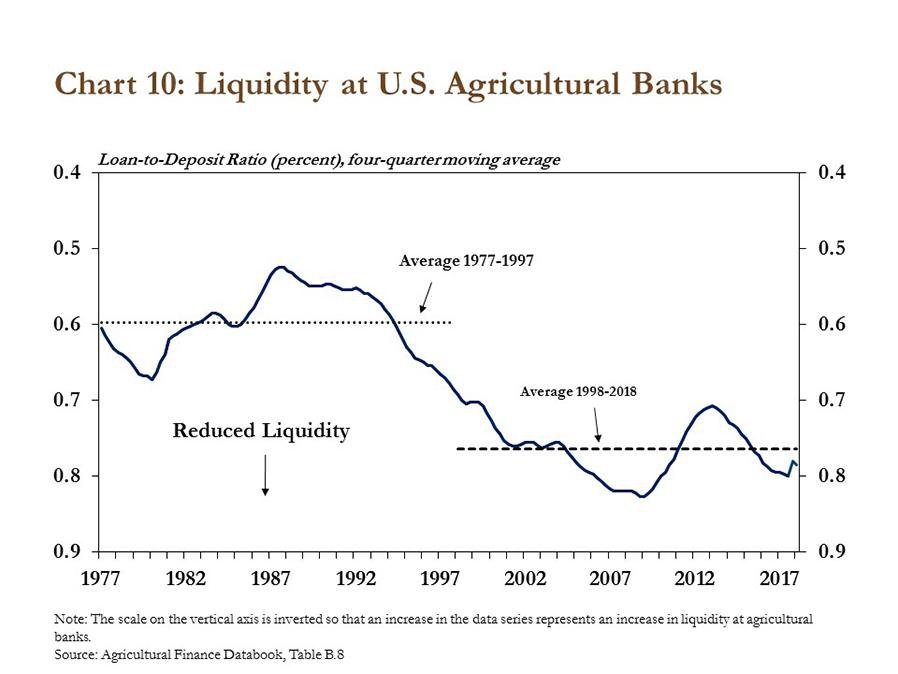
Growing farm debt also has continued to weigh on liquidity at agricultural banks. Loan-to-deposit ratios at agricultural banks have increased 10 percent since the first quarter of 2013, indicating a modest reduction in available funds (Chart 10). Despite a slight increase in the fourth quarter of 2017, liquidity decreased slightly in the first quarter of 2018 and the loan-to-deposit ratio remained near 80 percent. If farm debt continues to increase while agricultural commodity prices and incomes remain subdued, liquidity may remain tight in the coming months.
Section C: First Quarter Regional Agricultural Data
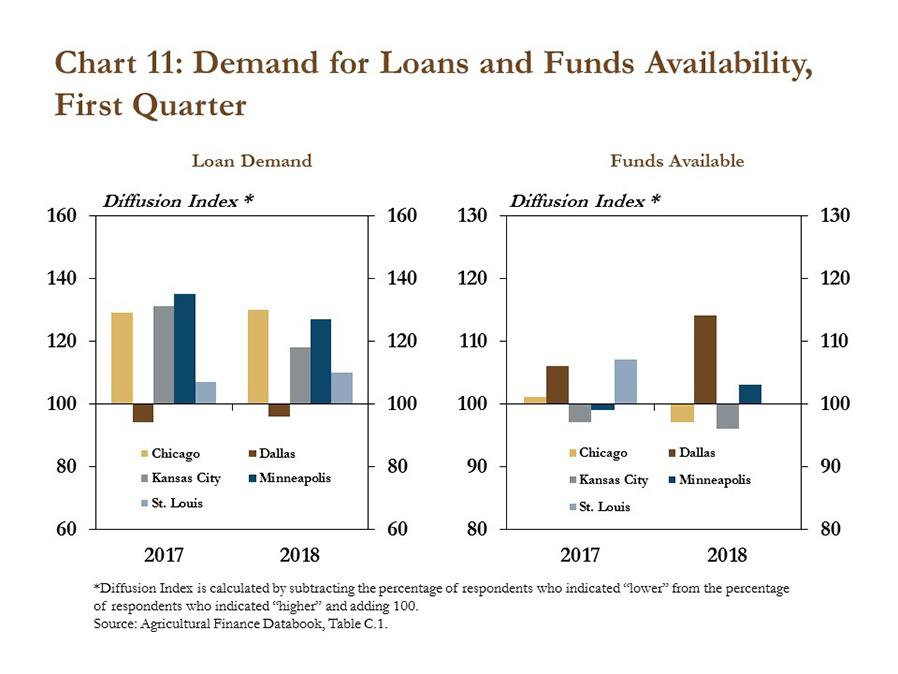
Similar to national trends, indicators of farm loan demand remained strong in most Federal Reserve Districts, but measures of fund availability have indicated tightening liquidity in some regions. Demand remained relatively steady in the Chicago and St. Louis Districts and was slightly lower in the Kansas City and Minneapolis Districts compared with a year ago (Chart 11). The majority of bankers in the Dallas District continued to report slightly lower demand for farm loans, likely a result of strong cotton markets in recent years. The Dallas and Minneapolis Districts reported slightly higher fund availability, while the prolonged trend of strong farm loan demand may be weighing on liquidity in some areas as measures of funds availability were slightly lower in the Chicago, Kansas City and St. Louis Districts.
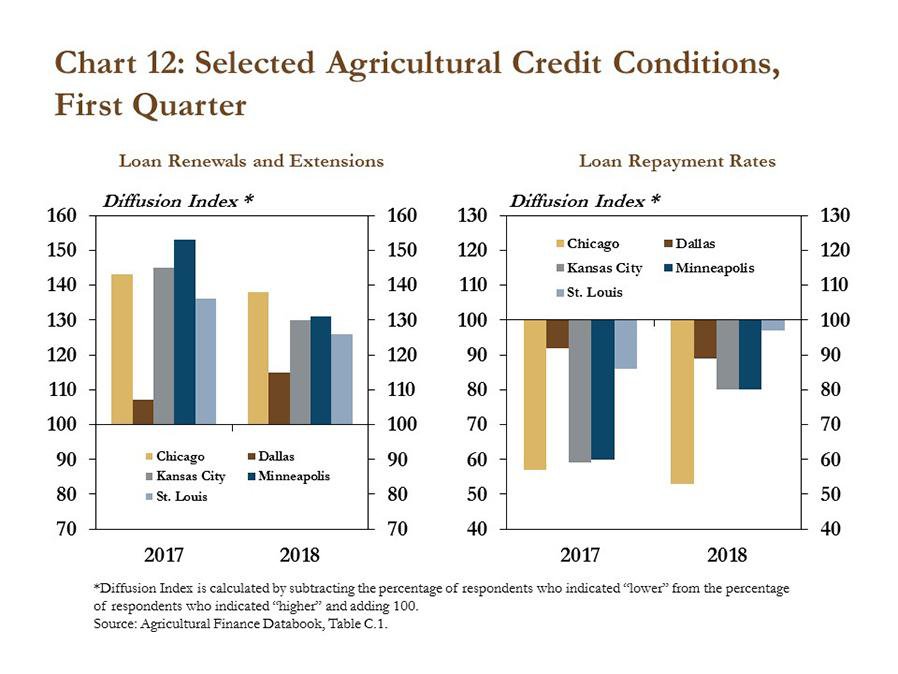
Other measures of farm lending across Federal Reserve Districts also remained similar to recent quarters. Similar to a year ago, all Districts reported further increases in loan renewals and extensions, but the pace of growth declined slightly, with the exception of the Dallas District (Chart 12). The rate of loan repayments continued to decrease in all Districts. The pace of decline in repayment rates was relatively steady in the Chicago and Dallas Districts, but slowed across all others, which could be an indication of stabilizing credit conditions relative to prior quarters.
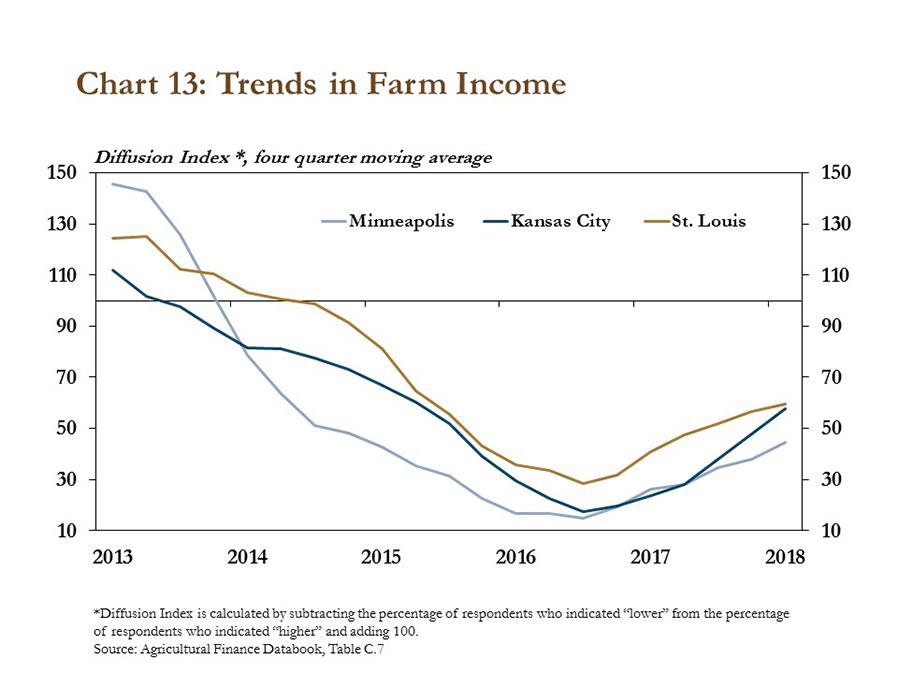
Financial conditions for farmers also showed some signs of steadying in the first quarter. Since reaching historical lows in 2016, farm income has stabilized over the last four quarters in the Minneapolis, Kansas City and St. Louis Districts (Chart 13). Recent declines in the prices of key agricultural commodities could lead to further reductions in farm income, however, and expenses generally have remained elevated. Interest expenses associated with farm loans also increased slightly in the first quarter as interest rates continued to edge higher.
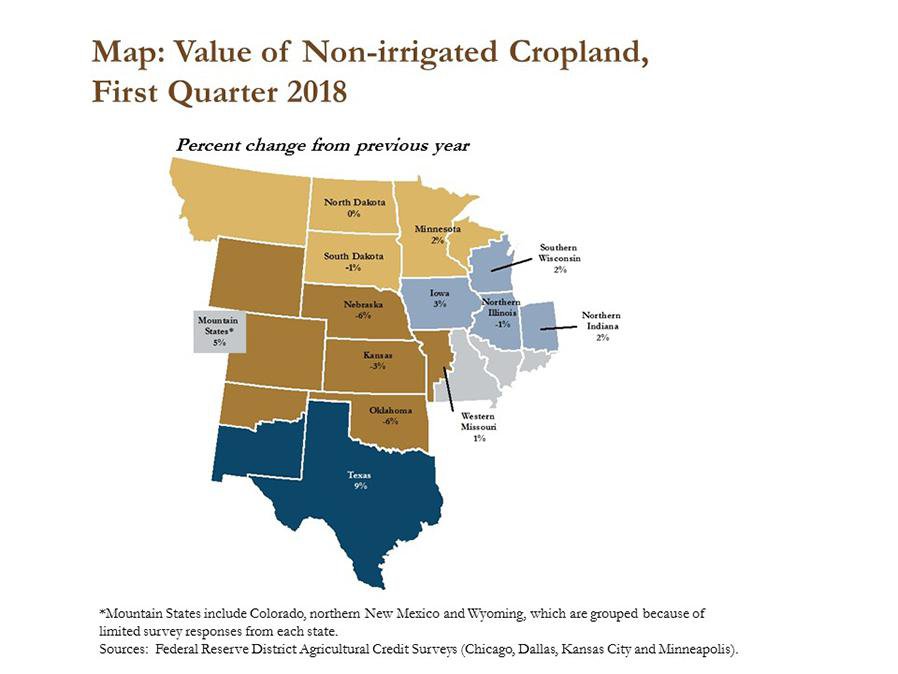
Amid deteriorating credit conditions and increasing interest rates, farm real estate values declined throughout most of the central plains region. While most regions reported only small changes in non-irrigated farmland values compared to the prior year, some others reported modest increases or decreases. The largest annual change was reported in Texas, where the value of non-irrigated cropland increased 9 percent. In contrast, values in both Nebraska and Oklahoma decreased 6 percent (Map). Overall, farmland values have continued to hold relatively steady in comparison to historically weak agricultural credit conditions, and the variations among regions are likely influenced by differences in conditions across individual commodities.
Conclusion
Farm lending activity picked up slightly in the first quarter of 2018 as the size of livestock loans was up sharply from a year ago. Seasonal trends in farm debt outstanding also deviated from historic norms as grain inventories continued to grow through the first quarter. The high demand for farm loans has led to lower liquidity at agricultural banks and at the same time, agricultural lenders have continued to report lower rates of repayment, and interest rates have continued on an upward trend.
_________________________________________________________________________
1For more information on consolidation in the agricultural sector, see materials from the 2017 Agricultural Symposium: Agricultural Consolidation: Causes & the Path Forward.
Data and Information
The views expressed are those of the authors and do not necessarily reflect the positions of the Federal Reserve Bank of Kansas City or the Federal Reserve System.
Authors

Cortney Cowley
Assistant Vice President and Oklahoma City Branch Executive
