Agricultural credit conditions in the Tenth District remained subdued but deterioration slowed in the third quarter. As row crop prices increased during recent months, farm income and loan repayment rates declined at the slowest pace since early 2024 across most of the region. Although credit conditions remained tight, problem loan rates were steady and the share of lenders reporting severe farm loan portfolio stress remained limited. Despite tight farm finances and slightly higher interest rates, cropland values remained strong and growth in ranchland values was notable.
Although the outlook for the agricultural economy remained subdued, acceleration in financial stress eased alongside some relief from higher crop prices. The spike in fuel prices as harvest neared raised concerns about costs, but External Linkhigher crop prices likely mitigated the additional margin pressures for many farms. In addition, the recent distribution of crop insurance payments has likely provided modest support. While some pressures have eased, profit opportunities remain narrow and risks of gradual deterioration in farm financial conditions are still elevated.
Section 1: Farm Finances and Credit Conditions
Deterioration in farm financial conditions eased alongside higher crop prices. The pace of decline in farm income slowed for the fourth consecutive quarter (Chart 1). Cattle prices remained strong despite declining slightly in recent months and crop prices increased to their highest level since 2024, likely boosting revenue for crop farmers.
Chart 1: Tenth District Farm Income and U.S. Agricultural Commodity Prices
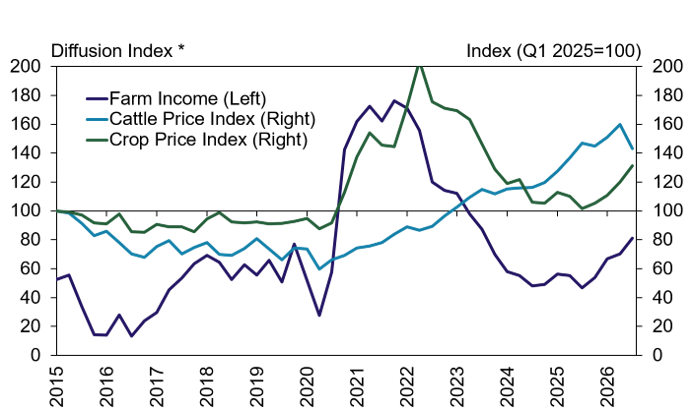
*The index numbers are computed by subtracting the percentage of respondents who responded "lower" from the percentage who responded "higher" and adding 100.
Note: The crop price index is the average index of prices for corn, soybeans and wheat.
Sources: Wall Street Journal, CME Group, Haver Analytics, and Federal Reserve Bank of Kansas City staff calculations
Despite reduced pressure in most Tenth District states, conditions in Oklahoma tightened. The pace of decline in farm income slowed in all states expect Oklahoma (Chart 2, left panel). More than 40% of lenders in Oklahoma reported that farm income was lower than a year ago, up from 10% in the previous quarter (Chart 2, right panel). High cattle prices had supported farm income in the state during recent months, but respondents highlighted growing concerns about drought and rising costs.
Chart 2: Farm Borrower Income by State
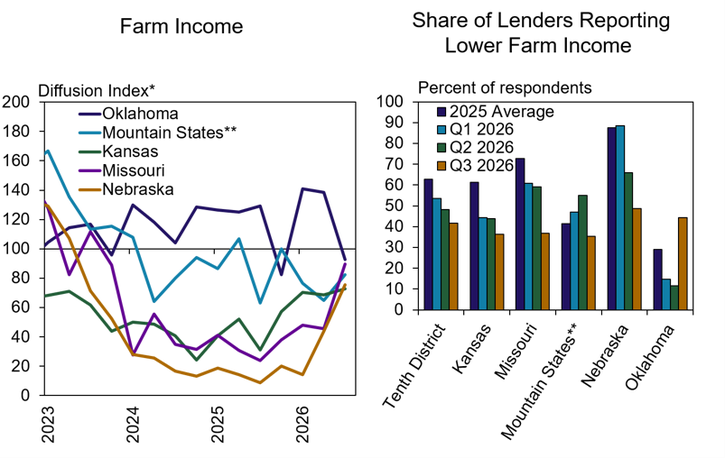
*The index numbers are computed by subtracting the percentage of respondents who responded "lower" from the percentage who responded "higher" and adding 100.
** Mountain States include Colorado, northern New Mexico and Wyoming, which are grouped because of limited survey responses from each state.
Alongside a slower decline in farm income, deterioration in agricultural credit conditions remained modest. District lenders reported that loan repayment rates declined only slightly from a year earlier (Chart 3, left panel). About 30% of Oklahoma lenders reported that repayment rates were lower than a year ago, compared with about 15% of in other states (Chart 3, right panel).
Chart 3: Tenth District Farm Loan Repayment Rates
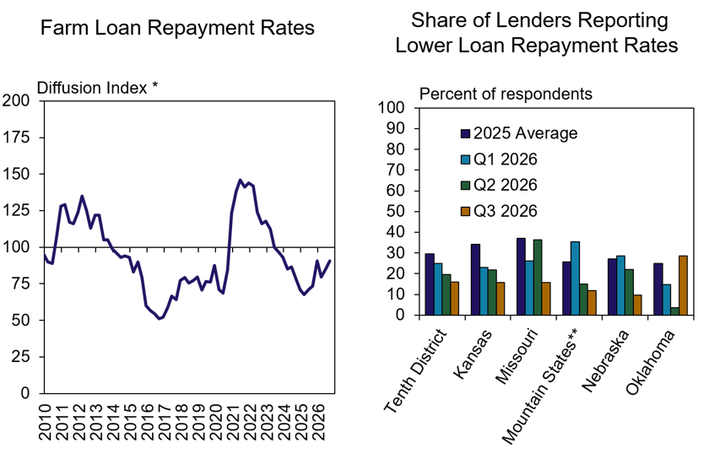
*The index numbers are computed by subtracting the percentage of respondents who responded "lower" from the percentage who responded "higher" and adding 100.
Problem loan rates were steady and remained modest for most lenders. The share of lenders with more than 10% of their farm loan portfolio on the watch list fell slightly from around 30% in 2025 to about 25% in 2026 (Chart 4, left panel). However, the share of lenders with 5% to 10% of their portfolio on the watch list rose slightly over the same period. The share of lenders with loans on the classified list remained nearly unchanged (Chart 4, right panel).
Chart 4: Distribution of Problem Loan Rates, Q3
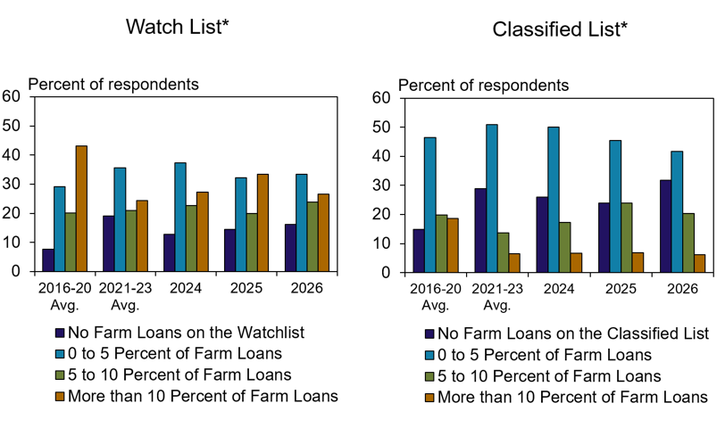
*For purposes of this article, a “Watch List” loan is interpreted as a qualifying credit but is being closely monitored for potential problems (deterioration in borrower financial conditions, management changes, etc.). A “Classified List” loan is a loan with a defined weakness (inadequate debt service, insolvent collateral position, etc.) that requires specific documentation and potential bank reserve adjustments.
Note: Respondents answered the following question – What percentage of your farm loan portfolio is currently on the ‘Watch” and “Classified” lists?
Liquidation to improve balance sheets was also steady and remained minimal for most lenders. A quarter of lenders reported they had no farm borrowers planning to sell mid- to long-term assets to improve working capital and another quarter had less than 5% of borrowers with any liquidation plans (Chart 5). Only about a fifth of lenders reported that more than 10% of their farm borrowers were planning to sell assets, similar to a year ago.
Chart 5: Share of Borrowers Planning to Sell Mid-to Long-Term Assets, Q3
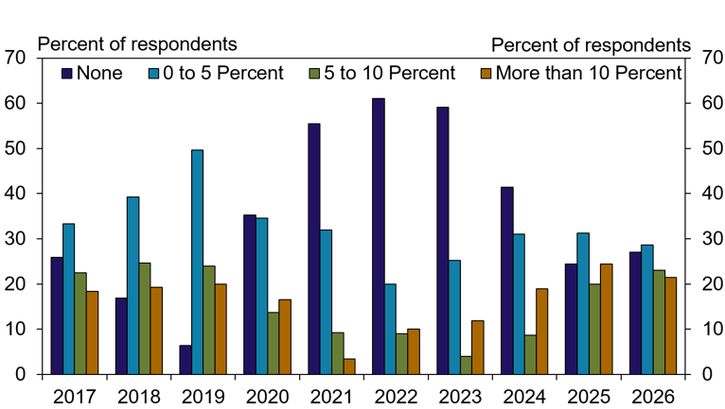
Note: Respondents answered the following question – What percent of your farm borrowers plan to sell mid-to-long term assets before the end of the year in an effort to improve available working capital or make loan payments?
With some easing in financial pressures in recent months, growth in loan demand showed signs of cooling. The pace of increase in demand for non-real estate farm loans was similar to last quarter and slower than recent years (Chart 6). Consistent with historical patterns, lenders also reported that fund availability had become more balanced alongside softer loan demand.
Chart 6: Tenth District Farm Loan Demand and Fund Availability
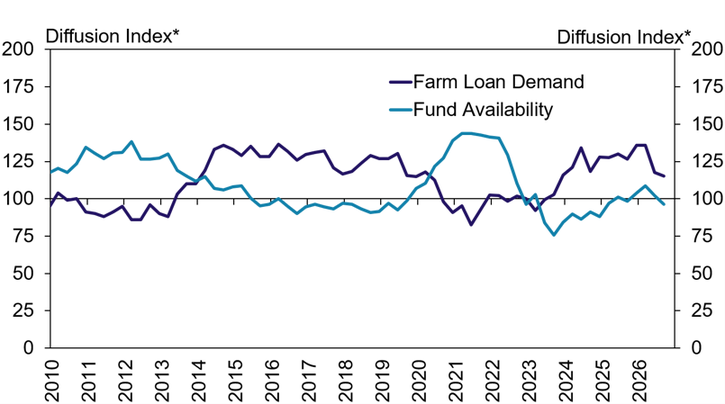
*The index numbers are computed by subtracting the percentage of respondents who responded "lower" from the percentage who responded "higher" and adding 100.
Section 2: Interest Rates and Farmland Values
Growth in loan demand also eased alongside a slight increase in farm loan interest rates. Average interest rates on farm loans edged up from the second quarter to about 7% for real estate loans and 7.5% for operating loans (Chart 7). The increase was broadly consistent across all states and rates remained substantially above their 20-year averages.
Chart 7: Average Tenth District Farm Loan Interest Rates
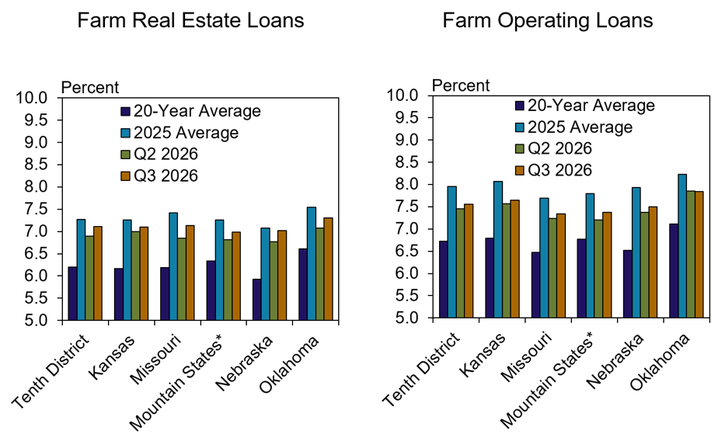
*Mountain States include Colorado, northern New Mexico and Wyoming, which are grouped because of limited survey responses from each state.
Note: Computed using the average of both fixed and variable rates.
Cropland values remained firm and ranchland values showed further signs of strength. District ranchland values rose almost 10% from last year, irrigated cropland values increased by 5%, and nonirrigated cropland values held steady (Chart 8, left panel). Although cash rents for irrigated and nonirrigated land were unchanged from last year, they recovered after weakening earlier in 2026 as commodity prices rose (Chart 8, right panel).
Chart 8: Tenth District Farmland Values and Cash Rents
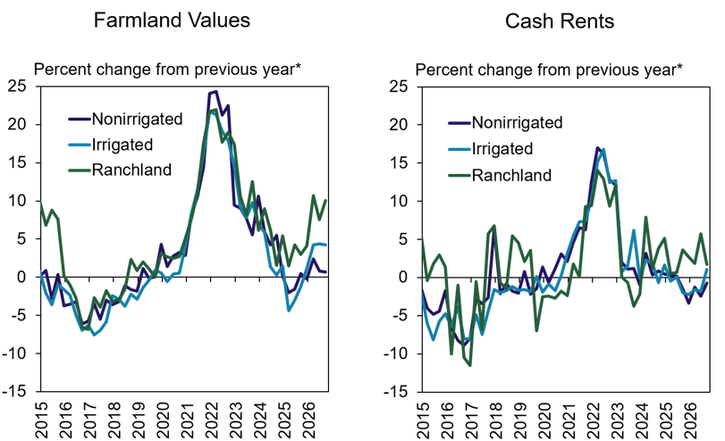
*Percent changes are calculated using responses only from those banks reporting in both the past and the current quarters.
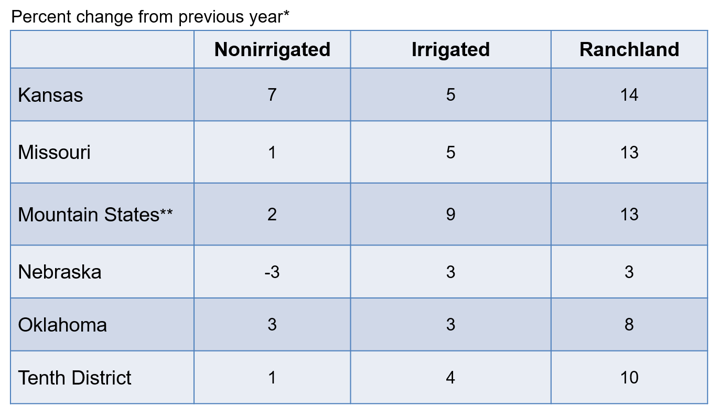
Developments in farmland values were similar across most states in the region. Ranchland values rose across all District states, particularly in Kansas, Missouri, and the Mountain States, where they increased nearly 15% from last year (Table 1). Only nonirrigated land values in Nebraska declined this quarter, while nonirrigated land values in Kansas climbed a robust 7%.
Table: Tenth District Farmland Values by State, Q3 2026
*Percent changes are calculated using responses only from those banks reporting in both the past and the current quarters.
**Mountain States include Colorado, northern New Mexico and Wyoming, which are grouped because of limited survey responses from each state.
Banker Comments Q3 2026
“The recent increase in commodity price has been nice to see but we are still unsure as to what yields will be with the drought we had in our area this year.” – Colorado
“…. input prices (chemicals and fertilizer) along with fuel are of concern for many of our customers.” – Kansas
“Input costs are a major concern for grain farmers.” – Kansas
“Government ad hoc disaster relief programs have helped my borrowers improve their liquidity situation...we were very dry and hot in July which had a big negative impact on dryland crops.” – Kansas
“More favorable cattle prices have helped the local economy; however, this summer has been very dry.” – Oklahoma
“……cow/calf producers have benefitted greatly from higher cattle prices. However, farmers that do not have any or minimal cow/calf operations are struggling.” – Oklahoma
“Fuel and fertilizer cost are major concerns for all farmers.” – Oklahoma
“The drought for 2026 has caused a diminished yield in spring and fall crops. Higher input prices with low commodity prices have negatively impacted margins.” – Oklahoma
“For the most part in our area, government payments received during 2026, crop insurance coverage, and the recent grain price rally...has us expecting very limited working capital issues at this time.” – Nebraska
“Farmers and ranchers should see record profits in 2026. Cattle feeders will be mixed.” – Nebraska
“The trucking industry is struggling with $6.00 diesel fuel and now the potential for increases in fertilizer prices for 2027 are making rural economies struggle.” – Nebraska
“During our annual farm reviews the majority of our farmers are very concerned about inflation and the increase in fuel prices directly tied to the ongoing Middle East conflict.” – Nebraska
“Increasing borrowing cost will impact the overall farm situation. Volatility will weigh on every related decision, if it wasn't already.” – Missouri
“Drought conditions and the price of inputs are the main variables this quarter.” – Wyoming
A total of 140 lenders responded to the Second Quarter Survey of Agricultural Credit Conditions in the Tenth Federal Reserve District—an area that includes Colorado, Kansas, Nebraska, Oklahoma, Wyoming, the northern half of New Mexico and the western third of Missouri. Please refer questions to Francisco Scott or Ty Kreitman at 1-800-333-1040.
The views expressed are those of the authors and do not necessarily reflect the positions of the Federal Reserve Bank of Kansas City or the Federal Reserve System.
Authors

Francisco Scott
Senior Economist