In the third quarter, new small business lending_ increased by 13.4% when compared to the same period in 2024, and outstanding loan balances increased slightly. Interest rates for new term loans and most new lines of credit continued to decrease.
With over $66 billion in small business loans reported, the 149 survey respondents reported that the long-term trend of tightening credit standards and declining credit quality continued. Both loan demand and application approval rates decreased for large banks, while both increased for small banks._ Over the next 12 months, respondents, on net, indicated the most likely factors to have an impact on loan demand are trade policy, interest rates, and inflation.
Chart 1: Outstanding Small Business (SB) Loans Increase
Skip to data visualization tableNote: Items are calculated using a subset of 111 respondents that completed the FR 2028D for the last five quarters surveyed. As of 2024:Q4, the instructions were updated for Call Report, Schedule RC-C Part I, item 4. Commercial and Industrial Loans.
Sources: Call Report, Schedule RC-C Part I, items 4. Commercial and Industrial Loans and 12. Total Loans and Leases Held for Investment and Held for Sale, and FR 2028D, items 5.b and 6.c.
| Quarter-Over-Quarter | Total Loans | C&I Loans | SB Loans |
|---|---|---|---|
| 2024:Q4 | 0.3 | -4.6 | 0.7 |
| 2025:Q1 | 0.2 | -0.5 | 0.6 |
| 2025:Q2 | 1.0 | -3.8 | 0.9 |
| 2025:Q3 | 1.6 | -0.1 | 0.2 |
| Year-Over-Year 2025:Q3 | 3.1 | -8.8 | 2.4 |
When compared to the third quarter of 2024, outstanding small business loans increased by 2.4% and total loans increased by 3.1%. The year-over-year increase in small business loans was primarily driven by increases at midsized banks. Quarter-over-quarter, small business loans increased by 0.2% and total loans increased by 1.6%.
Chart 2: New Small Business Loans Increase
Skip to data visualization tableNote: Items are calculated using a subset of 111 respondents that completed the FR 2028D for the last five quarters surveyed. All loan types referenced in Chart 2 refer to small business lending.
Source: FR 2028D, items 7.b and 8.c.
| Quarter-Over-Quarter | Total New SB Loans | New SB Term Loans | New SB Credit Lines |
|---|---|---|---|
| 2024:Q4 | 10.2 | 5.7 | 17.0 |
| 2025:Q1 | -7.9 | 1.8 | -20.9 |
| 2025:Q2 | 6.4 | 4.0 | 10.5 |
| 2025:Q3 | 5.0 | 2.8 | 8.6 |
| Year-Over-Year 2025:Q3 | 13.4 | 15.0 | 11.0 |
When compared to the third quarter of 2024, total new loan balances increased by 13.4%, with a 15% increase in new term loans and an 11% increase in new credit lines. Large and midsized banks reported an increase in new loans year-over-year, with midsized banks reporting the largest percentage increase at 41.5%. Quarter-over-quarter, total new loan balances increased by 5%, with a 2.8% increase in new term loans and an 8.6% increase in new credit lines.
Chart 3: Median Credit Line Usage Holds Steady Quarter-Over-Quarter
Skip to data visualization tableNote: Usage refers to the proportion of the outstanding balance relative to the total committed amount (i.e. credit used vs credit available).
Source: FR 2028D, items 6.b and 6.c.
| Quarter | Fixed | Variable | Total |
|---|---|---|---|
| 2020:Q4 | 48.03 | 35.46 | 36.44 |
| 2021:Q1 | 44.09 | 33.74 | 35.38 |
| 2021:Q2 | 49.63 | 32.00 | 35.67 |
| 2021:Q3 | 47.83 | 36.33 | 37.55 |
| 2021:Q4 | 46.48 | 35.68 | 36.76 |
| 2022:Q1 | 47.91 | 35.62 | 36.22 |
| 2022:Q2 | 47.92 | 36.83 | 37.56 |
| 2022:Q3 | 50.07 | 36.67 | 37.90 |
| 2022:Q4 | 49.57 | 35.15 | 36.29 |
| 2023:Q1 | 50.88 | 34.44 | 36.43 |
| 2023:Q2 | 51.06 | 34.55 | 38.00 |
| 2023:Q3 | 48.28 | 34.83 | 38.17 |
| 2023:Q4 | 50.13 | 36.54 | 37.79 |
| 2024:Q1 | 51.65 | 36.47 | 38.28 |
| 2024:Q2 | 52.06 | 38.05 | 39.63 |
| 2024:Q3 | 52.05 | 38.15 | 39.62 |
| 2024:Q4 | 48.08 | 37.28 | 40.60 |
| 2025:Q1 | 50.25 | 38.81 | 41.88 |
| 2025:Q2 | 53.49 | 38.32 | 40.95 |
| 2025:Q3 | 53.41 | 37.45 | 41.35 |
Quarter-over-quarter, median credit line usage was relatively stable. Median usage of fixed rate lines of credit was 53.4% compared to 37.5% of variable rate lines of credit.
Variable rate lines continue to constitute a larger portion of credit lines issued by banks, with respondents indicating they made up about 91% of total credit line usage.
Chart 4: Median Interest Rates Decrease Slightly for New Term Loans
Skip to data visualization tableNote: Items are calculated using a subset of 111 respondents that completed the FR 2028D for the last five quarters surveyed. Urban banks make up about 90% of the subset of respondents.
Source: FR 2028D, item 7.c.
| Quarter | Rural Fixed New Term Loans | Rural Variable New Term Loans | Urban Fixed New Term Loans | Urban Variable New Term Loans |
|---|---|---|---|---|
| 2024:Q3 | 8.08 | 7.94 | 7.66 | 8.54 |
| 2024:Q4 | 7.62 | 7.5 | 7.38 | 7.93 |
| 2025:Q1 | 7.84 | 7.89 | 7.42 | 7.91 |
| 2025:Q2 | 7.64 | 7.50 | 7.21 | 7.83 |
| 2025:Q3 | 7.43 | 7.42 | 7.10 | 7.76 |
Quarter-over-quarter, median interest rates on new term loans decreased slightly across all loan categories. Variable rates offered at urban banks remained the highest at 7.8%, while fixed rates at urban banks remained the lowest at 7.1%. The largest change was a 21-basis point decrease in fixed rates offered at rural banks._
Chart 5: Variable Rates on New Lines of Credit (LOC) Decrease
Skip to data visualization tableNote: Items are calculated using a subset of 111 respondents that completed the FR 2028D for the last five quarters surveyed. Urban banks make up about 90% of the subset of respondents.
Source: FR 2028D, item 8.d.
| Quarter | Rural Fixed New LOC | Rural Variable New LOC | Urban Fixed New LOC | Urban Variable New LOC |
|---|---|---|---|---|
| 2024:Q3 | 8.28 | 8.28 | 7.56 | 8.45 |
| 2024:Q4 | 7.05 | 7.61 | 7.5 | 8.02 |
| 2025:Q1 | 8.00 | 8.35 | 7.25 | 8.00 |
| 2025:Q2 | 7.16 | 7.76 | 7.25 | 8.07 |
| 2025:Q3 | 7.38 | 7.63 | 6.99 | 7.91 |
Median interest rates offered for new variable rate lines of credit at both urban and rural banks decreased in the third quarter of 2025. Variable rates offered at urban banks decreased to 7.9%, while rural rates decreased to 7.6%, in alignment with the declining rate environment. Fixed rates offered at urban banks decreased to 7%, while rural rates increased to 7.3%.
Chart 6: Interest Rate Floor Spreads Increase Slightly
Skip to data visualization tableNote: Spread refers to the distance between the weighted average nominal interest rate and the weighted average interest rate floor. As of 2025:Q3, there was a methodology change impacting the calculation of median spread for term loans and lines of credit.
Sources: FR 2028D, items 5.c, 5.h, 6.d, 6.g
| Quarter | Median Term Loan Spread | Median LOC Spread |
|---|---|---|
| 2024:Q3 | 256.5 | 343.2 |
| 2024:Q4 | 239.5 | 293.9 |
| 2025:Q1 | 238.0 | 288.3 |
| 2025:Q2 | 248.0 | 282.3 |
| 2025:Q3 | 253.5 | 286.2 |
Median interest rate floor spreads increased slightly quarter-over-quarter, with a 5-basis point increase in term loan spreads and a 4-basis point increase in line of credit spreads. Year-over-year, median line of credit spreads decreased 57-basis points while median term loan spreads remained relatively stable.
Chart 7: All Bank Sizes Report Increases in Credit Line Usage for the Eighth Consecutive Quarter
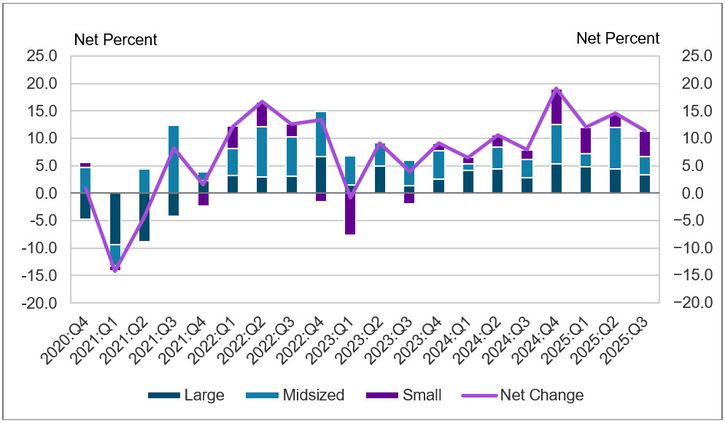
Note: Chart 7 shows diffusion indexes for credit line usage. The diffusion indexes show the difference between the percent of banks reporting decreased credit line usage and those reporting increased credit line usage. Net percent refers to the percent of banks that reported having increased usage (“increased somewhat” or “increased substantially”) minus the percent of banks that reported having decreased usage (“decreased somewhat” or “decreased substantially”).
Source: FR 2028D, items 9 and 10.
In the third quarter of 2025, 20% of respondents reported a change in credit line usage. About 11% of respondents, on net, indicated credit line usage increased, down from 15% last quarter.
On net, all bank sizes reported an increase in credit line usage for the eighth straight quarter. Of banks reporting an increase, 96% cited changes in borrower’s business revenue or other business specific conditions as a somewhat or very important reason.
Chart 8: Respondents Report Decreasing Loan Demand
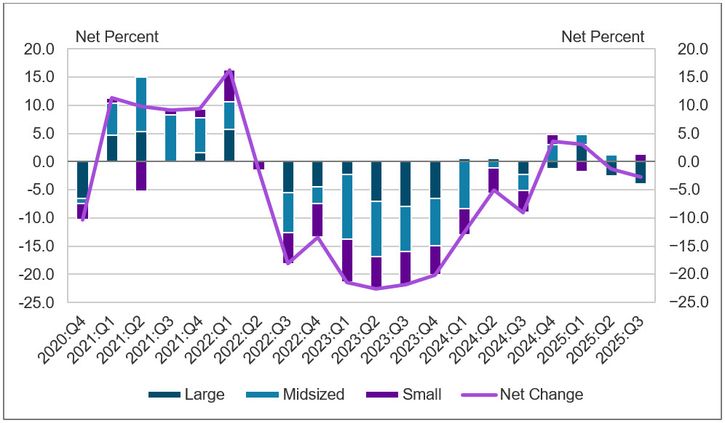
Note: Chart 8 shows diffusion indexes for loan demand. The diffusion indexes show the difference between the percent of banks reporting weakened loan demand and those reporting stronger loan demand. Net percent refers to the percent of banks that reported having stronger loan demand (“moderately stronger” or “substantially stronger”) minus the percent of banks that reported having weakened loan demand (“moderately weaker” or “substantially weaker”).
Source: FR 2028D, item 11.
About 28% of respondents reported a change in small business loan demand in the third quarter of 2025. On net, about 3% of respondents indicated weaker loan demand, driven by large banks. This is the second consecutive negative net response after reported growth in the fourth quarter of 2024 and the first quarter of 2025.
The reported weaker loan demand is consistent with the External LinkOctober 2025 Federal Reserve Senior Loan Officer Opinion Survey (SLOOS) where C&I loan demand was reported to have remained basically unchanged from small firms (annual sales of less than $50 million).
Chart 9: Overall Credit Quality Continues to Decline
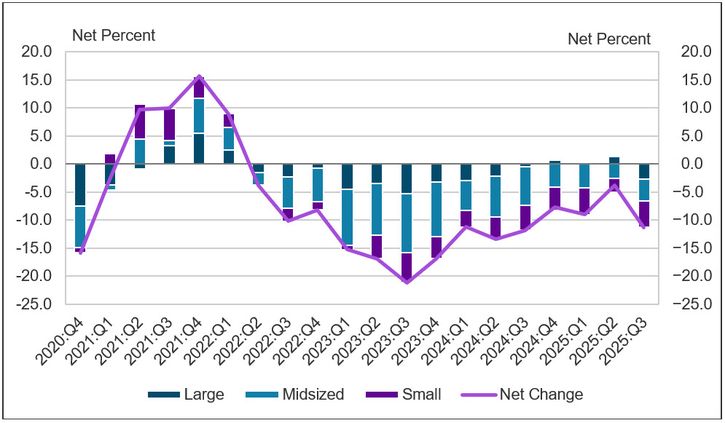
Note: Chart 9 shows diffusion indexes for credit quality of applicants. The diffusion indexes show the difference between the percent of banks reporting a decline in credit quality and those reporting improvement in credit quality. Net percent refers to the percent of banks that reported improving credit quality (“improved somewhat” or “improved substantially”) minus the percent of banks that reported declining credit quality (“declined somewhat” or “declined substantially”).
Source: FR 2028D, items 18 and 19.
About 11% of survey respondents, on net, reported a decrease in applicant credit quality. This is the 14th consecutive period in which respondents, on net, reported a decrease.
Of the respondents reporting a change in credit quality, whether an increase or decrease, 44% cited the debt-to-income level of business owners as a very important reason. Other commonly cited reasons include liquidity position of business owners and recent business income growth.
Chart 10: Interest Rates Expected to Positively Impact Small Business Loan Demand
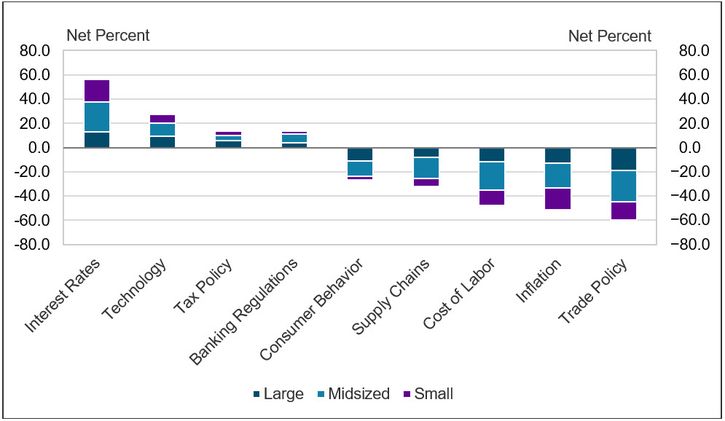
Source: FR 2028D, Special Question.
When asked to rate the impact several factors could have on small business lending over the next 12 months, respondents, on net, indicated that trade policy, interest rates, and inflation were the most likely factors to have an impact. Interest rates had the largest change in expected impact, with 52% of respondents, on net, expecting a positive impact this quarter compared to 17% last quarter.
As respondents continue to indicate interest rates, technology, tax policy, and banking regulations will have a positive impact on small business lending, 44% percent of small businesses expect to increase investment while 42% expect to increase staffing in the next year, according to the External LinkQ4 2025 Small Business Index.
Chart 11: Loan Approval Rates Increase for Midsized Banks While Large Banks Decrease
Skip to data visualization tableSource: FR 2028D, items 12.a and 13.
| Quarter | Small | Midsized | Large |
|---|---|---|---|
| 2020:Q4 | 90 | 80 | 46 |
| 2021:Q1 | 90 | 88 | 51 |
| 2021:Q2 | 94 | 90 | 47 |
| 2021:Q3 | 71 | 85 | 50 |
| 2021:Q4 | 81 | 87 | 51 |
| 2022:Q1 | 83 | 77 | 51 |
| 2022:Q2 | 83 | 80 | 52 |
| 2022:Q3 | 87 | 87 | 48 |
| 2022:Q4 | 86 | 69 | 48 |
| 2023:Q1 | 87 | 68 | 50 |
| 2023:Q2 | 84 | 67 | 48 |
| 2023:Q3 | 88 | 68 | 52 |
| 2023:Q4 | 89 | 66 | 49 |
| 2024:Q1 | 93 | 73 | 49 |
| 2024:Q2 | 85 | 71 | 46 |
| 2024:Q3 | 92 | 70 | 45 |
| 2024:Q4 | 90 | 69 | 44 |
| 2025:Q1 | 87 | 76 | 45 |
| 2025:Q2 | 86 | 76 | 45 |
| 2025:Q3 | 88 | 82 | 41 |
Application approval rates increased by 8% for midsized banks, while large banks decreased by 9% quarter-over-quarter. About 71% of respondents indicated borrower financials as the most common reason for denying a loan. Other commonly cited reasons were credit history and collateral.
Chart 12: Respondents Report Tightening Credit Standards for the Sixteenth Consecutive Quarter
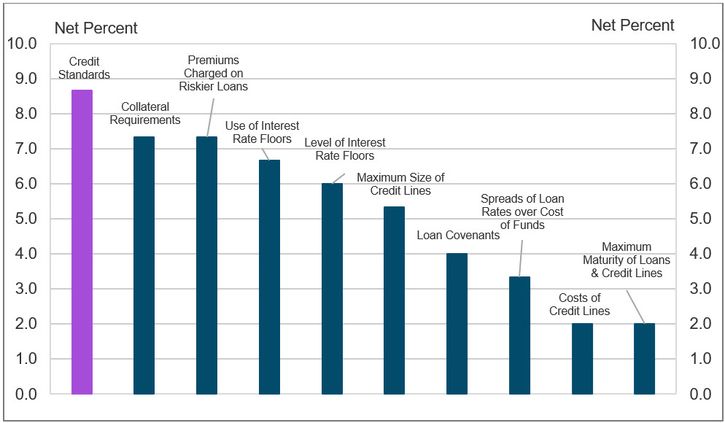
Note: Chart 12 shows diffusion indexes for credit standards (purple bar) and various loan terms. The diffusion indexes show the difference between the percent of banks reporting tightening terms and those reporting easing terms. Net percent refers to the percent of banks that reported having tightened (“tightened somewhat” or “tightened considerably”) minus the percent of banks that reported having eased (“eased somewhat” or “eased considerably”).
Source: FR 2028D, items 14, 15, 16 and 17.
About 9% of respondents, on net, reported tightening credit standards (purple bar) in the third quarter of 2025. This continues the long-term trend of tightening credit standards and is consistent with the tightening credit standards reported in the External LinkOctober 2025 Federal Reserve Senior Loan Officer Opinion Survey (SLOOS).
On net, respondents indicated that all loan terms tightened. About 83% of respondents cited less favorable or more uncertain economic outlook as a somewhat important or very important reason for tightening. Other commonly cited reasons were worsening of industry-specific problems and reduced tolerance for risk.
Other contributors to the release include Lauren Bennett, Sophie Burge, Nicholas Courtney, Maurice Freese, Stefan Jacewitz, Connor Jamison, Josie Kennedy, and Jordan Pandolfo.
Endnotes
-
1 Small business lending refers to commercial and industrial lending to organizations generally defined as having less than $5 million in gross annual revenue, unless otherwise noted.
-
2 Small banks have total assets of $1 billion or less, midsized banks have total assets between $1 billion and $10 billion and large banks have total assets greater than $10 billion.
-
3 Urban and rural classification is determined exclusively by the bank’s head office location and External LinkUS Census Population data.
The views expressed are those of the authors and do not necessarily reflect the positions of the Federal Reserve Bank of Kansas City or the Federal Reserve System.
Authors

Daniel Harbour
Assistant Vice President