In the third quarter, new small business lending_ increased by 1.8 percent when compared to the same period in 2023 and 6.9 percent when compared to the previous quarter. Outstanding loan balances increased by 1.3 percent when compared to the same period in 2023 but decreased slightly by 0.6 percent when compared to the previous quarter. Interest rates on new term loans and variable rate lines of credit decreased.
With over $69 billion in small business loans reported, the 177 survey respondents reported credit standards tightened for the twelfth consecutive quarter and credit quality declined for the tenth consecutive quarter. Loan demand decreased for the tenth consecutive quarter, though loan application approval rates increased among small banks._
Chart 1: Outstanding Small Business (SB) Loans Increase Year-over-Year
Skip to data visualization tableNote: Items are calculated using a subset of 122 respondents that completed the FR 2028D for the last five quarters surveyed.
Sources: Call Report, Schedule RC-C Part I, items 4. Commercial and Industrial Loans and 12. Total Loans and Leases Held for Investment and Held for Sale, and FR 2028D, items 5.b and 6.c.
| Quarter-Over-Quarter | Total Loans | C&I Loans | SB Loans |
|---|---|---|---|
| 2023:Q4 | -0.4 | -1.2 | 0.9 |
| 2024:Q1 | -0.8 | -0.1 | 0.6 |
| 2024:Q2 | 0.4 | -0.5 | 0.4 |
| 2024:Q3 | -0.2 | -0.9 | -0.6 |
| Year-Over-Year 2024:Q3 | -1.0 | -2.6 | 1.3 |
When compared to third quarter 2023, small business loan balances increased by 1.3 percent, C&I loans decreased by 2.6 percent, and total loans decreased by 1.0 percent. The year-over-year increase in small business loans was driven by large and midsized banks, while small banks reported decreases. Quarter-over-quarter, all loan categories decreased slightly.
Chart 2: New Small Business Lending Increases
Skip to data visualization tableNote: Items are calculated using a subset of 122 respondents that completed the FR 2028D for the last five quarters surveyed. All loan types referenced in Chart 2 refer to small business lending.
Source: FR 2028D, items 7.b and 8.c.
| Quarter-Over-Quarter | Total New SB Loans | New SB Term Loans | New SB Credit Lines |
|---|---|---|---|
| 2023:Q4 | 8.6 | 11.6 | 3.9 |
| 2024:Q1 | -10.8 | -12.2 | -8.5 |
| 2024:Q2 | -1.7 | -0.2 | -4.1 |
| 2024:Q3 | 6.9 | 1.3 | 16.5 |
| Year-Over-Year 2024:Q3 | 1.8 | -1.0 | 6.2 |
Quarter-over-quarter, total new small business loan balances increased by 6.9 percent, including a 16.5 percent increase in new credit lines and a 1.3 percent increase in new term loans. Year-over-year, total new loans increased by 1.8 percent, driven by a 6.2 percent increase in new credit lines and partially offset by a 1.0 percent decrease in new term loans. The overall growth in new loans was comprised of increases at both large and small banks, while midsized banks reported decreases.
Chart 3: Total Credit Line Usage Decreases for the First Time in Five Quarters
Skip to data visualization tableSource: FR 2028D, items 6.b and 6.c.
| Quarter | Total | Fixed Rate | Variable Rate |
|---|---|---|---|
| 2019:Q4 | 39.73 | 37.15 | 40.04 |
| 2020:Q1 | 39.98 | 36.42 | 40.34 |
| 2020:Q2 | 35.26 | 37.69 | 34.99 |
| 2020:Q3 | 33.46 | 40.64 | 32.66 |
| 2020:Q4 | 32.20 | 40.72 | 31.33 |
| 2021:Q1 | 30.83 | 38.20 | 30.16 |
| 2021:Q2 | 30.77 | 39.17 | 29.97 |
| 2021:Q3 | 32.00 | 44.04 | 30.94 |
| 2021:Q4 | 31.56 | 41.86 | 30.71 |
| 2022:Q1 | 31.79 | 41.35 | 31.00 |
| 2022:Q2 | 32.08 | 36.64 | 31.63 |
| 2022:Q3 | 31.70 | 37.28 | 31.11 |
| 2022:Q4 | 32.49 | 39.80 | 31.63 |
| 2023:Q1 | 32.37 | 40.43 | 31.54 |
| 2023:Q2 | 32.86 | 47.29 | 31.64 |
| 2023:Q3 | 33.49 | 49.57 | 32.10 |
| 2023:Q4 | 34.04 | 54.40 | 32.47 |
| 2024:Q1 | 34.32 | 51.90 | 32.81 |
| 2024:Q2 | 34.69 | 54.34 | 32.99 |
| 2024:Q3 | 32.42 | 45.74 | 31.28 |
Usage of total small business credit lines decreased slightly, ending an upward trend in usage that lasted for five straight quarters. Although small businesses are utilizing 46 percent of fixed rate lines of credit compared to 32 percent of variable rate lines of credit, variable rate lines make up a larger portion of credit lines issued by banks. Respondents indicated that variable rate lines make up about 89 percent of total credit line usage.
Chart 4: Interest Rates Decrease for New Term Loans
Skip to data visualization tableNote: Items are calculated using a subset of 122 respondents that completed the FR 2028D for the last five quarters surveyed. Urban banks make up about 89 percent of the subset of respondents.
Source: FR 2028D, item 7.c.
| Quarter | Rural Fixed New Term Loans | Rural Variable New Term Loans | Urban Fixed New Term Loans | Urban Variable New Term Loans |
|---|---|---|---|---|
| 2023:Q3 | 8.02 | 7.81 | 7.68 | 8.99 |
| 2023:Q4 | 8.02 | 8.22 | 7.99 | 8.93 |
| 2024:Q1 | 8.37 | 8.21 | 7.91 | 8.75 |
| 2024:Q2 | 8.18 | 8.51 | 7.86 | 8.82 |
| 2024:Q3 | 8.08 | 8.10 | 7.75 | 8.50 |
Median interest rates decreased for all new term loans in third quarter 2024. Variable rates offered at urban banks remained the highest, while the lowest continued to be fixed rates offered at urban banks. The largest change was a 41-basis point decrease in variable rates offered at rural banks._
Chart 5: Variable Rates on New Lines of Credit (LOC) Decrease
Skip to data visualization tableNote: Items are calculated using a subset of 122 respondents that completed the FR 2028D for the last five quarters surveyed. Urban banks make up about 89 percent of the subset of respondents.
Source: FR 2028D, item 8.d.
| Quarter | Rural Fixed New LOC | Rural Variable New LOC | Urban Fixed New LOC | Urban Variable New LOC |
|---|---|---|---|---|
| 2023:Q3 | 8.68 | 9.20 | 7.43 | 9.07 |
| 2023:Q4 | 8.29 | 8.64 | 7.67 | 9.13 |
| 2024:Q1 | 8.59 | 8.91 | 7.59 | 9.33 |
| 2024:Q2 | 8.13 | 8.82 | 7.65 | 9.09 |
| 2024:Q3 | 8.40 | 8.35 | 7.44 | 8.57 |
Median interest rates offered for new variable rate lines of credit at both urban and rural banks decreased in third quarter 2024. Variable rates offered at urban banks decreased to 8.6 percent, while rural rates decreased to 8.3 percent, in alignment with the declining rate environment. Fixed rates offered at urban banks decreased to 7.4 percent, while rural rates increased to 8.4 percent.
Chart 6: Interest Rate Floor Spreads Decrease for Term Loans and Lines of Credit
Skip to data visualization tableNote: Spread refers to the distance between the weighted average nominal interest rate and the weighted average interest rate floor.
Sources: FR 2028D, items 5.c, 5.h, 6.d, 6.g
| Quarter | Median Term Loan Spread | Median LOC Spread |
|---|---|---|
| 2023:Q3 | 299 | 451 |
| 2023:Q4 | 282 | 445 |
| 2024:Q1 | 265 | 417 |
| 2024:Q2 | 291 | 388 |
| 2024:Q3 | 279 | 360 |
Interest rate floor spreads decreased on outstanding term loans and on lines of credit in third quarter 2024. The median spread on term loans decreased to 279-basis points, a 13-basis point decrease. The median spread on lines of credit decreased to 360-basis points, a 28-basis point decrease.
Chart 7: Proportion of Banks Reporting an Increase in Credit Line Usage Declines
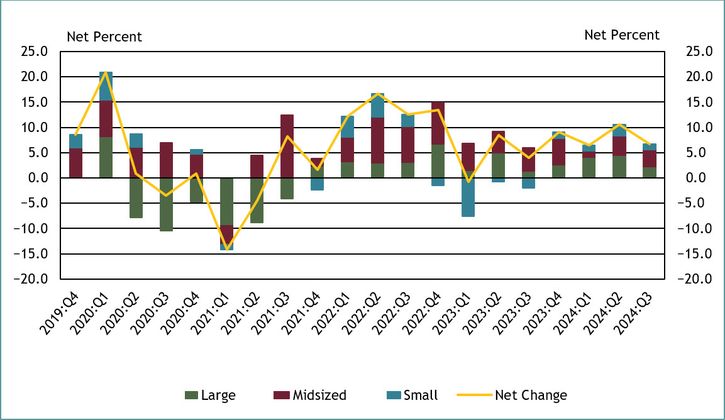
Note: Chart 7 shows diffusion indexes for credit line usage. The diffusion indexes show the difference between the percent of banks reporting decreased credit line usage and those reporting increased credit line usage. Net percent refers to the percent of banks that reported having decreased (“decreased somewhat” or “decreased substantially”) minus the percent of banks that reported having increased (“increased somewhat” or “increased substantially”).
Source: FR 2028D, items 9 and 10.
In third quarter 2024, 24 percent of respondents reported a change in credit line usage. About 7 percent of respondents, on net, indicated that credit line usage increased, down from 11 percent last quarter.
On net, all bank sizes reported an increase in credit line usage for the fourth straight quarter. Of the banks reporting an increase, about 44 percent cited changes in borrowers’ business revenue or other business-specific conditions and changes in local or national economic conditions as very important reasons.
The reported increase in credit line usage is consistent with a shift to increased debt financing observed in other key indicators such as elevated consumer credit card debt._ Total household credit card debt continues to increase each quarter._
Chart 8: Respondents Report Declines in Loan Demand for the Tenth Consecutive Quarter
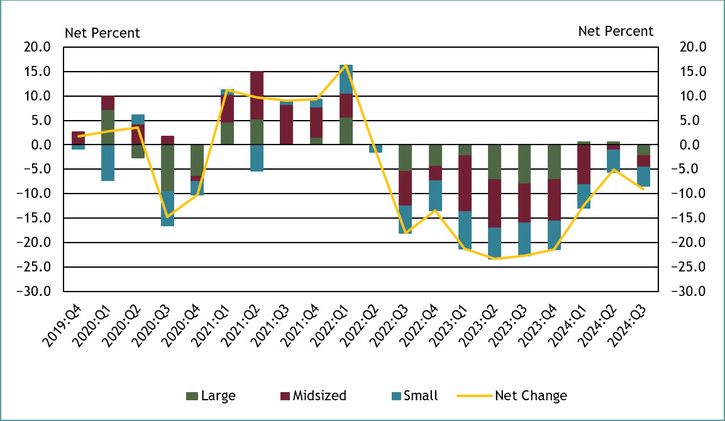
Note: Chart 8 shows diffusion indexes for loan demand. The diffusion indexes show the difference between the percent of banks reporting weakened loan demand and those reporting stronger loan demand. Net percent refers to the percent of banks that reported having weakened (“moderately weaker” or “substantially weaker”) minus the percent of banks that reported having stronger loan demand (“moderately stronger” or “substantially stronger”).
Source: FR 2028D, item 11.
About 33 percent of respondents reported a change in small business loan demand in third quarter 2024. On net, about 9 percent of respondents indicated weaker loan demand across all bank sizes. This marks the tenth consecutive quarter of respondents reporting a net decline in loan demand.
The reported softer loan demand is consistent with the External LinkOctober 2024 Federal Reserve Senior Loan Officer Opinion Survey (SLOOS), where about 34 percent of respondents reported weaker C&I loan demand from small firms (annual sales of less than $50 million) over the prior three months.
Chart 9: Banks Indicating Constrained Lending Decreases
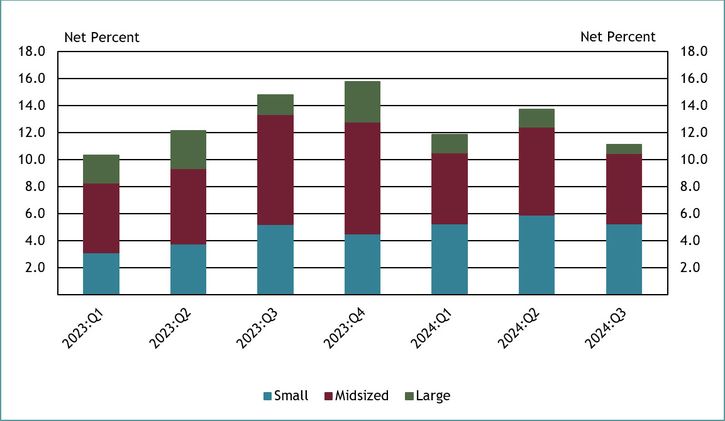
Source: FR 2028D, Special Question.
About 11 percent of all respondents indicated their lending to small businesses was constrained by the availability of liquidity in the market. This is a decrease of about 4 percent from third quarter 2023 and 3 percent from the previous quarter. Most respondents reporting a constraint were small and midsized banks. For the seventh consecutive quarter, all respondents who indicated lending was constrained cited greater competitive pressures for deposits.
Chart 10: Overall Credit Quality Declines for the Tenth Consecutive Quarter
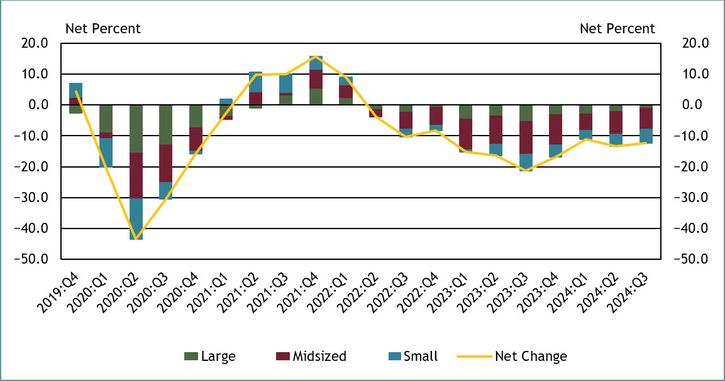
Note: Chart 10 shows diffusion indexes for credit quality of applicants. The diffusion indexes show the difference between the percent of banks reporting a decline in credit quality and those reporting improvement in credit quality. Net percent refers to the percent of banks that reported declining credit quality (“declined somewhat” or “declined substantially”) minus the percent of banks that reported improving credit quality (“improved somewhat” or “improved substantially”).
Source: FR 2028D, items 18 and 19.
About 12 percent of survey respondents, on net, reported a decrease in applicant credit quality. This is the tenth consecutive period in which respondents of all bank sizes, on net, reported a decrease. Of the respondents reporting a change in credit quality, whether an increase or decrease, 53 percent cited the debt-to-income level of business owners as a very important reason for a change. Other commonly cited reasons for a change include liquidity position of business owners, credit scores, and personal wealth of business owners.
The decrease in applicant credit quality reported by firms is consistent with the negative outlook of loan availability reported by small businesses in the External LinkOctober 2024 NFIB Survey of Loan Availability. In addition, declining credit quality for small businesses stands in contrast to measures of credit quality for large businesses. Corporate bond spreads_ are currently near a decades low, which could suggest that small businesses may be under more strain when compared to their large counterparts.
Chart 11: Loan Approval Rates Increase for Small Bank
Skip to data visualization tableSource: FR 2028D, items 12.a and 13.
| Quarter | Small | Midsized | Large |
|---|---|---|---|
| 2019:Q4 | 87 | 76 | 54 |
| 2020:Q1 | 87 | 75 | 52 |
| 2020:Q2 | 88 | 95 | 75 |
| 2020:Q3 | 87 | 90 | 38 |
| 2020:Q4 | 90 | 80 | 46 |
| 2021:Q1 | 90 | 88 | 51 |
| 2021:Q2 | 94 | 90 | 47 |
| 2021:Q3 | 71 | 85 | 50 |
| 2021:Q4 | 81 | 87 | 51 |
| 2022:Q1 | 83 | 77 | 51 |
| 2022:Q2 | 83 | 80 | 52 |
| 2022:Q3 | 87 | 87 | 48 |
| 2022:Q4 | 86 | 69 | 48 |
| 2023:Q1 | 87 | 68 | 50 |
| 2023:Q2 | 84 | 67 | 48 |
| 2023:Q3 | 88 | 68 | 52 |
| 2023:Q4 | 89 | 66 | 49 |
| 2024:Q1 | 93 | 73 | 49 |
| 2024:Q2 | 85 | 71 | 46 |
| 2024:Q3 | 92 | 70 | 45 |
Application approval rates increased by 7 percent for small banks, but slightly decreased for midsized and large banks in third quarter 2024. About 68 percent of respondents indicated borrower financials as the most common reason for denying a loan. Other commonly cited reasons were borrower credit history and collateral.
Chart 12: Respondents Report Tightening Credit Standards for the Twelfth Consecutive Quarter
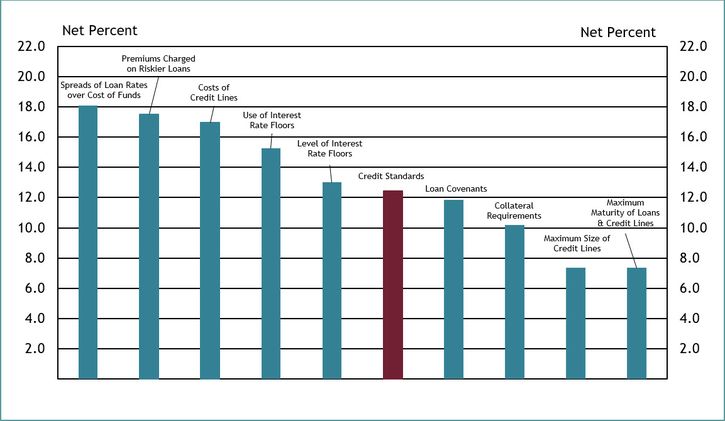
Note: Chart 12 shows diffusion indexes for credit standards (red bar) and various loan terms. The diffusion indexes show the difference between the percent of banks reporting tightening terms and those reporting easing terms. Net percent refers to the percent of banks that reported having tightened (“tightened somewhat” or “tightened considerably”) minus the percent of banks that reported having eased (“eased somewhat” or “eased considerably”).
Source: FR 2028D, items 14, 15, 16 and 17.
About 12 percent of respondents, on net, reported tightening credit standards (red bar) in third quarter 2024. This is the twelfth consecutive quarter that respondents have reported tightening credit standards and is consistent with the tightening credit standards reported in theExternal Link October 2024 Federal Reserve Senior Loan Officer Opinion Survey (SLOOS).
On net, respondents indicated that all loan terms tightened. About 86 percent of respondents cited less favorable or more uncertain economic outlook as a somewhat important or very important reason for the tightening. Other commonly cited reasons were worsening of industry-specific problems and reduced tolerance for risk.
Other contributors to the release include Alli Baranski, Lauren Bennett, Sophie Burge, Nicholas Courtney, and Jordan Pandolfo.
Endnotes
-
1 Small business lending refers to commercial and industrial lending to organizations generally defined as having less than $5 million in gross annual revenue, unless otherwise noted.
-
2 Small banks have total assets of $1 billion or less, midsized banks have total assets between $1 billion and $10 billion and large banks have total assets greater than $10 billion.
-
3 Urban and rural classification is determined exclusively by the bank’s head office location and External LinkUS Census Population data.
-
4 Source: FRED, Consumer Loans: Credit Cards and Other Revolving Plans
-
5 Source: FRBNY Consumer Credit Panel/Equifax
-
6 Source: FRED, ICE BofA US High Yield Index Option-Adjusted Spread.
The views expressed are those of the authors and do not necessarily reflect the positions of the Federal Reserve Bank of Kansas City or the Federal Reserve System.
Author