U. S. small business commercial and industrial (C&I) lending increased in the third quarter of 2018 with growth driven by large institutions. Most of the 122 respondents to the Federal Reserve’s Small Business Lending Survey (FR 2028D) indicated conditions for small business lending remained stable in the third quarter. Credit standards remained relatively unchanged with respondents indicating a tightening of lending terms. Interest rates on new small business C&I term loans and lines of credit continued to rise.
Chart 1: Small Business C&I Loan Balances Increase For Second Consecutive Quarter
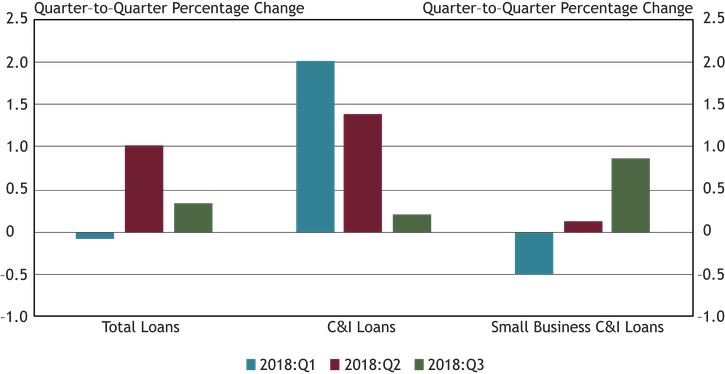
Sources: Call Report, schedule RC-C, items 4 and 12; and FR 2028D, items 4.b and 5.c. Note: Items are calculated using a subset of respondents that completed the FR 2028D for both the previous and current quarters of each period.
Total outstanding loan balances increased for the second consecutive quarter. Growth in C&I loan balances slowed but still increased for the third consecutive quarter. After a small increase in the second quarter, small business C&I loans grew almost 0.9 percent in the third quarter, outpacing the growth of total loans and C&I loans.
Chart 2: Large Institutions Drive Growth in Outstanding Small Business C&I Loans
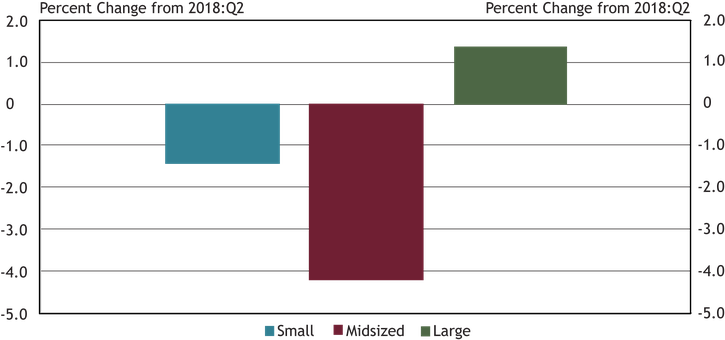
Source: FR 2028D, items 4.b and 5.c. Note: Small banks have total assets of $1 billion or less, midsized banks have assets between $1 billion and $10 billion and large banks have assets greater than $10 billion.
Large institutions drove the growth of outstanding small business C&I loans in the third quarter, reporting growth of 1.4 percent. Due to greater loan balances at large banks, this change more than offset declines at small and midsized banks of 1.5 percent and 4.2 percent, respectively.
Chart 3: New Small Business C&I Credit Lines Drive Increase in New Loan Originations
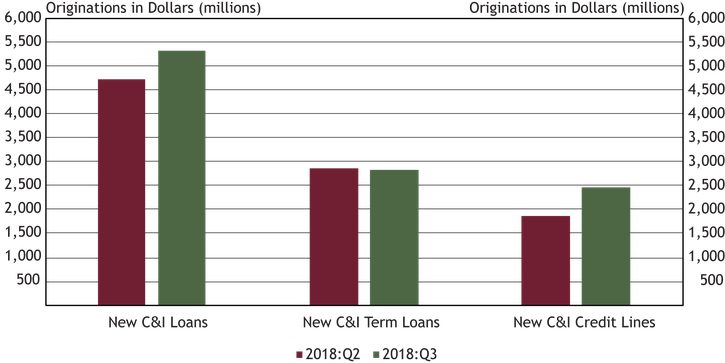
Source: FR 2028D, items 7.b and 10.c. Note: Items are calculated using a subset of respondents that completed the FR 2028D for both the second and third quarters of 2018.
The overall dollar volume of new small business C&I loans increased 12.7 percent from the second quarter. Originations of C&I term loans remained relatively unchanged while new C&I credit lines saw a significant increase of 32.6 percent. The overall increase in new C&I lending was consistent with the increase in small business C&I loans this quarter (Chart 1).
Chart 4: Small Business C&I Fixed Rate Credit Line Usage Increases
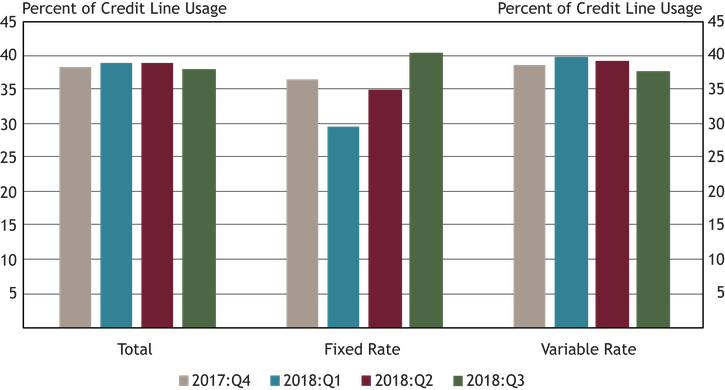
Source: FR 2028D, items 5.b and 5.c. Note: Calculation uses a subsample of the data collected for sample consistency.
Fixed rate credit line usage grew for the second consecutive quarter, increasing to 40.4 percent. Total credit line usage remained relatively stable, although variable rate credit line usage declined for the second consecutive quarter, reaching a four-quarter low of 37.8 percent.
Chart 5: Interest Rates on New Small Business C&I Loans Continue to Rise
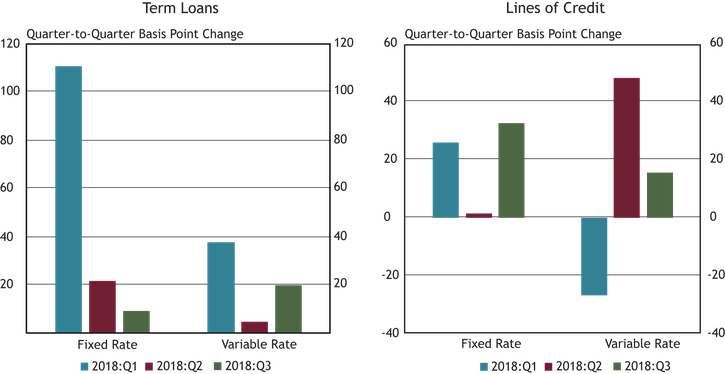
Source: FR 2028D, items 7.c and 10.d. Note: Items are calculated using a subset of respondents that completed the FR 2028D for both the previous and current quarters of each period.
Weighted average interest rates on term loans grew for the third consecutive quarter. Rates on fixed rate term loans grew more slowly in the third quarter but increased 9 basis points to 6.35 percent. Variable rate term loans increased 20 basis points to 5.25 percent. Fixed rate lines of credit increased 33 basis points to 5.77 percent while variable rate lines of credit increased 16 basis points to 5.86 percent.
Chart 6: New Small Business C&I Loan Rates Vary by Bank Size
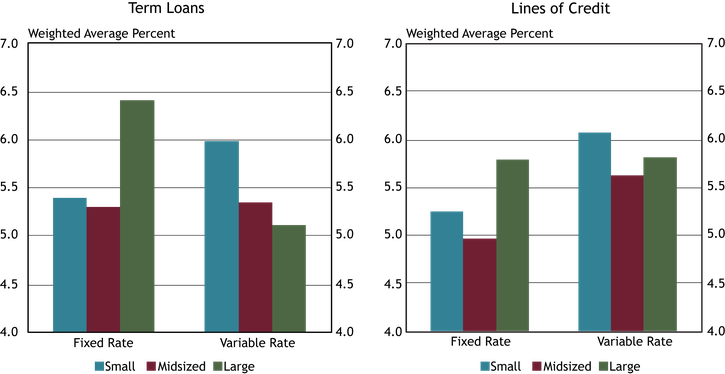
Source: FR 2028D, items 7.c and 10.d. Note: Average interest rates are weighted by the dollar volume of new small business C&I loans. Small banks have total assets of $1 billion or less, midsized banks have total assets between $1 billion and $10 billion and large banks have total assets greater than $10 billion.
Third quarter weighted average interest rates continued to vary on term loans and lines of credit across bank sizes, ranging from 4.96 percent to 6.42 percent. Small and midsized banks offered lower rates on fixed rate term loans than large banks, while large banks offered the lowest rates for variable rate term loans. Midsized banks charged the lowest rates on lines of credit with fixed and variable rates. Meanwhile, large banks charged the highest rates on lines of credit with fixed rates and small banks charged the highest rates on lines of credit with variable rates.
Chart 7: Credit Line Usage Remains Stable Across All Bank Sizes
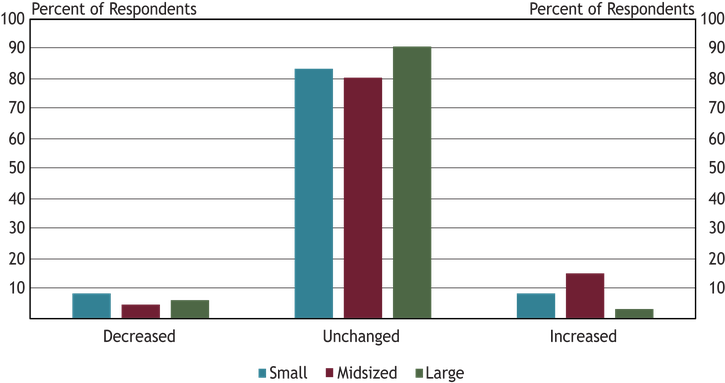
Source: FR 2028D, item 11. Note: Small banks have total assets of $1 billion or less, midsized banks have total assets between $1 billion and $10 billion and large banks have total assets greater than $10 billion.
About 84 percent of respondents reported that small business C&I credit line usage was unchanged during the third quarter. The percentage of small, midsized and large banks that reported no change increased across all size categories compared with the second quarter. Similar to previous quarters, the most common reasons cited for a change, whether an increase or decrease, were changes in borrowers’ business revenue or other business-specific conditions, and differences in local or national economic conditions.
Chart 8: Overall Loan Demand Remains Stable
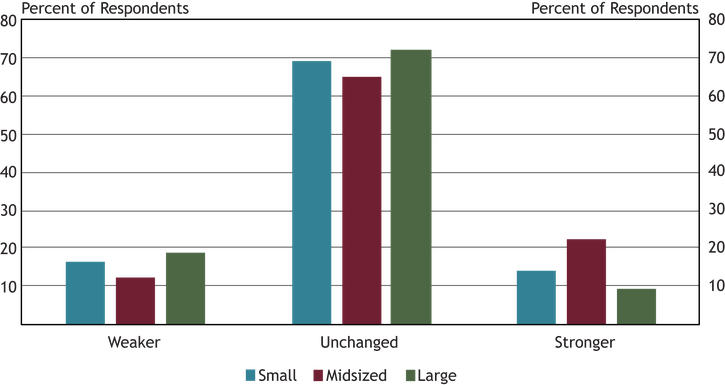
Source: FR 2028D, item 13. Note: Small banks have total assets of $1 billion or less, midsized banks have total assets between $1 billion and $10 billion and large banks have total assets greater than $10 billion.
Overall, about 69 percent of respondents indicated no change in demand for small business C&I loans during the third quarter, unchanged from the second quarter. Among the 31 percent reporting a change, there was an equal split between stronger and weaker demand. However, compared with the second quarter, the number of institutions reporting weaker demand increased about 10 percent.
Chart 9: Small Business C&I Application Approval Rates Increase for Large and Midsized Banks
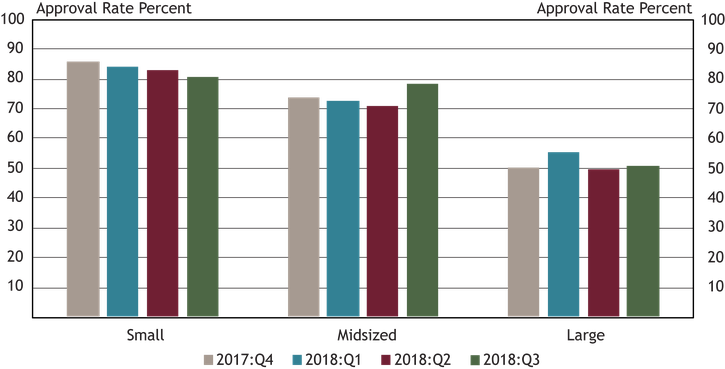
Source: FR 2028D, items 14.a and 17. Note: Small banks have total assets of $1 billion or less, midsized banks have total assets between $1 billion and $10 billion and large banks have total assets greater than $10 billion.
Application approval rates varied from 81 percent at small institutions to 51 percent at large institutions during third quarter. Compared with the second quarter, approval rates were higher for large and midsized banks, but lower for small banks._ The most cited reason for denying a loan was borrower financials, while some respondents cited credit history.
Chart 10: Small Business Credit Quality Remains Stable
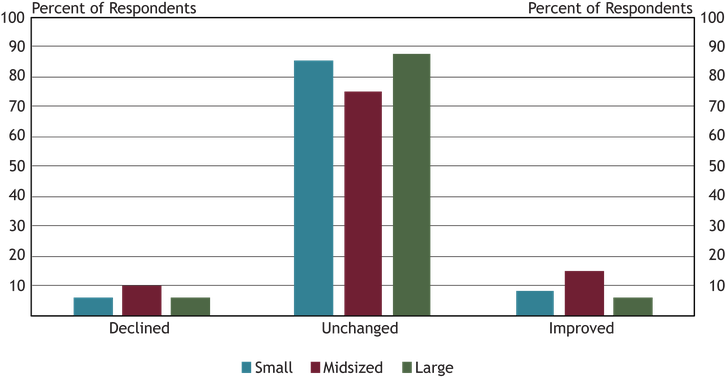
Source: FR 2028D, items 24 and 25. Note: Small banks have total assets of $1 billion or less, midsized banks have assets between $1 billion and $10 billion and large banks have assets greater than $10 billion.
About 83 percent of respondents indicated credit quality remained unchanged in the third quarter. Of those respondents reporting a change in credit quality, a majority reported an improvement. About 52 percent of respondents who reported some change in credit quality cited the debt-to-income level of business owners as a very important cause. Other causes cited as very important were the liquidity position of business owners and recent business income growth.
Chart 11: Banks Tighten Most Credit Terms
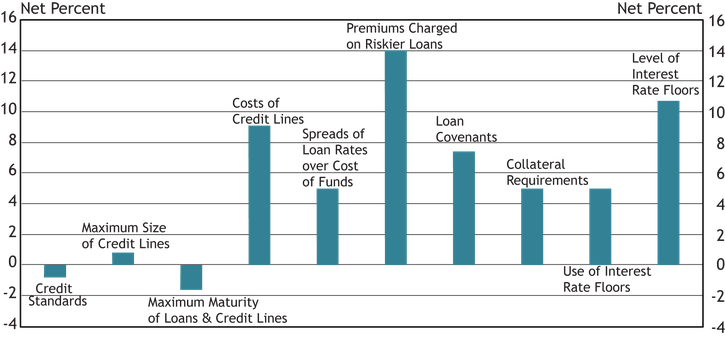
Source: FR 2028D, items 18 and 19. Note: The net percent refers to the percent of banks that reported having tightened (“tightened considerably” or “tightened somewhat”) minus the percent of banks that reported having eased (“eased considerably” or “eased somewhat”).
Chart 11 shows diffusion indexes for credit standards (left-most bar) and various loan terms. The diffusion indexes show the difference between the percent of banks reporting tightening terms and those reporting easing terms. While almost all banks reported no change in credit standards, on net, banks reported tighter credit terms. The number of respondents reporting no change in credit standards increased to about 91 percent from about 50 percent in the second quarter.
Banks on net tightened all loan terms except maximum maturity of loans and credit lines. Premiums charged on riskier loans, the level of interest rate floors and costs of credit lines showed the most tightening. More than 70 percent of the respondents who reported tightening indicated that a less favorable or more uncertain economic outlook, a reduced tolerance for risk, and industry specific problems as important factors in that decision. Additionally, 53 percent of respondents pointed to increased concerns about the effects of legislative changes, supervisory actions, or changes in accounting standards as an important factor. About 77 percent of respondents who indicated easing credit standards or terms reported more aggressive competition from other banks as an important factor in that decision, and 63 percent of respondents cited more aggressive competition from nonbank lenders as important.
*Other contributors to this report include John Froud, Dan Harbour, Alli Jakubek, Brody Smith, Tony Walker, Brad Wampler, and Jim Wilkinson.
Contact Us
For questions or comments about this survey, contact us at KC SRM FR2028D Survey.
Endnotes
-
1 Approval rates in Chart 9 are not consistent with application approval rates in Chart 9 of the Oct. 1, 2018, second-quarter release, due to an error in the second-quarter chart.
The views expressed are those of the authors and do not necessarily reflect the positions of the Federal Reserve Bank of Kansas City or the Federal Reserve System.