Summary of Quarterly Indicators
Tenth District energy activity expanded moderately in the first quarter of 2021 and moved higher than year ago levels, as indicated by firms contacted between March 15th and March 31st, 2021 (Tables 1 & 2). The drilling and business activity index eased only slightly from 40 to 34 (Chart 1). Total revenues, profits, employment, employee hours, access to credit, and wages and benefits indexes increased from the previous month.
Chart 1
Drilling/Business Activity Index vs. a Quarter Ago
Skip to data visualization table| Date | Drilling/Business Activity Index vs. a Quarter Ago |
|---|---|
| Q1 17 | 55 |
| Q2 17 | 43 |
| Q3 17 | 7 |
| Q4 17 | 13 |
| Q1 18 | 37 |
| Q2 18 | 26 |
| Q3 18 | 45 |
| Q4 18 | -13 |
| Q1 19 | 0 |
| Q2 19 | 7 |
| Q3 19 | -23 |
| Q4 19 | -48 |
| Q1 20 | -81 |
| Q2 20 | -61 |
| Q3 20 | 4 |
| Q4 20 | 40 |
| Q1 21 | 34 |
Year-over-year indexes moved into positive territory for the first time since early 2019. The year-over-year drilling and business activity index moved from -60 to 10. Indexes for revenues, capital spending, and profits were higher than year-ago levels. On the other hand, the indexes for employment and access to credit continued to decline.
Expectations indexes increased in Q1 2021. The future drilling and business activity index was 40, up from 26 in Q4 and 0 in Q3 2020, indicating more firms expected energy activity to expand. The capital expenditures and employment indexes rose substantially, and expectations for revenues, profits, and access to credit also expanded. Price expectations for oil, natural gas, and natural gas liquids expanded at a slower pace, but still remained at high levels.
Summary of Special Questions
This quarter firms were asked what oil and natural gas prices were needed for drilling to remain profitable on average across the fields in which they are active (in alternate quarters they are asked what prices are needed for a substantial increase in drilling to occur). The average oil price needed was $53 per barrel, with a range of $35 to $80 (Chart 2). This average was higher than prices needed to remain profitable in Q3 2020, but still lower than prices for the past several years. The average natural gas price needed was $2.94 per million Btu, with responses ranging from $0.75 to $5.00.
Chart 2: Special Question - What price is currently needed for drilling to be profitable for oil and natural gas, and what do you expect the WTI and Henry Hub prices to be in six months, one year, two years, and five years?
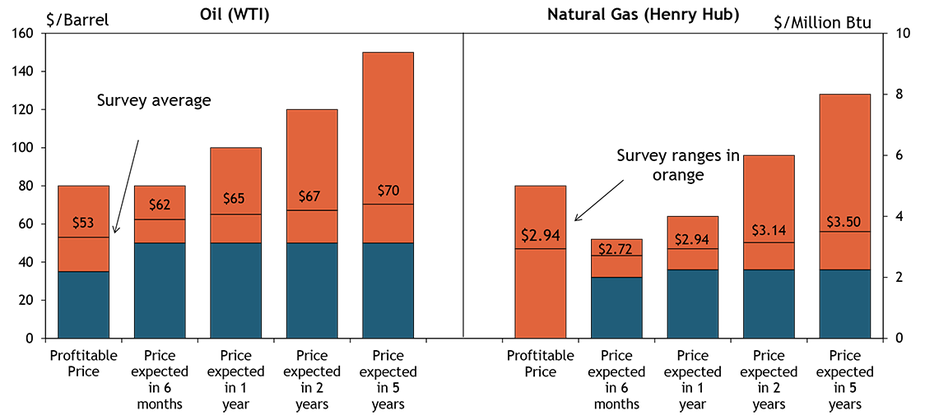
Firms were again asked what they expected oil and natural gas prices to be in six months, one year, two years, and five years. Overall, expected oil and natural gas prices were higher than previous price expectations in 2020. The average expected WTI prices were $62, $65, $67, and $70 per barrel, respectively. The average expected Henry Hub natural gas prices were $2.72, $2.94, $3.14, and $3.50 per million Btu, respectively.
Firms were also asked about the crude oil supply gap (Chart 3). Around 42% of firms indicated there would be a supply gap beyond 2021, with 37% of firms reporting no gap would exist after this year. Approximately 21% of firms were unsure about crude oil supply gap.
Chart 3. Special Question - Do you believe there will be a crude oil supply gap beyond 2021?
Skip to data visualization table| Answer | Percent |
|---|---|
| Yes | 42 |
| No | 37 |
| No opinion or do not know | 21 |
Additionally, firms were again asked about the availability of financing (Chart 4). Financing has become more available, with around 61% of firms indicating more availability of financing and only 39% reporting less availability. This is in contrast to previous times this question was asked, with 22% in 2015 and 42% in 2017 saying more financing was available and 78% and 58% of firms, respectively, reporting less financing was offered.
Chart 4. Special Question - Has financing become more or less available for your firm in recent months?
Skip to data visualization table| Change | More | Less |
|---|---|---|
| 2015 | 22 | 78 |
| 2017 | 42 | 58 |
| 2021 | 61 | 39 |


Selected Energy Comments
“Full time employment is way down, will continue to be down, and will be replaced with more contract/part time workers.”
“We anticipate 2021 US production to remain flat with single digit to low double-digit growth in 2022. Policy and fuel switching concerns are generally over-estimated in light of the practical and physical realities of the energy mix. Oil and gas will become cleaner and continue to secure its role as the primary fuel source for several decades to come.”
“A tremendous amount of uncertainty will exist on both the demand side and politically during the next 12 to 24 months. Conquering Covid-19 and returning to normal market demand will be the first step. US policy change will then provide the next tailwind or headwind depending upon direction and balance.”
“Production in the US was expected to move consistently upward. That is over. Now the question is how quickly it will fall and stay below 10mmbd.”
“It appears that US shale producers are less likely to immediately respond with increased drilling/completion rates when oil price increases provide them with increased cashflow.”
“Capital markets are demanding E&P companies to generate cash flow in excess of their capital investment, or in other words generate free cash flow. With the upward price movement public E&Ps so far have not raised capital investment.”
“The years of over-spending by shale drillers will limit the survivors’ opportunities to fund drilling programs. The oil markets will become more dependent on the actions of OPEC producers as they regain market share. This will become more obvious once investors realize many of the horizontal plays have been over-drilled and billions were wasted on wells that did not need to be drilled.”
“We have lost many employees that left when the price fell apart last spring. It has been difficult to hire appropriately skilled labor.”
“Investor sentiment has changed from growth to value. A more cautious approach to growth will be the focus for the next 12 to 24 months as demand recovery occurs. Demand will drive decisions long-term.”
Additional Resources
The views expressed are those of the authors and do not necessarily reflect the positions of the Federal Reserve Bank of Kansas City or the Federal Reserve System.
Author