The share of prime-age individuals (age 25 to 54) working or looking for work decreased dramatically during and after the Great Recession. Since 2015, however, this share—also known as the prime-age labor force participation rate—has been increasing alongside a strengthening labor market. Chart 1 shows that after falling from 83.1 percent in 2008 to 80.9 percent in 2015, the prime-age labor force participation rate increased by 1.7 percentage points to 82.6 percent in 2019, corresponding to 3 million more prime-age individuals in the labor force.
Chart 1: U.S. Prime-Age Labor Force Participation Rate, 2008–19
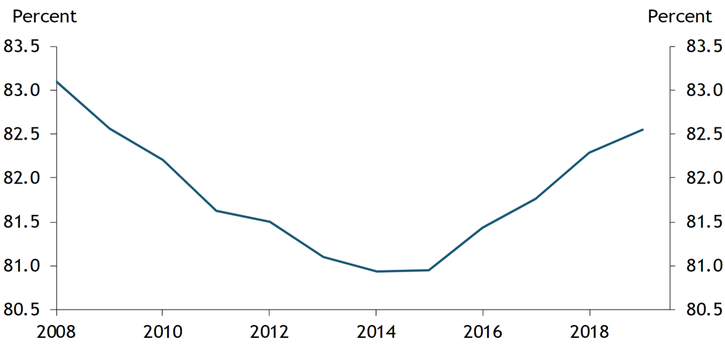
Note: Rates are averages for each year, using data through November 2019.
Sources: U.S. Census Bureau and authors’ calculations.
These gains may not be evenly distributed across workers of different sexes and education levels. Women historically have lower participation rates than men, and individuals with lower educational attainment historically have lower participation rates than their more-educated counterparts. To account for these differences, we use data from the U.S. Census Bureau’s Current Population Survey to quantify the contributions from different demographic groups to the recent rebound in the prime-age labor force participation rate. Specifically, we group prime-age individuals into one of four groups: men with less than a bachelor’s degree (non-college men), men with a bachelor’s degree (college men), women with less than a bachelor’s degree (non-college women), and women with a bachelor’s degree (college women).
Table 1 shows the labor force participation rates over time for all four groups and yields four key observations. First, prime-age men and women without a bachelor’s degree saw larger deteriorations in their labor force participation rates from 2008 to 2015 than their college-educated counterparts. Second, the labor force participation rates have increased for all four groups since 2015. Third, despite these increases, the labor force participation rates for prime-age men and women without a bachelor’s degree are 2 percentage points below their pre-recession levels. Fourth, among prime-age individuals, only college-educated women have seen their labor force participation rate fully recover to and exceed its pre-recession level.
Table 1: U.S. Prime-Age Labor Force Participation Rates by Sex and Education
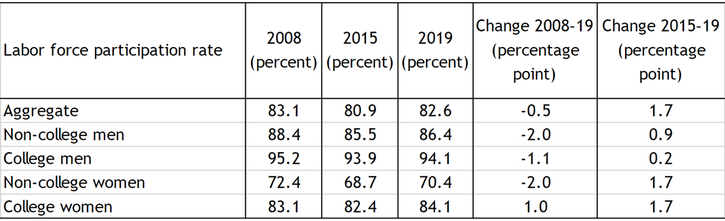
Note: Rates are averages for each year, using data through November 2019.
Sources: U.S. Census Bureau and authors’ calculations.
The increase in the aggregate prime-age labor force participation rate since 2015 could be due not only to increases in the labor force participation rates of different sex and education groups but also due to changes in the relative population of each group. For example, college-educated women had much higher labor force participation rates than non-college women in 2015. Even if college-educated women’s labor force participation rate had not changed from 2015 to 2019, an increase in the share of prime-age women with a college degree would cause the aggregate prime-age labor force participation rate to rise as well.
Chart 2 decomposes the 2015–19 change in the prime-age labor force participation rate into the contributions from each of these possible sources. The green bars show the contributions from changes in the population shares of each group, while the orange bars show the contributions from changes in the labor force participation rates (LFPR) of each group. The blue bars show the net contribution from each group to the 1.7 percentage point increase in the prime-age labor force participation rate from 2015 to 2019.
Chart 2: Decomposing the 2015–19 Change in the Prime-Age Labor Force Participation Rate
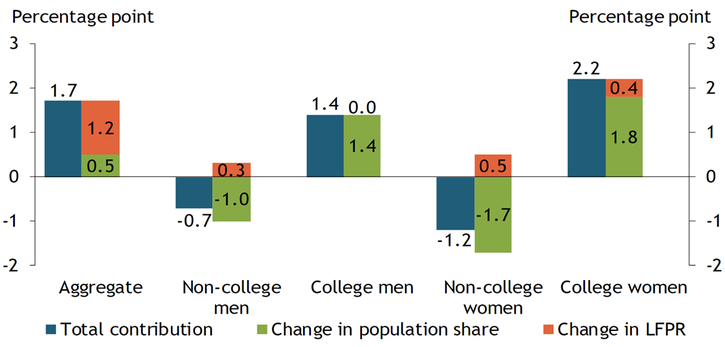
Sources: U.S. Census Bureau and authors’ calculations.
Although changes in individual groups’ labor force participation rates account for most of the overall increase in the prime-age labor force participation rate, the population shares of these groups have also shifted from 2015 to 2019. The orange bars show that increases in the labor force participation rates of each group made positive contributions to the aggregate prime-age labor force participation rate. The green bars show that the prime-age population has shifted toward college-educated individuals, leading to positive contributions from college-educated men and women and negative contributions from non-college men and women.
Overall, women contributed 1 percentage point (−1.2 + 2.2) of the total 1.7 percentage point increase in prime-age labor force participation from 2015 to 2019, while men contributed 0.7 percentage point (−0.7 + 1.4). This discrepancy is due to larger increases in both the population share and the labor force participation rate of college-educated women relative to men.
Our results suggest that college-educated women have primarily driven the recent rebound in the prime-age labor force participation rate. In particular, our results show that both a greater share of college-educated women and a higher increase in their labor force participation rate relative to men are behind the recent rebound in the prime-age labor force participation rate. Notably, although the labor force participation rate of college-educated prime-age women has recovered to its pre-recession level, it still remains well below the participation rates of both college-educated and non-college-educated men. A greater share of women who report caring for family as their reason for not participating in the labor force may explain this discrepancy (Tüzemen and Tran 2019).
Reference
Tüzemen, Didem, and Thao Tran. 2019. “The Uneven Recovery in the Prime-Age Labor Force Participation.” Federal Reserve Bank of Kansas City, Economic Review, vol. 103, no. 1, pp. 5–30.
Didem Tüzemen is a senior economist at the Federal Reserve Bank of Kansas City. Thao Tran is a research associate at the bank. The views expressed are those of the authors and do not necessarily reflect the positions of the Federal Reserve Bank of Kansas City or the Federal Reserve System.