State-issued quarantine and shelter-in-place orders to address the spread of COVID-19 dramatically slowed economic activity in March. This slowdown put stress on the municipal bond market, which provides funding for state and local governments, schools, and utility districts. Most of the nearly $4 trillion of outstanding municipal bonds are held by mutual funds, which allow institutional and retail investors to diversify their portfolios (Gillers and Banerji 2020). However, as the pandemic worsened, municipal money fund outflows increased and money managers sold their bond holdings at a rapid rate, leading prices to fall and the municipal bond ratio—the ratio of municipal bond yields to comparable Treasury yields—to increase.
Chart 1 shows that the municipal bond ratio rose sharply in March (green line) relative to late January (blue line), especially for short maturity bonds. The Federal Reserve acted quickly in its role as “lender of last resort” to alleviate price pressures in the bond market. Specifically, the Fed expanded its Money Market Mutual Fund Liquidity Facility (MMLF) in late March to accept certain municipal bonds as eligible loan collateral._ The municipal bond ratio subsequently fell across all maturities (orange line).
Chart 1: Municipal Bond Yield to Treasury Yield Ratio
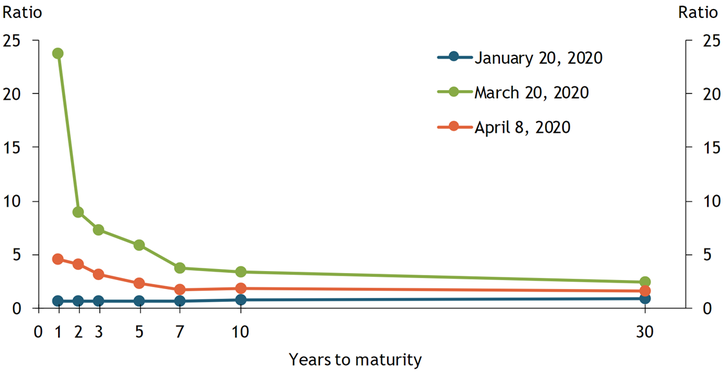
Source: Bloomberg.
Although the expanded MMLF appears to have been effective in driving down the municipal bond ratio, it is not clear why municipal bond yields spiked in the first place. On one hand, investors may have been driven to sell their bonds due to liquidity concerns. Municipal bonds are already fairly illiquid because they are thinly traded. To the extent investors were concerned about their future ability to sell their holdings, they may have sought a first-mover advantage in selling quickly. On the other hand, investors may have been motivated to sell to reduce their exposure to credit risk. The COVID-19 pandemic is likely to reduce both the tax base and revenue streams for the state and local governments that issue municipal bonds, increasing credit risk in the market. Indeed, the greater increase for shorter-maturity bonds may reflect the fact that states extended their tax payment deadlines, thereby increasing their short-term default probabilities (Haughwout, Hyman, and Lieber 2020).
To disentangle the roles of liquidity and credit risks in driving the late March rise in municipal bond yields, we examine the “excess spread” that investors price into municipal bonds over and above their historical measurable credit risk._ If the excess spread can be explained by a combination of the issuer state’s exposure to COVID-19 and its prevailing fiscal position, investors likely acted due to fears of credit risk. If the excess spread cannot be explained by these factors, investors likely acted on liquidity concerns and without regard to increasing credit risks.
Using a regression model, we find that investors likely acted due to liquidity concerns, not state-specific credit risks. Table 1 shows that the effects of three state-specific fundamentals—the share of industries affected by COVID-19, the COVID-19 incidence rate (cases per 100,000 people), and the rainy day fund balance as a share of total expenditures—are not statistically significant, suggesting they cannot explain the excess spreads. Neither an increase in the share of industries affected by COVID-19 (implying lower tax revenues) nor an increase in the COVID-19 incidence rate (implying higher spending on health care), is associated with higher spreads on March 20, just prior to the Federal Reserve’s intervention._
Table 1: Regression Model of Excess Spread on March 20
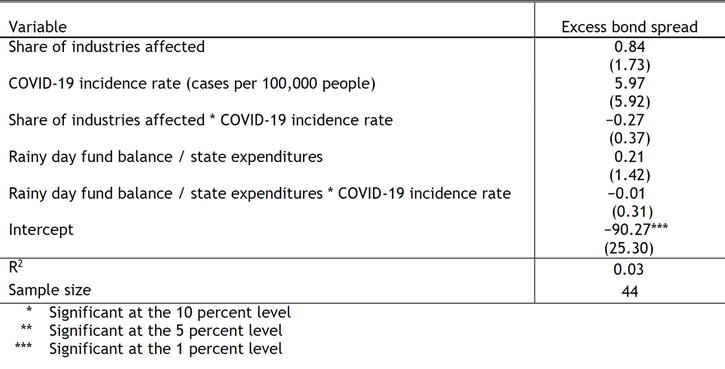
Note: Standard errors are shown in parentheses.
Sources: BEA (Haver Analytics), NASBO Fiscal Survey of States, New York Times COVID-19 Data, and authors’ calculations.
Furthermore, a decline in the balance of rainy day funds as a share of total expenditures—implying a smaller spending buffer for state governments—is not associated with higher spreads, even when interacted with the COVID-19 incidence rate. The lack of fiscal or structural explanations for the higher excess spread suggests that municipal bond investor sales were primarily motivated by liquidity concerns, rather than credit risks._
The ongoing pandemic continues to pose challenges for cities and states, however, suggesting credit risk will likely have a larger influence on municipal bond yields going forward. Chart 2 shows the median unemployment insurance (UI) trust fund reserve ratio and rainy day fund balance for U.S. states. Although both unemployment insurance and rainy day funds have increased since the last recession, they may not be sufficient to cover states’ expenses should the downturn in economic activity from the COVID-19 pandemic persist. In 2019, the median state held 28 days of state expenditures in rainy day funds, while UI reserve funds were 1.2 percent of total wages paid in UI-covered employment. To date, UI claims have reached record levels nationally, and GDP fell at a greater-than-expected rate in the first quarter, portending significant stress to state fiscal situations. Overall, these rising credit risks will likely drive up borrowing costs, creating future challenges for localities financing capital expenditures.
Chart 2: State Fiscal Conditions
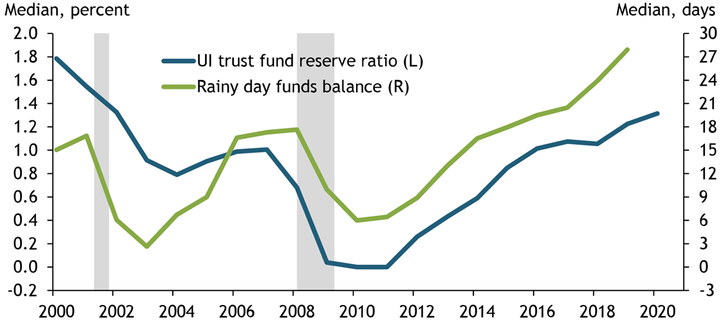
Note: Gray bars denote National Bureau of Economic Research (NBER)-defined recessions.
Sources: PEW and Department of Labor.
Our analysis highlights that the initial rise in municipal bond yields in March largely reflected investors’ broad-based liquidity concerns rather than state-specific credit risks. Federal Reserve actions helped alleviate these pricing pressures as indicated by the dramatic decline in municipal bond yields following the announcement of the expanded MMLF. More recently, the Federal Reserve announced a program to purchase municipal bonds directly from local issuers with U.S. Treasury support. Going forward, however, credit risks are likely to have a greater influence on the municipal bond market.
Endnotes
-
1 The Federal Reserve announced that it would accept highly rated municipal securities with remaining maturity of less than 12 months as collateral in MMLF facility on March 20. On March 23, the Federal Reserve expanded the eligible MMLF collateral to include municipal variable rate demand notes. For a more complete discussion on the run on money market mutual funds, see Sengupta and Xue (2020).
-
2 We determine the excess spread by calculating the difference between the average liquidity- and maturity-adjusted market yield on all municipal bonds issued by jurisdictions within a state and that same state’s average implied yield on March 20 from Bloomberg. The implied yield is the predicted yield on a municipal security from a model accounting for credit risk and local economic conditions. Excess spread is a widely used gauge of changes in credit conditions in bond markets. See Gilchrist and Zakrajšek (2012) for further details and an application to corporate bond markets.
-
3 The state of New York has a significantly higher COVID-19 incidence rate compared with other states, and, as such, is excluded as an outlier in our sample. If we include New York in our sample, some of our estimates are significant at the 10 percent level or better, but this significance is not robust to different model specifications. We also exclude Indiana, Kansas, North Dakota, Oklahoma, and Wyoming from our sample due to the lack of municipal yield data from Bloomberg.
-
4 We also investigate changes to market and implied spreads separately between January 17 and March 20. The first COVID-19 case in the United States was reported on January 20. The results for changes in spreads for the cross-section of states is similar to what we find for the excess spreads on March 20.
References
Gilchrist, Simon, and Egon Zakrajšek. 2012. “External LinkCredit Spreads and Business Cycle Fluctuations.” American Economic Review, vol. 102, no. 4, pp. 1692–1720.
Gillers, Heather and Gujan Banerji. 2020. “External LinkHow the Muni Market Became the Epicenter of the Liquidity Crisis.” Wall Street Journal, April 2.
Haughwout, Andrew F., Benjamin G. Hyman, and Matthew Lieber. 2020. “External LinkHelping State and Local Governments Stay Liquid.” Federal Reserve Bank of New York, Liberty Street Economics (blog), April 10.
Sengupta, Rajdeep, and Fei Xue. 2020. “External LinkThe Global Pandemic and the Run on Shadow Banks.” Federal Reserve Bank of Kansas City, Economic Bulletin, May 11.
Huixin Bi is a research and policy officer at the Federal Reserve Bank of Kansas City. W. Blake Marsh is an economist at the bank. Jacob Dice and Chaitri Gulati are research associates at the bank. The views expressed are those of the authors and do not necessarily reflect the positions of the Federal Reserve Bank of Kansas City or the Federal Reserve System.
Authors

Huixin Bi
Research and Policy Officer

W. Blake Marsh
Senior Economist