Community banks played a disproportionately large role in distributing loans under the Small Business Administration (SBA)’s Paycheck Protection Program (PPP). Although community banks hold only 18 percent of outstanding bank loans, they disbursed 37 percent of all PPP loans.
These loans have helped community banks grow their balance sheets at a time when they might otherwise be driven to shrink them. PPP loans have accounted for the majority of net growth in community bank loans since the onset of the pandemic. Chart 1 shows that loans at community banks grew at a substantial rate of 15 percent over the year ending in 2020:Q3 (blue bar). Without PPP loans, loan growth at these institutions was only 4.5 percent (green bar)._ The dominance of PPP loans in bank loan growth indicates that the PPP’s forgiveness terms and government guarantees likely supported the demand for PPP loans by firms and their supply by banks, respectively. The limited loan growth outside of the PPP program underscores survey results reporting tightening bank standards and a lack of demand for other loan types at commercial banks._ Accordingly, PPP loans appear to have helped meet the funding needs of small firms at a time when banks otherwise curtailed lending in response to uncertain economic conditions.
Chart 1: PPP Loans Account for Most Loan Growth at Community Banks from 2019:Q3 to 2020:Q3
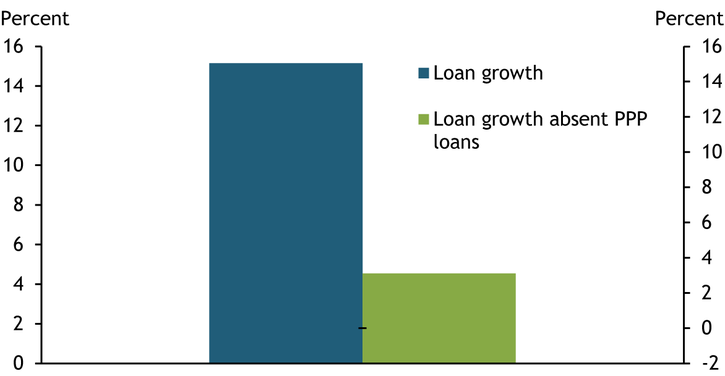
Sources: FFIEC Call Reports (Board of Governors of the Federal Reserve System) and authors’ calculations.
Although the PPP has helped ease credit conditions, it also has consequences for community bank profitability._ PPP loans carry a lower interest rate—1 percent—than many other types of loans, potentially lowering banks’ profit margins. To examine the effects of the PPP on the profitability of community banks, we split participating community banks into two groups based on their level of exposure to PPP loans and evaluate their net interest margins—a measure of net interest income expressed as a share of interest-earning assets._ Banks whose share of PPP loans to total loans exceeds the median level of 7 percent are categorized as having “high PPP exposure,” and those with shares below the median are categorized as having “low PPP exposure.”
We find that banks with high PPP exposure experienced a larger decline in their net interest margins relative to banks with low PPP exposure._ Chart 2 illustrates the differences in net interest margins across time for the two groups of community banks. Prior to the pandemic, banks that would go on to have high PPP exposure (blue line) were more profitable than their peers (green line), as evidenced by their higher net interest margins. However, after the introduction of the PPP, net interest margins for the two groups of banks converged, suggesting PPP loans were not particularly profitable assets for banks, at least initially.
Chart 2: Community Banks with Higher PPP Exposure Saw More Net Interest Margin Compression
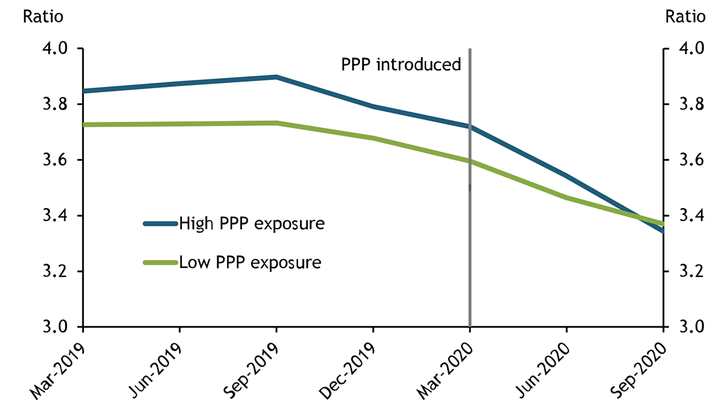
Sources: FFIEC Call Reports (Board of Governors of the Federal Reserve System) and authors’ calculations.
One possible reason for the compressed profit margins at community banks with a higher concentration of PPP loans is the lower yields on these loans. To examine this possibility, we decompose the effects of yields across asset categories on bank net interest margins. Specifically, we apply the method developed in Covas, Rezende, and Vojtech (2015), which disentangles the effects of changes in yields and bank balance sheet composition on net interest margins.
As Chart 3 demonstrates, shrinking loan yields (blue bars) weighed down interest margins for all community banks, regardless of their PPP exposure. However, the effects were much greater for banks with high PPP exposure: low loan yields led net interest margins to decline by 69 basis points at banks with high PPP exposure compared with 48 basis points at banks with low PPP exposure. Declining yields on securities (green bars) and other assets (orange bars), a category that includes reserves and short-term financing such as federal funds and repurchase agreements, also contributed to the compression in net interest margins, but less so than falling loan yields.
Chart 3: Low PPP Loan Yields Compressed Margins of Community Banks with High PPP Exposure
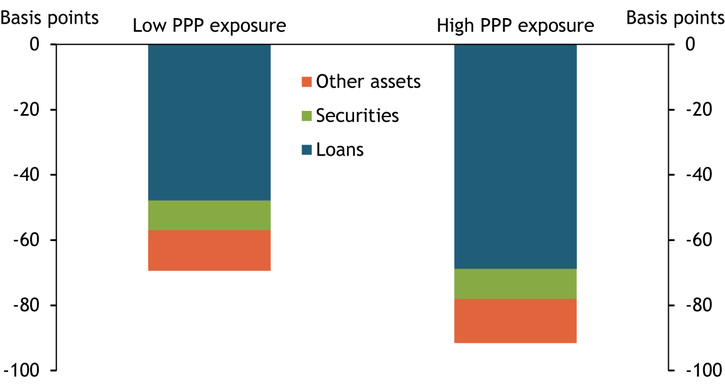
Sources: FFIEC Call Reports (Board of Governors of the Federal Reserve System) and authors’ calculations.
The sheer volume of PPP loans disbursed have somewhat offset their lower yields, as community banks that participated more heavily in the program have seen their interest income grow faster. Chart 4 plots year-over-year growth in net interest income for community banks with high and low PPP exposures as of 2020:Q2 and 2020:Q3, the two quarters when the PPP was in operation. Banks with high PPP exposure experienced net interest income growth of 8 percent and 3 percent over the year ending in 2020:Q2 and 2020:Q3, respectively. Over the same period, banks with low PPP exposure experienced only 3 percent growth over the year ending in 2020:Q2 followed by a 3 percent contraction over the year ending in 2020:Q3.
Chart 4: Net Interest Grew Faster at Community Banks with High PPP Exposure
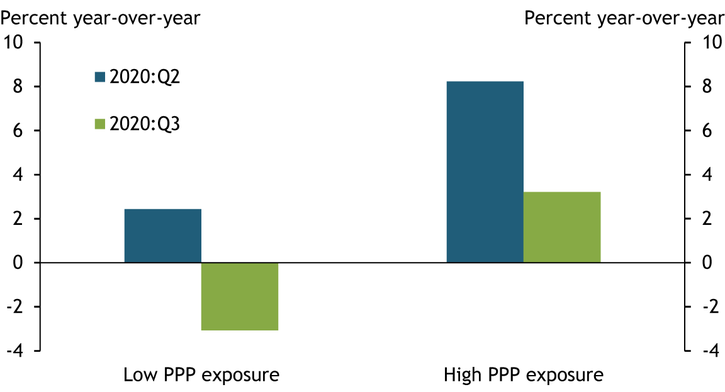
Sources: FFIEC Call Reports (Board of Governors of the Federal Reserve System) and authors’ calculations.
Part of the increase in net interest income at community banks with high PPP exposure is likely due to fees generated. Processing fees earned by banks on each PPP loan are capitalized, or paid out over the life of the loan, and recognized as interest income as they accrue (AICPA 2020). However, recognized interest income arising from these fees to date has not offset the growth of interest-earning assets in the net interest margins calculation._
Overall, our results reveal that participation in the PPP program has grown community bank balance sheets at the expense of bank profitability, with low yields on PPP loans weighing down interest margins at PPP-concentrated banks. Our findings have implications for the near-term outlook of the banking industry and for any subsequent rounds of PPP funding that may be approved. First, as PPP loans become eligible for forgiveness, banks will need to identify alternative lending opportunities that are both sound and remunerative to generate revenue. Since the onset of the pandemic, PPP loans have been an important driver of loan growth at community banks, which have scaled down other types of lending in response to deteriorating economic conditions. Second, the effects of PPP lending on bank profitability have not yet fully materialized, and decisions made in the coming months will likely have implications for the success of any future programs. Because many of the fees and interest payments associated with PPP loans are recognized over the life of the loan, banks with high PPP exposure are likely to earn outstanding interest and fees from PPP loans in the coming quarters, reversing some of the initial setback to profitability. Moreover, the total profitability of a PPP loan is a function of when and how much of the loan is forgiven, terms that are still unsettled for many loans. As a result, the full effect of PPP lending on bank income is not yet known.
Combined, the upfront profitability shock and uncertainty around the ultimate return generated by PPP loans could make banks reluctant to participate in future PPP funding rounds. However, some features of the PPP continue to provide strong participation incentives for banks. Primarily, the program offers a source of stable revenue at a time when alternative lending opportunities are severely limited and bank profitability is likely to improve following loan forgiveness. In addition, PPP loans likely supported bank profitability and capital indirectly by protecting banks from credit losses on existing debt. Many borrowers were likely able to continue making regular payments on existing debt because of the inflow of PPP funds. This dynamic will continue to drive participation decisions at a time when many small and midsized businesses are still struggling and their creditworthiness has declined. Overall, a bank’s decision to participate in future PPP funding rounds, or similar government backed lending programs, is a function of the program’s effects on the bank’s long-term health and the near-term economic outlook.
Endnotes
-
1 We find similar effects of PPP lending at large and regional banks where actual loan growth was more subdued at 2 percent and 8 percent, respectively. Absent PPP lending, though, the loan portfolio contracted at large banks and remained unchanged at regional banks. In total, about 85 percent of all community banks made at least one loan under the PPP program. The initial pandemic-related financial panic was also associated with sizable draws on existing commercial loans, most of which were repaid during the second quarter.
-
2 See recent External LinkSenior Loan Officer Opinion Survey results. Chodorow-Reich and others (2020) show that recipients of PPP loans reduced their non-PPP borrowing in 2020:Q2, suggesting that firms preferred loans that carried the option for forgiveness to other loans.
-
3 Several studies have examined the effect of PPP loans on borrowing firms, including Bartik and others (2020) and Granja and others (2020), but none to our knowledge have examined the effects on participating banks.
-
4 Note that because net interest margins are expressed as a ratio of net interest income to earning assets, they can compress when either 1) banks add low-yielding assets, which increase earning assets relative to interest income; or 2) bank expenses increase relative to income, either through higher liability costs or lower asset yields, thereby reducing net income.
-
5 The PPP also generated a negative effect on participating banks’ leverage capital ratios. While this effect was neutralized for banks participating in the Federal Reserve’s PPP Liquidity Facility (PPPLF), many banks chose to forego this benefit. We estimate that leverage ratios were about 50 basis points lower as of 2020:Q3 for community banks due to PPP participation, net of PPPLF participation.
-
6 The SBA pays lenders fees on PPP loans based on a sliding scale. Banks receive fees of 5 percent for loans up to $350,000, 3 percent for loans more than $350,000 and less than $2 million, and 1 percent for loans of at least $2 million.
References
Association of International Certified Professional Accountants (AICPA). 2020. “External LinkQ&A Section 2130: Paycheck Protection Program (PPP).”
Bartik, Alexander W., Zoe B. Cullen, Edward L. Glaeser, Michael Luca, Christopher T. Stanton, and Adi Sunderam. 2020. “External LinkThe Targeting and Impact of Paycheck Protection Program Loans to Small Businesses.” National Bureau of Economic Research, working paper no. 27623, July.
Chodorow-Reich, Gabriel, Olivier Darmouni, Stephen Luck, and Matthew Plosser. 2020. “External LinkBank Liquidity Provision across the Firm Size Distribution.” National Bureau of Economic Research, working paper no. 27945, October.
Covas, Francisco B., Marcelo Rezende, and Cindy M. Vojtech. 2015. “External LinkWhy Are Net Interest Margins of Large Banks So Compressed?” Board of Governors of the Federal Reserve System, FEDS Notes, October 5.
Granja, João, Christos Makridis, Constantine Yannelis, and Eric Zwick. 2020. “External LinkDid the Paycheck Protection Program Hit the Target?” National Bureau of Economic Research, working paper no. 27095, November.
W. Blake Marsh is a senior economist at the Federal Reserve Bank of Kansas City. Padma Sharma is an economist at the bank. The views expressed are those of the authors and do not necessarily reflect the positions of the Federal Reserve Bank of Kansas City or the Federal Reserve System.
Authors

W. Blake Marsh
Senior Economist