U.S. government debt as a share of GDP has been increasing since the 2008 global financial crisis. Chart 1 shows that government debt held by the public is close to 100 percent of GDP, just slightly lower than its peak during World War II. Going forward, the Congressional Budget Office (CBO) expects this ratio will continue to increase along with mandatory spending on Social Security, Medicare, and Medicaid.
Chart 1: The supply of U.S. government debt continues to grow
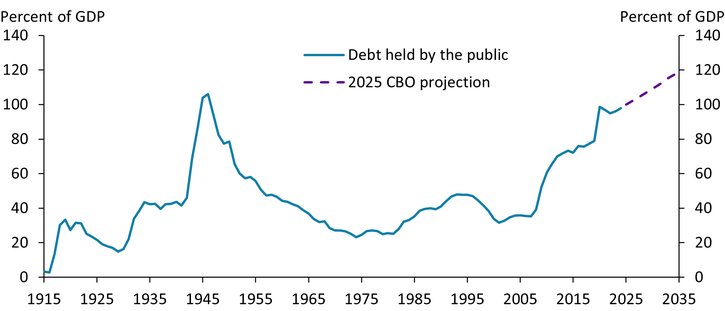
Source: CBO.
The issuance of Treasury securities has risen sharply as the federal debt has increased, putting upward pressure on interest rates. As illustrated in Auclert and others (2025), changes in interest rates depend on the balance between the supply and demand of government debt and privately supplied assets. If the supply of assets rises more than demand, interest rates increase; if demand for assets rises more than supply, interest rates fall. Thus, a higher supply of Treasury securities—if not offset by stronger demand for Treasuries or a lower supply of private debt—would lead to a higher interest rate.
To quantify how rising Treasury issuance influences interest rates, we follow the high-frequency identification strategy in Phillot (2025), and Bi, Phillot, and Zubairy (2025). Specifically, we use movements in Treasury futures prices within a narrow window around Treasury auction announcements to identify Treasury supply shocks that are unanticipated by financial markets._
Chart 2 shows how an expansion of Treasury supply influences both Treasury yields and the term premium—that is, the extra return investors demand for holding long-term bonds rather than short-term bonds. The left panel of Chart 2 shows that in response to a Treasury supply shock that increases the debt-to-GDP ratio by 1 percent over two years, Treasury yields increase across all maturities, leading to an upward shift in the yield curve._ The increase in yields is hump-shaped across maturities: The greatest increase is to five- and 10-year Treasury yields, with the 10-year yield rising by 1.3 basis points on impact, while the effect is smaller on Treasuries with both longer and shorter maturities._ The right panel of Chart 2 shows that the same Treasury supply shock raises the term premium across the curve, with progressively larger increases for longer-term securities. Importantly, the increase in the term premium accounts for a large share of the increase in yields, reflecting that the Treasury supply shock increases uncertainty about long-term interest rates.
Chart 2: A Treasury supply expansion increases yields and term premiums across maturities
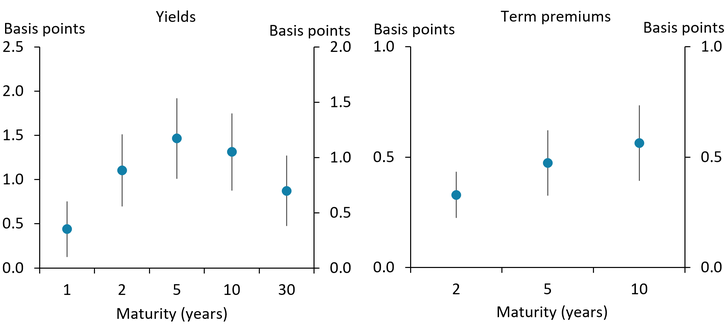
Notes: The dots present the estimated impact responses of yields and term premiums in daily frequency regressions following a Treasury supply shock that increases the debt-to-GDP ratio by 1 percent over two years. The whiskers show the 90 percent confidence bands.
Source: Bi, Phillot, and Zubairy (2025).
A higher-than-expected Treasury supply also increases the long-run equilibrium real interest rate as well as inflation expectations—especially during periods when government debt grows more quickly. Chart 3 decomposes five-to-10-year-ahead nominal Treasury yields into their components (as detailed by Kim, Walsh, and Wei 2019) and shows that all of these components increase in response to the same Treasury supply shock used in Chart 2. While the left bar of Chart 3 shows that the effect is relatively modest when government debt growth is stable, the right bar shows that during periods of high debt growth, the Treasury supply shock increases the five-to-10-year-ahead real term premium by about 1.0 basis point (light blue area). The real average future short-term interest rate, which can be viewed as a measure of the equilibrium level of the real federal funds rate in the long run, increases by 0.6 basis points (purple area). In addition, inflation expectations and the inflation risk premium each rise by close to 0.3 basis points (green and dark blue areas, respectively).
Chart 3: A Treasury supply expansion raises the five-to-10-year-ahead real short rate and expected inflation
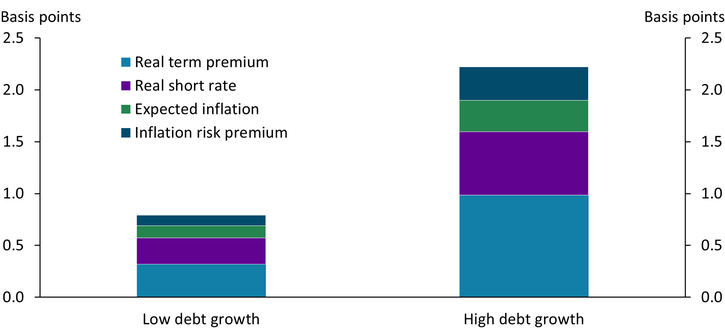
Notes: Chart shows the estimated responses of five-to-10-year-ahead real term premium, real short rate, expected inflation, and inflation risk premium following a Treasury supply shock that increases the debt-to-GDP ratio by 1 percent in two years. The right bar shows the responses during two high debt growth periods (January 2008–April 2013 and January 2020–April 2022), and the left bar shows the responses outside of those periods. The decomposition of the term premium and inflation expectations follows Kim, Walsh, and Wei (2019).
Sources: Kim, Walsh, and Wei (2019) and authors’ calculations.
Structural factors, such as an aging society and a global savings glut, may have supported the demand for U.S. Treasuries and weighed on interest rates after the 2007–09 global financial crisis (Auclert and others 2025; Smith and Bundick 2025). Going forward, however, rising government debt levels may put upward pressure on interest rates, and investors may demand a higher term premium to compensate for these interest rate risks._ All those movements can have important implications for the macroeconomy. Treasury supply shocks can crowd out private sector activity by reducing investment and production, particularly during periods of rapid debt growth (Bi, Phillot, and Zubairy 2025). In addition, higher government debt may also increase the long-run neutral rate, which can have important implications for monetary policy.
Endnotes
-
1 Phillot (2025) and Bi, Phillot, and Zubairy (2025) provide further details. We use Treasury futures prices of two-year, five-year, 10-year, and 30-year securities between October 1998 and February 2025.
-
2 Chart 2 shows the impact responses of yields and term premiums in daily frequency regressions. As detailed in Bi, Phillot and Zubairy (2025), the same shock leads to an increase in the debt-to-GDP ratio of 1 percent within two years in monthly frequency regressions.
-
3 The response of the 10-year Treasury yield peaks at 2.5 basis points a few days following the Treasury supply shock.
-
4 In addition to changes in Treasury supply, Dilts Stedman (2025) and Sengupta and Jacobs (2025) show that the shifting demand among investors for Treasuries may raise yields and interest rate volatilities going forward.
Article Citation
Bi, Huixin, Maxime Phillot, and Sarah Zubairy. 2025. "Higher Treasury Supply Is Likely to Put Upward Pressure on Interest Rates." Federal Reserve Bank of Kansas City, Economic Bulletin, November 24.
References
Auclert, Adrien, Hannes Malmberg, Matthew Rognlie, and Ludwig Straub. 2025. “External LinkThe Race Between Asset Supply and Asset Demand.” Presented at the Federal Reserve Bank of Kansas City’s Jackson Hole Economic Policy Symposium, Jackson Hole, WY, August 21–23.
Bi, Huixin, Maxime Phillot, and Sarah Zubairy. 2025. “External LinkTreasury Supply Shocks: Propagation Through Debt Expansion and Maturity Adjustment.” Working Paper.
Dilts Stedman, Karlye. 2025. “External LinkThe Changing Investor Composition of U.S. Treasuries, Part 1: Foreign Treasury Sales could Raise U.S. Yields.” Federal Reserve Bank of Kansas City, Economic Bulletin, July 9.
Kim, Don, Cait Walsh, and Min Wei. 2019. “External LinkTips from TIPS: Update and Discussions.” Board of Governors of the Federal Reserve System, FEDS Notes, May 21.
Phillot, Maxime. 2025. “External LinkU.S. Treasury Auctions: A High-Frequency Identification of Supply Shocks.” American Economic Journal: Macroeconomics, vol. 17, no. 1, pp. 245–273.
Sengupta, Rajdeep, and Joshua A. Jacobs. 2025. “External LinkThe Changing Investor Composition of U.S. Treasuries, Part 2: Who’s Buying U.S. Treasuries?” Federal Reserve Bank of Kansas City, Economic Bulletin, July 9.
Smith, A. Lee, and Brent Bundick. 2025. “External LinkReassessing Zero Lower Bound Risk: Safe Assets and Interest Rates Post-Pandemic.” Federal Reserve Bank of Kansas City, Economic Review, vol. 110, no. 5.
Huixin Bi is an assistant vice president and economist at the Federal Reserve Bank of Kansas City. Maxime Phillot is an economist at the Swiss National Bank. Sarah Zubairy is a professor of economics at Texas A&M University. The views expressed are those of the authors and do not necessarily reflect the positions of the Federal Reserve Bank of Kansas City, the Federal Reserve System, or the Swiss National Bank. The Swiss National Bank takes no responsibility for any errors or omissions in, or for the correctness of, the information contained in this paper.
Author