Realized inflation has risen to a 40-year high in recent months, leading policymakers to pay especially close attention to surveys that measure households’ inflation expectations. Changes in survey-based measures of household inflation expectations may signal changes in underlying inflation expectations that drive households’ spending decisions, making them useful in predicting realized inflation. However, surveys comprise thousands of responses, and policymakers have historically focused only on the median household response. If households learn about underlying inflation infrequently, this summary statistic may change slowly, making it a less timely signal of underlying inflation expectations.
In 2021, for example, median inflation expectations increased gradually, which may have led policymakers to falsely conclude that underlying inflation expectations were stable. Chart 1 compares one-year-ahead inflation expectations from the University of Michigan Survey of Consumers (blue line) with year-over-year realized inflation (green line) measured by the price index for personal consumption expenditures (PCE). Although both measures increased in 2021, there is no clear causal relationship between the two; in fact, realized inflation appears to have increased sharply from February to April, while the largest jump in median inflation expectations did not occur until May. A policymaker who looked only at median inflation expectations may have missed signs that underlying expectations began to rise in early 2021.
Chart 1: Median short-term inflation expectations may not provide a timely signal of an increase in the underlying expectations that affect realized inflation
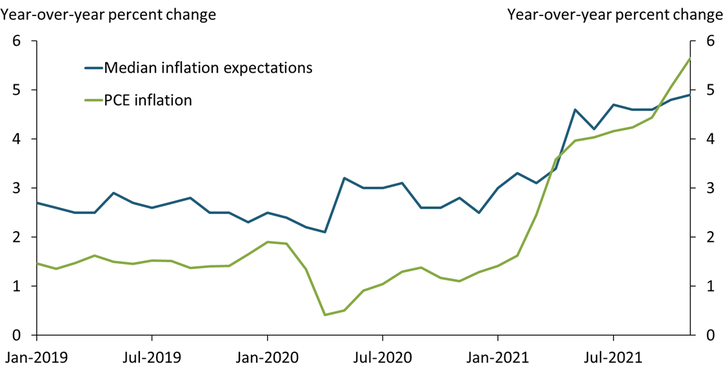
Sources: University of Michigan and FRED (Federal Reserve Bank of St. Louis).
An alternative way to gauge a potential rise in underlying inflation expectations is to look at disagreement among households—that is, a widening in the distribution of household inflation expectations due to more households reporting high expectations—rather than just the median. Reis (2021) argues that an asymmetric increase in the share of households with high short-term inflation expectations may give a timelier signal of the path of underlying inflation expectations than the median alone. In particular, Reis (2021) shows that disagreement about future inflation appeared in household surveys in the late 1960s and early 1970s, prior to expectations rising dramatically in the 1970s.
One reason disagreement may be a useful early signal is that it captures changes in the expectations of households who are considering large purchases, which is one way that inflation expectations affect realized inflation in theory. Households who expect higher future prices for big durable goods, like cars or houses, may purchase them in the present while they are relatively cheap. In response to this higher demand for goods and services, firms raise prices and realized inflation increases. However, individuals’ inflation expectations may vary depending on their knowledge of economic conditions. For example, households that have not made any large purchases for several years may not have researched economic conditions as recently or as closely as households saving up for major financial outlays, leading the inflation expectations of these two groups of households to diverge. This theory of “sticky information” for households suggests that an increase in underlying inflation expectations will show up as an increase in disagreement, as newly informed consumers increase their inflation expectations before those with outdated information._
I apply the analysis from Reis (2021) to 2021–22 data and show that disagreement about inflation expectations increased in the winter of 2021, well before the median rose appreciably. Chart 2 compares the distributions of one-year-ahead inflation expectations from February 2019 and February 2021. The distributions in 2019 (green line) and 2021 (blue line) peak at similar values, with 2021’s median of 3.3 percent only slightly above the typical pre-pandemic median. However, the distribution in 2021 is wider than the distribution in 2019 with larger spikes around 10 percent and 15 percent, suggesting substantial disagreement among households about the possible paths of future inflation.
Chart 2: The distribution of inflation expectations in February 2021 shows larger spikes at higher rates
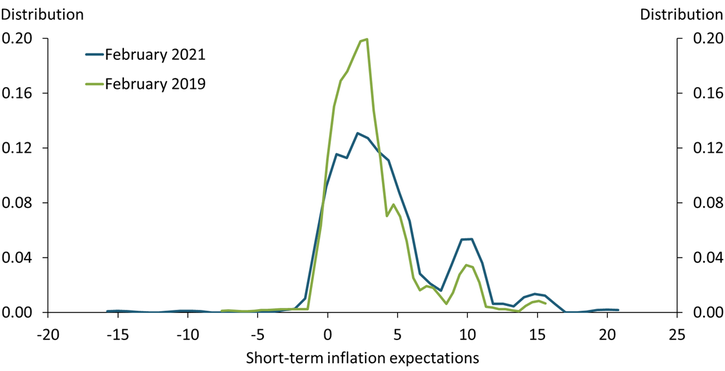
Source: University of Michigan.
Since February 2021, both median household inflation expectations and realized inflation have increased substantially. However, the distribution of expectations appears to have become smoother as of May 2022, consistent with expectations ceasing the upward drift seen earlier in 2021. Chart 3 compares the distribution of one-year-ahead inflation expectations in May of 2019 (orange line), 2021 (green line), and 2022 (blue line). The median inflation expectation has continued to rise, from 2.9 percent in 2019 to 4.6 percent in 2021 to 5.3 percent in 2022. However, the distribution has also become smoother: by May 2022, the previous spikes at 10 percent have become central to the distribution, while the spikes at 15 and 20 percent have become less pronounced, with no new spikes. The reduction in mass at 15 and 20 percent and the absence of new spikes is heartening, as it does not foreshadow further upward drift in households’ inflation expectations.
Chart 3: May 2022 inflation expectations are smoothly distributed with a high median
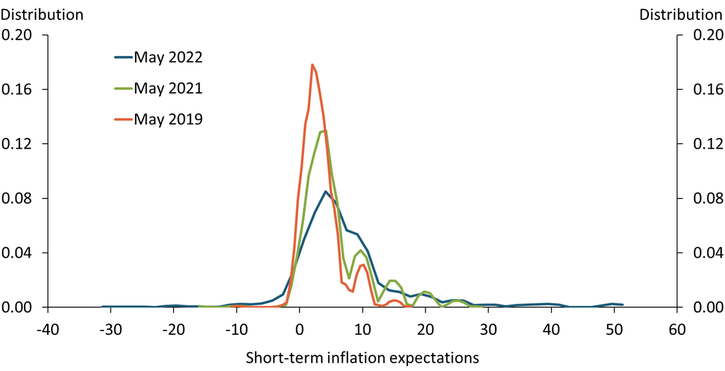
Source: University of Michigan.
In conclusion, both theory and empirical evidence suggest that disagreement in the distribution of inflation expectations may provide a timely signal of changes in the underlying expectations that affect realized inflation. On one hand, the distribution in May 2022 does not signal the same imminent increase in underlying expectations as a year ago. On the other hand, the distribution is centered around a much higher median than before the pandemic with no new spikes at low values, suggesting the return to pre-pandemic expectations has not yet begun and may take some time to unfold.
Endnotes
-
1 Mankiw and Reis (2002) introduce a theory of “sticky information” similar to what I have outlined here. They focus on firms that infrequently research aggregate information when changing their prices.
References
Mankiw, N. Gregory, and Ricardo Reis. 2002. “External LinkSticky Information versus Sticky Information: A Proposal to Replace the New Keynesian Phillips Curve.” Quarterly Journal of Economics, vol. 117, no. 4, pp. 1295–1328.
Reis, Ricardo. 2021. “External LinkLosing the Inflation Anchor.” Brookings Papers on Economic Activity, September 8.
Andrew Glover is a senior economist at the Federal Reserve Bank of Kansas City. The views expressed are those of the author and do not necessarily reflect the positions of the Federal Reserve Bank of Kansas City or the Federal Reserve System.
Author