As highlighted in Mustre-del-Río, Oliyide, and Pollard (2025), an alternative version of the Kansas City Fed’s Labor Market Conditions Indicators (LMCI) calculated without delayed government data still provides a useful picture of the labor market. In this Bulletin, we update the restricted version of the LMCI using the latest data available through the end of October._
Chart 1 shows the restricted level of activity indicator (blue line) and illustrates that labor market activity has been stable over the past few months. In October, the restricted level of activity indicator came in at 0.61, only 0.03 above the September reading and still well above zero (the indicator’s historical average). Outside of announced job cuts (which is a leading indicator), the variables included in the construction of the restricted LMCI changed little between September and October, creating only modest change in the level of activity indicator.
Chart 1: The restricted level of activity indicator was little changed in October
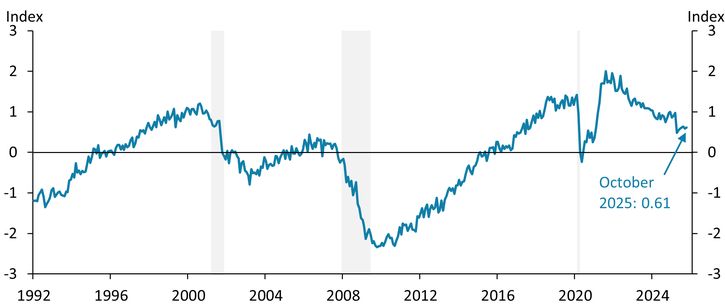
Note: Gray shaded areas represent National Bureau of Economic Research (NBER)-defined recessions.
Sources: Federal Reserve Bank of Kansas City, NBER (Haver Analytics), and authors’ calculations.
In contrast to the modest change in the level of activity, Chart 2 shows that momentum in the labor market decelerated sharply between September and October. The momentum indictor came in at −1.60 in October, down by 0.54 relative to September. The decline in momentum in October was primarily driven by a large negative contribution from announced job cuts (Challenger-Gray-Christmas). In October, Challenger-Grey-Christmas recorded 153,074 announced job cuts, up from 54,064 in September. If job cuts had remained at 54,064 in October, momentum would have been unchanged at −1.06.
Chart 2: The restricted momentum indicator decelerated sharply in October
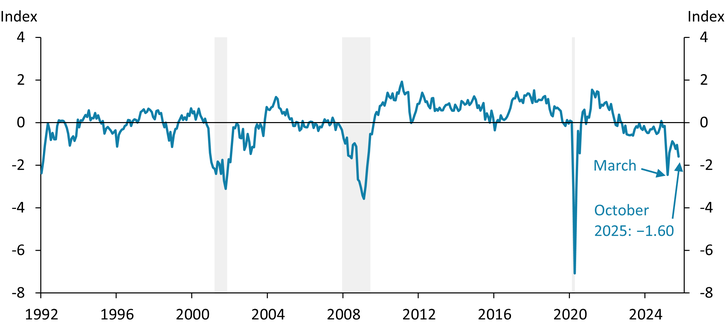
Note: Gray shaded areas represent NBER-defined recessions.
Sources: Federal Reserve Bank of Kansas City, NBER (Haver Analytics), and authors’ calculations.
The announced job cuts series is volatile, and declines in momentum driven by job cuts often reverse in subsequent months. For example, in March 2025, there were 275,240 announced job cuts. This translated into a restricted LMCI momentum value of −2.46, as seen in the large downward spike in Chart 2. The following month, announced job cuts came in at 105,441, and momentum bounced back to −1.43. Consequently, while this month’s decline in momentum appears large, it may revert quickly if announced job cuts follow a similar pattern now as they did between March and April.
Following Mustre-del-Río, Oliyide, and Pollard (2025), we use the restricted LMCI to update our forecast for the unemployment rate and payrolls. The left panel of Chart 3 suggests the unemployment rate remained essentially unchanged between September and October at 4.4 percent, only 0.1 percentage point above August’s official unemployment rate of 4.3 percent. Meanwhile, the right panel of Chart 3 suggests that the economy lost an average of 13,000 jobs per month from August to October. This forecast contraction is driven entirely by the aforementioned announced job cuts in October. As shown by the light purple dot, if the number of announced job cuts had been the same in October as in September, our model would have predicted average employment gains of 47,000 jobs per month between August and October, a modest decline from 51,000 jobs per month in September.
Chart 3: The restricted LMCI suggests the unemployment rate remained essentially unchanged in October and employment growth turned negative
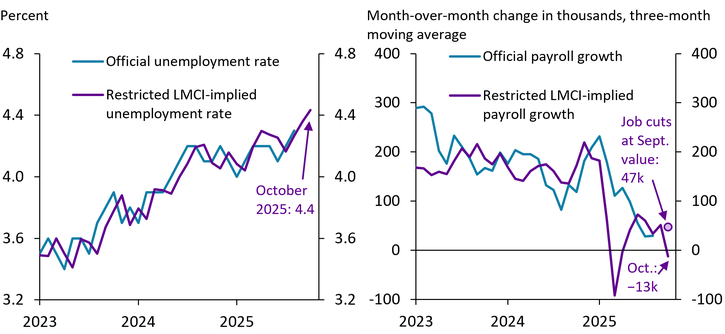
Sources: U.S. Bureau of Labor Statistics (Haver Analytics), Federal Reserve Bank of Kansas City, and authors’ calculations.
Download Materials
Endnotes
-
1 A total of nine variables are used in the construction of the restricted LMCI: the expected unemployment rate in four quarters from Blue Chip, the job availability index from the Conference Board, the percentage of firms with positions not able to fill right now from NFIB, the percentage of firms planning to increase employment from NFIB, initial claims (calculated as a four-week average through the week ending October 31), the expected job availability index from the University of Michigan Survey of Consumers, the manufacturing employment index from ISM, announced job cuts from Challenger-Gray-Christmas, and the expected job availability index from the Conference Board. Compared with Mustre-del-Río, Oliyide, and Pollard (2025), the current version of the restricted LMCI excludes both the quits and hires rate from JOLTS, which have not been updated since September 30. We find the differences, over time, between the restricted LMCI presented here versus in Mustre-del-Río, Oliyide, and Pollard (2025) are small.
Article Citation
Mustre-del-Río, José, Johnson Oliyide, and Emily Pollard. 2025. "An Alternative Version of the KC Fed LMCI Suggests the Level of Activity Was Little Changed but Momentum Decelerated Sharply in October." Federal Reserve Bank of Kansas City, Economic Bulletin, November 10.
Reference
Mustre-del-Río, José, Johnson Oliyide, and Emily Pollard. 2025. “An Alternative Version of the KC Fed LMCI Suggests Little Change in the Labor Market in September.” Federal Reserve Bank of Kansas City, Economic Bulletin, October 10.
José Mustre-del-Río is an assistant vice president and economist at the Federal Reserve Bank of Kansas City. Johnson Oliyide is a research associate at the bank. Emily Pollard is an associate economist at the bank. The views expressed are those of the authors and do not necessarily reflect the positions of the Federal Reserve Bank of Kansas City or the Federal Reserve System.
Authors

José Mustre-del-Río
Research and Policy Officer

Johnson Oliyide
Research Associate