The U.S. labor market has been unusually tight since late 2021, with record-high postings for job vacancies, rapid wage growth, and historically low unemployment rates. As economic growth slows in 2022, however, firms may scale back vacancy postings, with potential effects on both the unemployment rate and wage growth.
Historically, job vacancies tend to be negatively correlated with the unemployment rate, a relationship known as the Beveridge curve._ When firms post more vacancies (often observed during an economic expansion), workers have an abundance of job opportunities, resulting in low unemployment. In contrast, when firms post fewer vacancies (often observed during an economic contraction), workers have fewer job opportunities, leading to higher unemployment. Chart 1 shows that this negative relationship between vacancies and unemployment was present during the 2000–07 and 2008–19 business cycles (blue and green dots, respectively).
Chart 1: Job openings and unemployment rates have had an inverse relationship historically
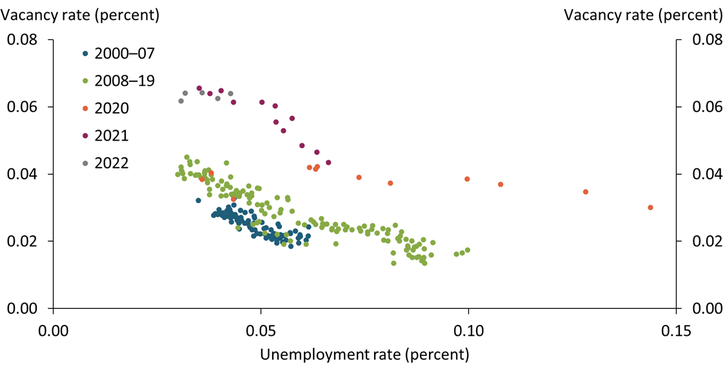
Note: Data are seasonally adjusted.
Sources: Bureau of Labor Statistics (Haver Analytics), Current Population Survey (CPS), and authors’ calculations.
Recently, some observers have proposed that this historical relationship may not hold in the current economic environment, when unemployment is extremely low (see, for example, Figura and Waller 2022). In particular, they have suggested that the Beveridge curve may steepen at very low unemployment rates. In this case, moderation in heightened demand for goods and services post-pandemic lockdowns could decrease job vacancies to more normal levels without a large increase in the unemployment rate.
However, the aggregate labor market data shown in Chart 1 do not strongly support this idea. Historically low unemployment rates in 2019 (green dots) did not meaningfully steepen the Beveridge curve—instead, it remained largely linear. Although the curve shifted at the onset of the pandemic in 2020, the relationship between unemployment and vacancies has remained fairly linear. The orange dots show that the Beveridge curve flattened slightly and shifted to the right in 2020, meaning the unemployment rate was higher at any given level of job vacancies. Since 2021, the labor market has moved along this “shifted” Beveridge curve: vacancies have risen to very high levels, while the unemployment rate has commensurately fallen and reached historical lows (purple and gray dots)._ Overall, despite shifts in the curve, the general relationship between vacancies and unemployment appears linear across all time periods.
Data from individual sectors also broadly support a linear relationship between vacancies and unemployment, even at low levels of unemployment rates. Chart 2 illustrates the Beveridge curve in the transportation and utility sector, an industry severely affected by the pandemic. Despite parallel shifts and changes in the slope of the curve across time, the Beveridge curve is linear within each “trough-to-peak” business cycle. This pattern is typical of many other sectors.
Chart 2: Beveridge curves are linear in the transportation and utility sector
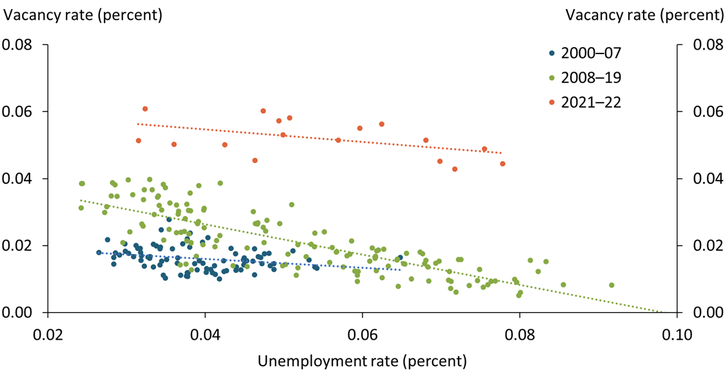
Note: Data are seasonally adjusted.
Sources: Bureau of Labor Statistics (Haver Analytics), CPS, and authors’ calculations.
One exception is the professional and business services sector, in which the Beveridge curve steepened for a short period during the 2000–07 business cycle. The blue line in Chart 3 shows that vacancies in the professional and business service sector declined significantly during this period, while sectoral unemployment increased only modestly. However, this period of “steepness” lasted only from 2001 through 2002; afterward, the Beveridge curve returned to a much more linear shape. Thus, a steepening Beveridge curve at low unemployment rates does not appear to be the norm at the sectoral level.
Chart 3: Beveridge curve steepened in the professional and business services sector for a short period
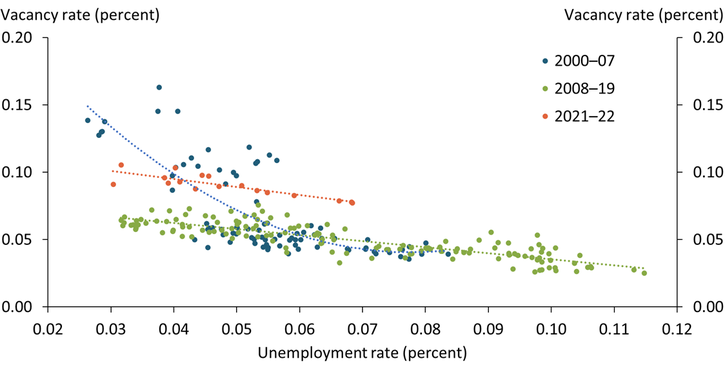
Note: Data are seasonally adjusted.
Sources: Bureau of Labor Statistics (Haver Analytics), CPS, and authors’ calculations.
Although Charts 1 through 3 focus on the employment effect, a slowdown in vacancies is also likely to weigh on wage growth in the future. Chart 4 shows a positive relationship between wage growth and the vacancy-to-unemployment ratio (a measure of labor market tightness) over the periods we examine._ Despite some unique features of the pandemic recovery, the relationship between wage growth and labor market tightness since 2021 looks remarkably similar to the 2012–19 period. In the years preceding the pandemic, a tighter labor market with a higher vacancy-to-unemployment ratio was associated with higher wage growth (orange line). This trend has continued as the pandemic has waned (purple line). The record-high vacancy-to-unemployment ratio since the pandemic recession has raised wages at a pace consistent with the relationship between wage growth and tightness during the 2012–19 recovery period. Thus, if vacancies slow and wage growth responds in a manner consistent with the historical relationship since 2012, then this would constitute a benign or soft-landing scenario for wage growth—a decline in overall economic activity without a substantial cost for workers.
Chart 4: Wage growth and the vacancy-to-unemployment ratio are correlated during normal times, but the relationship falters at the onset of recessions
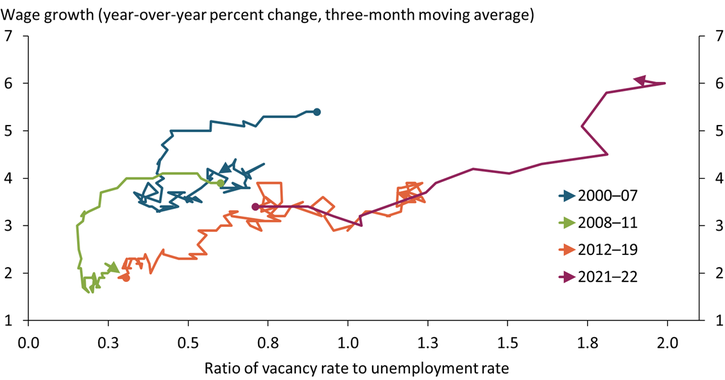
Sources: Federal Reserve Bank of Atlanta, Bureau of Labor Statistics (Haver Analytics), and authors’ calculations.
Although the decreased demand for labor could lower inflationary pressures, whether a slowdown in the labor market will lead to a smooth decline in wage growth remains to be seen. During recessions, wage growth typically experiences a sharp decline. Chart 4 shows that during the periods that include the 2001 recession (blue line) and the 2008 financial crisis (green line), wage growth abruptly declined even though the vacancy-to-unemployment ratio did not move much. Because changes in wage growth often lag changes in vacancies, where the labor market will ultimately settle is highly uncertain._
Overall, with economic growth slowing, firms will likely scale back vacancy postings. Although the pandemic created some unusual labor dynamics, data since 2000 suggest that regular historical patterns continue to hold. Thus, a notable decline in job postings will likely coincide with an easing of tightness in labor market, which could dampen inflation but also slow wage growth and raise the unemployment rate.
Endnotes
-
1 For a primer on the Beveridge curve, see Yashiv (2008) and Elsby, Michaels, and Ratner (2015).
-
2 The labor market has evolved quickly during the recovery from the pandemic. Indeed, through mid-2021 it appeared as if the Beveridge curve had steepened, as vacancies rose but the unemployment rate was somewhat sluggish to react (see Lubik 2021). However, between mid-2021 and the present, the unemployment rate has fallen and is now more in line with the level of vacancies, undoing some of this steepening.
-
3 We use the compositionally adjusted measure of wage growth from the Federal Reserve Bank of Atlanta’s Wage Growth Tracker, rather than wage measures that are not adjusted compositionally (such as average hourly earnings).
-
4 Wage growth is slower to respond because changes in wage contracts tend to be more sluggish (often done at predetermined periods) compared with vacancies, which are easier to adjust.
References
Elsby, Michael W. L., Ryan Michaels, and David Ratner. 2015. “External LinkThe Beveridge Curve: A Survey.” Journal of Economic Literature, vol. 53, no. 3, pp. 571–630.
Figura, Andrew, and Chris Waller. 2022. “External LinkWhat Does the Beveridge Curve Tells Us About the Likelihood of a Soft Landing?” Board of Governors of the Federal Reserve System, FEDS Notes, July 29.
Lubik, Thomas A. 2021. “External LinkRevisiting the Beveridge Curve: Why Has It Shifted So Dramatically?” Federal Reserve Bank of Richmond, Economic Brief, no. 21-36, October.
Yashiv, Eran. 2008. “External LinkBeveridge Curve,” in Steven N. Durlauf and Lawrence E. Blume, eds., The New Palgrave Dictionary of Economics. London: Palgrave Macmillan.
Huixin Bi is a research and policy officer, Chaitri Gulati is an assistant economist, and José Mustre-del-Río is a research and policy officer at the Federal Reserve Bank of Kansas City. The views expressed are those of the authors and do not necessarily reflect the positions of the Federal Reserve Bank of Kansas City or the Federal Reserve System.
Authors

Huixin Bi
Research and Policy Officer