The Nebraska economy recovered quickly in 2021, but steadied through early 2022 as risks to the outlook intensified. Economic output in the state expanded robustly in 2021 alongside broad strength across many sectors and particularly strong conditions in the agricultural economy. Incomes for Nebraskans also increased in the past year and employment throughout the state continued to grow steadily in recent months. The unemployment rate reached an all-time low in May and labor markets have tightened further, boosting wages. Underlying conditions for Nebraska households and businesses were strong through the first part of 2022 and economic activity remained firm, but persistently high inflation continued to pressure the economy and remained a key risk to the outlook.
A Strong Foundation in Early 2022
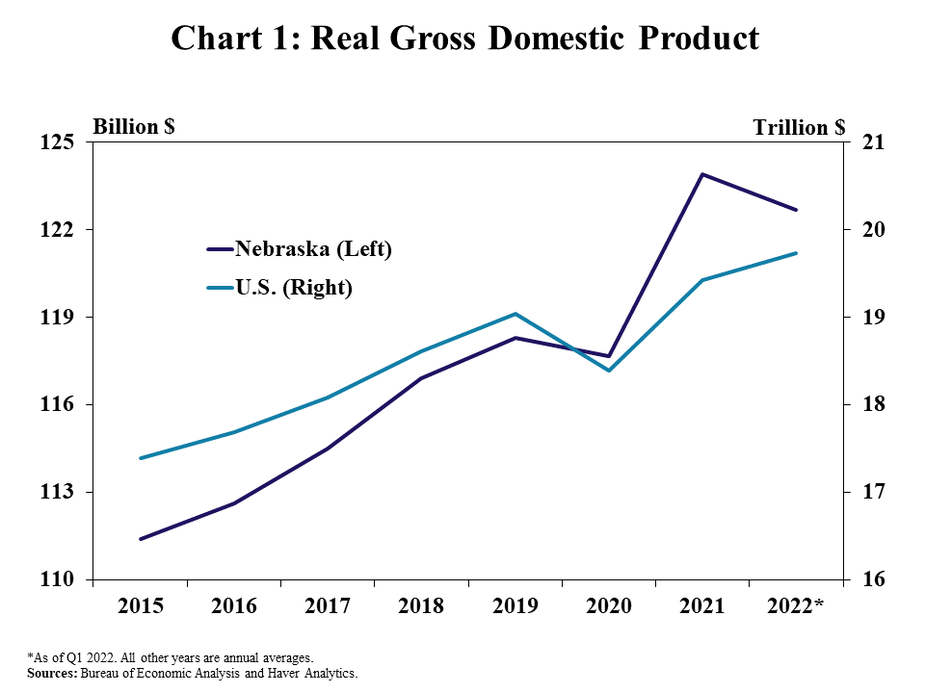
Economic growth in Nebraska rebounded in 2021 following a downturn in 2020. The gross domestic product (GDP) of Nebraska grew at the fastest pace in 10 years during 2021 and recovered from a decline following pandemic related disruptions in 2020 (Chart 1). Output stabilized through the first quarter of 2022, but remained about 4% above 2020, which is an average annual growth rate of about 2%.
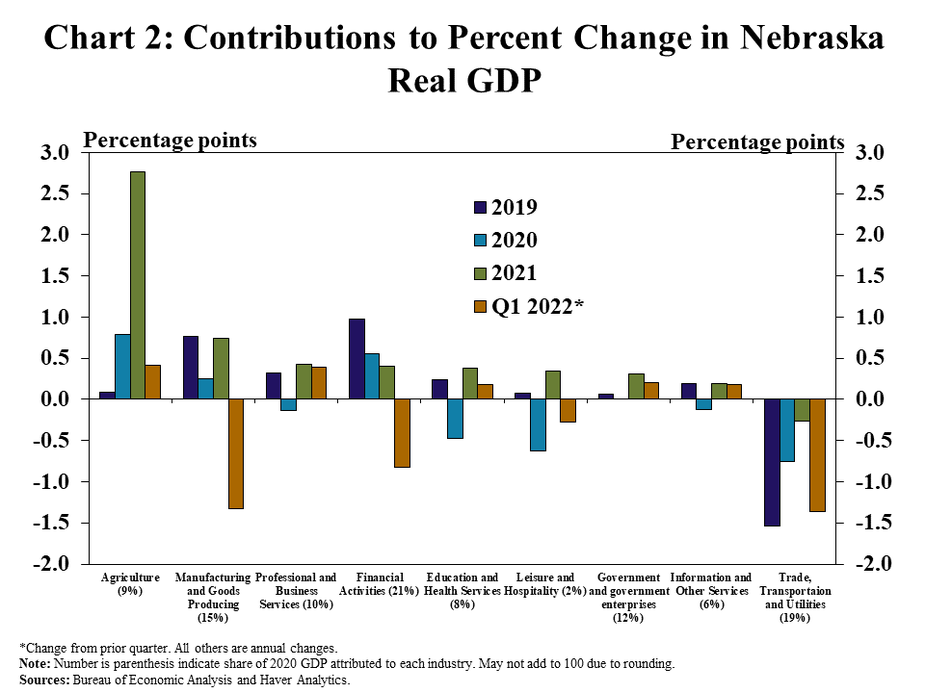
The growth in activity in 2021 was driven by expansion in many industries and notable strength in agriculture. Alongside broad strength in the U.S. farm economy, the agricultural sector accounted for half the overall increase in Nebraska GDP during 2021 (Chart 2). Output also increased across all major industries last year except trade, transportation and utilities. Expansion in manufacturing was notable over the prior year, but pulled back slightly along with financial activities and leisure and hospitality in the first quarter of 2022.
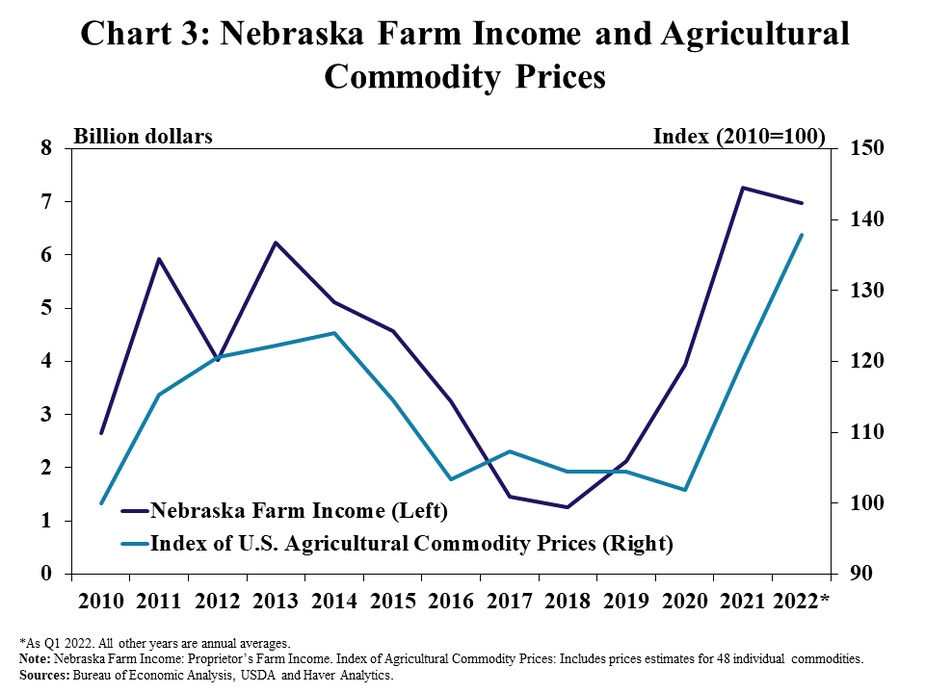
The strength in the agricultural economy was driven by a sharp increase in commodity prices that supported farm incomes. Agricultural prices surged in 2021 alongside robust global and domestic demand for farm-related products, increasing nearly 20% from the prior year and remaining elevated into 2022 (Chart 3). Domestic consumption of farm products remained strong alongside gains in the U.S. economy and U.S. agricultural exports increased notably. In addition to high prices, production of key commodities in the state also was strong, further boosting revenues for producers and supporting farm incomes.
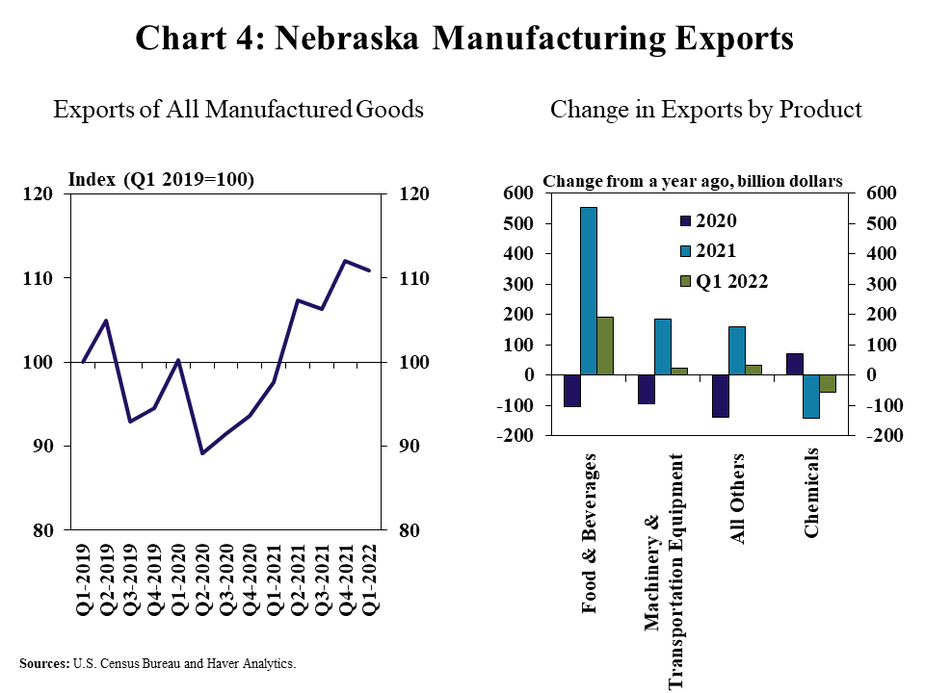
Export demand for Nebraska manufacturing goods, particularly food products, also supported economic activity. After declining at the onset of the pandemic and remaining subdued throughout 2020, exports of goods manufactured in the state rebounded notably in 2021 and remained strong through early 2022 (Chart 4, left panel). A substantial portion of the growth in activity was driven by an increase in food and beverage products, as well as machinery and equipment, which both rose by about 20% in 2021 (Chart 4, right panel). Exports of nearly all other major products also increased during the last year, with the exception of chemicals.
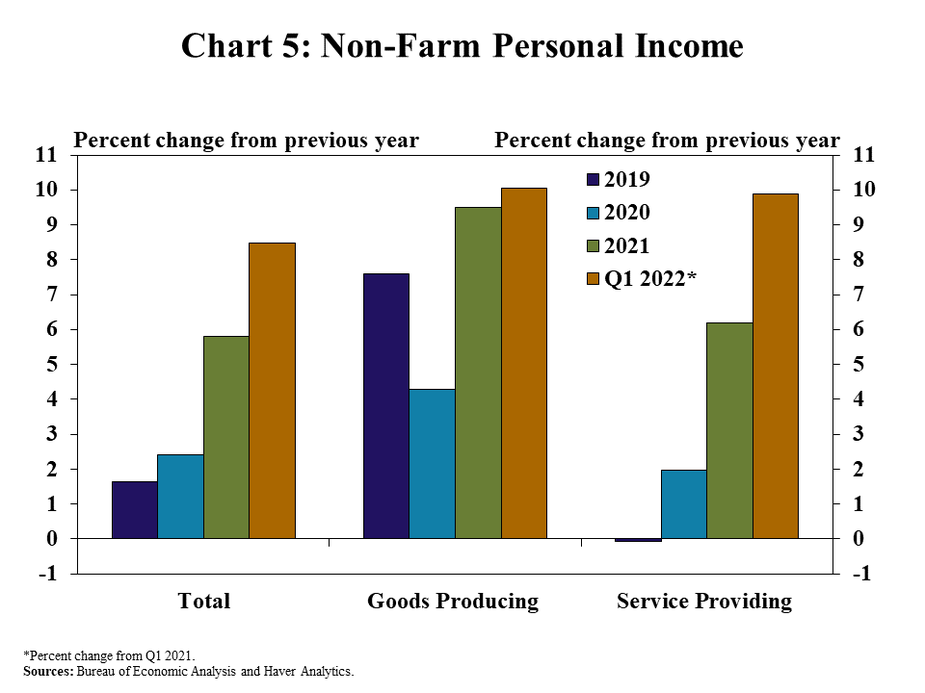
Alongside sound economic conditions in the state, personal income in Nebraska grew substantially. Incomes of those working in both the goods and services sectors increased nearly 10% and 6%, respectively, in 2021 and remained high in the first quarter of 2022 (Chart 5). Income growth was supported by strength in broad economic conditions throughout the state, but supplemental income support through fixed federal enhancements to unemployment insurance boosted incomes in 2020 and 2021. In addition, income growth in Nebraska’s regional hubs has been particularly robust alongside ties to agriculture in surrounding rural areas.
Employment and Wages
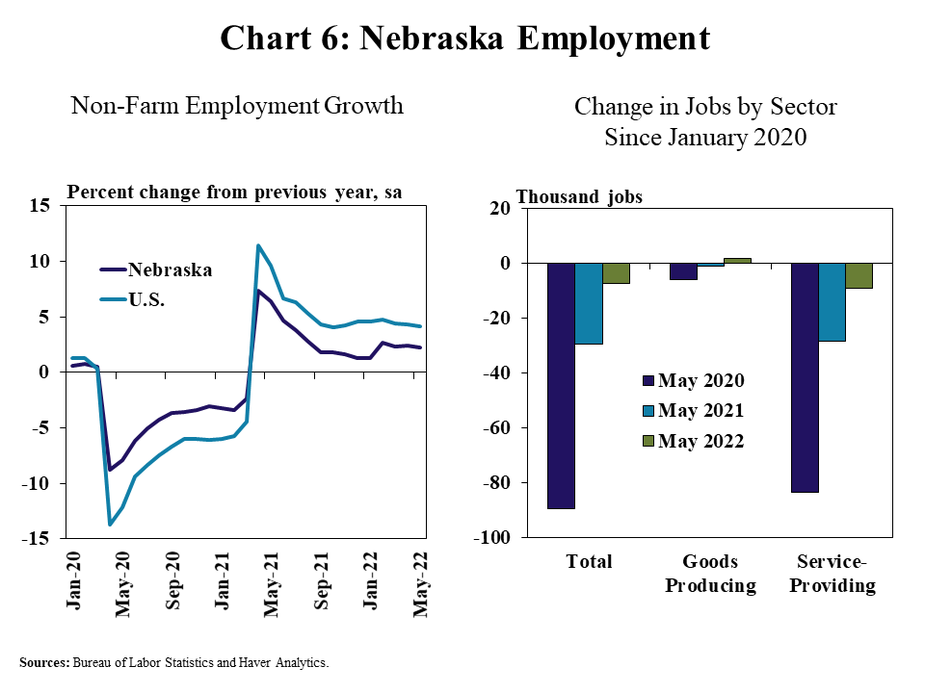
Employment in the state grew alongside economic activity in 2021, and also continued to increase at a steady pace into early 2022. Non-farm employment in the state grew at an average pace of about 2% in 2021 and continued to increase at a similar rate through May (Chart 6, left panel). The pace of growth in additional jobs was lower than the nation, but job losses in 2020 were also less pronounced in Nebraska. Compared with the months before the pandemic there were only about 7,000 fewer jobs in the state and all of those jobs were concentrated in the services sector, which has been more substantially impacted by conditions during the pandemic (Chart 6, right panel).
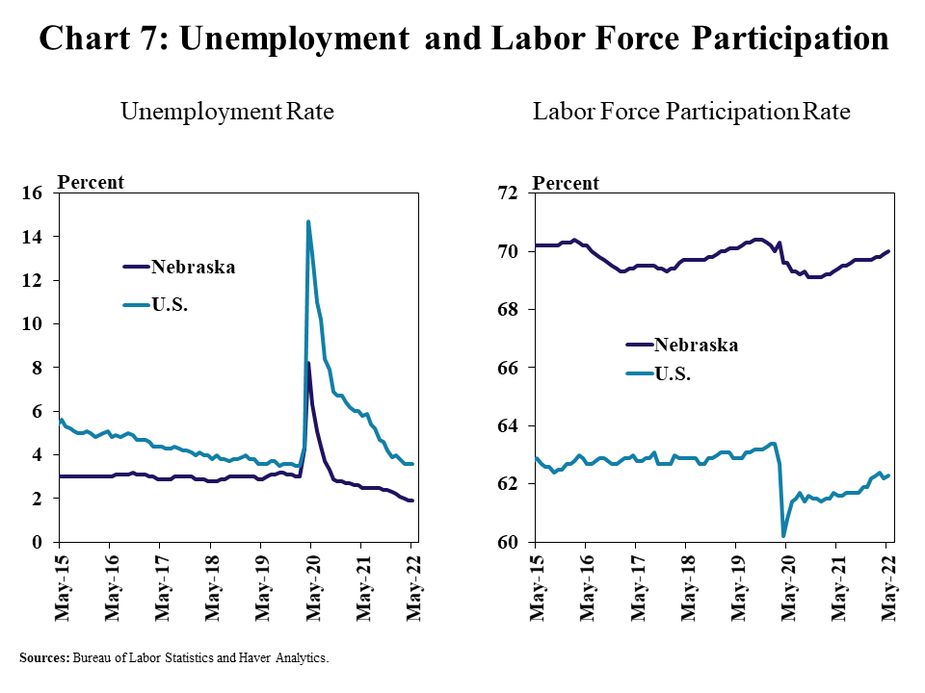
With consistent job growth, the prevalence of unemployment fell to a historic low in recent months. The unemployment rate in Nebraska fully rebounded following a drastic spike during the pandemic and reached an all-time low in May (Chart 7, left panel). The quick recovery was driven by both gains in new jobs and a slight reduction in labor force participation compared with the months prior to the pandemic (Chart 7, right panel). The rate of unemployment in Nebraska continued to be lower than the national average, but participation in the labor force remained less than before the pandemic and has rebounded more gradually in Nebraska than the nation.
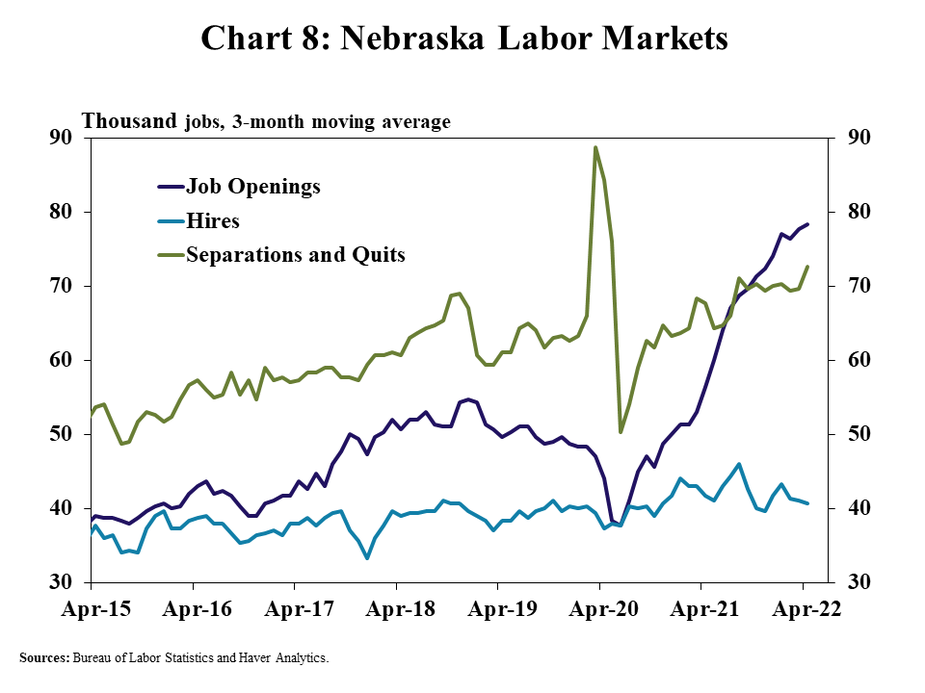
The combination of low unemployment and reduced labor force participation continued to limit workforce availability. The average number of job openings in Nebraska during the first quarter of 2022 was about 40% higher than the same time a year ago, while the number of separations and quits grew only 10% (Chart 8). Despite rapid growth in openings, the increase in the number of hires remained limited.
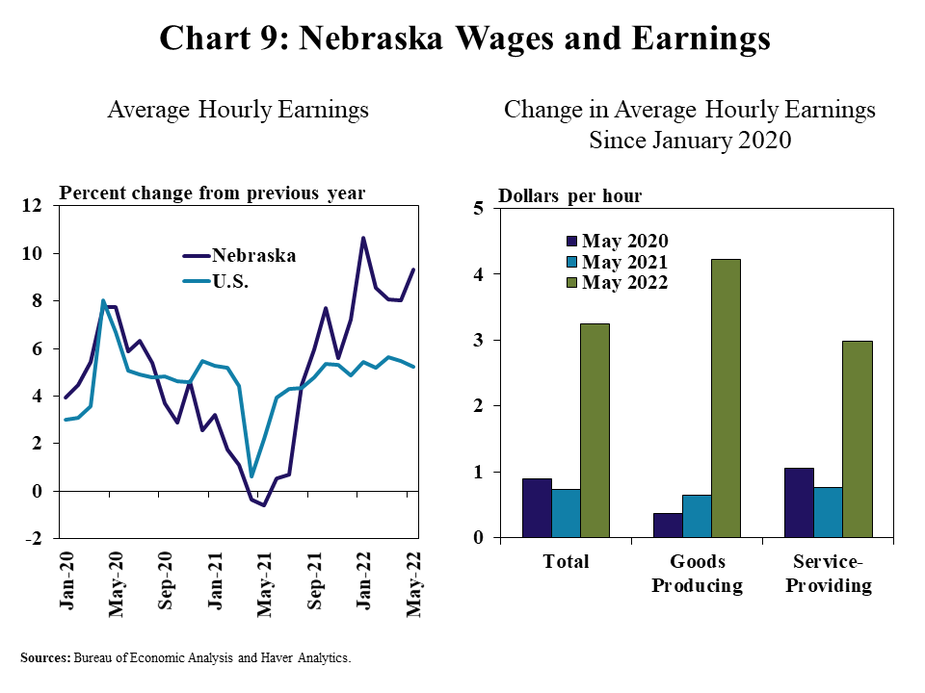
Strong competition for labor drove an increase in workers’ wages. Average hourly earnings have grown notably in recent months, increasing by an average of about 9% during the first quarter of the year, slightly faster than the nation (Chart 9, left panel). The increase in wages was consistent across both the goods and services sectors and, as of May, Nebraskans were earning over $3 more per hour than the months prior to the pandemic (Chart 9, right panel).
Intensifying Headwinds
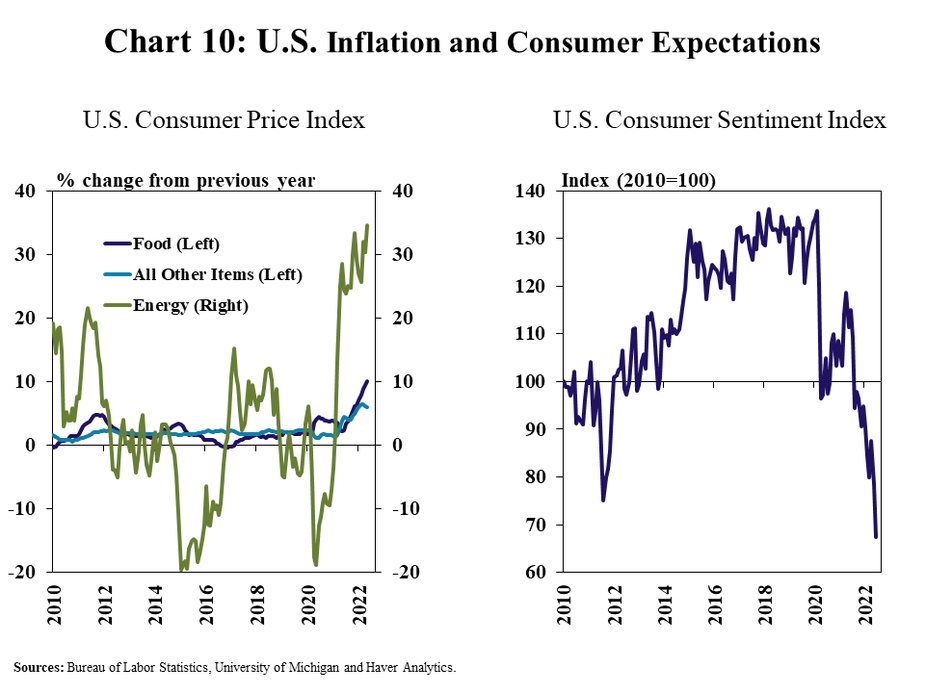
Persistently high inflation has been one of the most significant economic headwinds in recent months. After beginning to rise sharply in mid-2021, the overall consumer price index continued to surge in 2022, increasing by 8.6% from a year ago in May (Chart 10, left panel). As higher inflation has lingered, sentiment related to current and future economic conditions has weakened considerably (Chart 10, right panel). The continuation of broad inflationary pressures has strained household budgets, particularly the lowest income households that have less disposable income and typically spend a higher share of overall income on staple items such as food and energy.
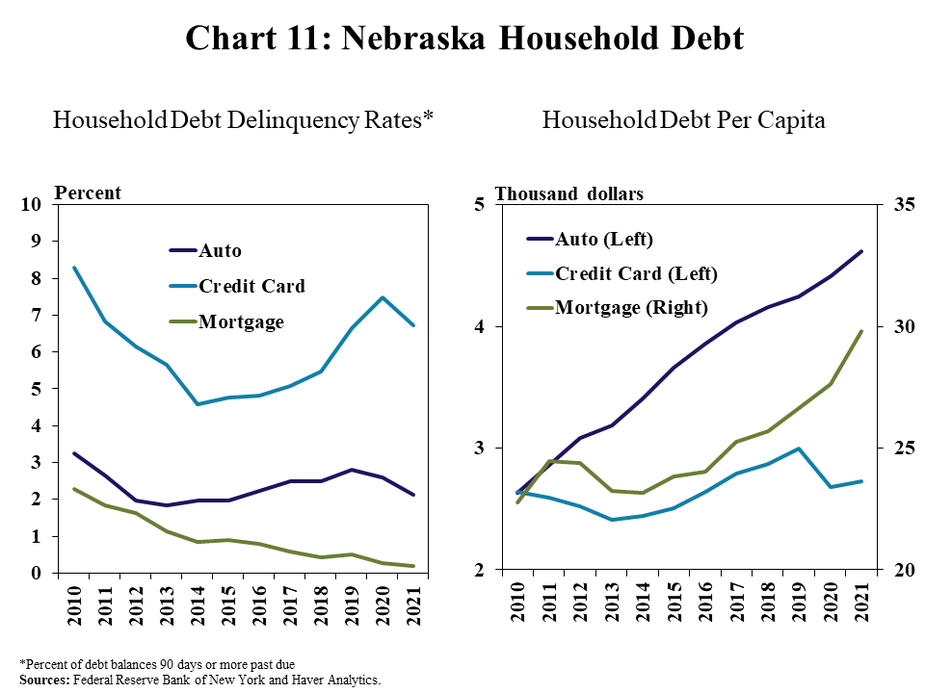
Although household debt repayment improved alongside strong incomes in 2021, increases in some types of debt could also strain household finances if the recent trend continues. Delinquency rates on all major types of debt declined in 2021, with mortgage delinquencies reaching an all-time low (Chart 11, left panel). Credit card debt per household remained at a 5-year low over that time, but mortgage and auto debt increased to record highs and increased overall expenses for many Nebraskans (Chart 11, right panel). A key factor contributing to higher debt balances was a surge in home prices amid strong demand and limited supplies, and the cost of automobiles also increased sharply in 2021. Higher home prices may be beneficial for current homeowners, but the rapid increase in prices has intensified challenges of affordability for many low-income communities.
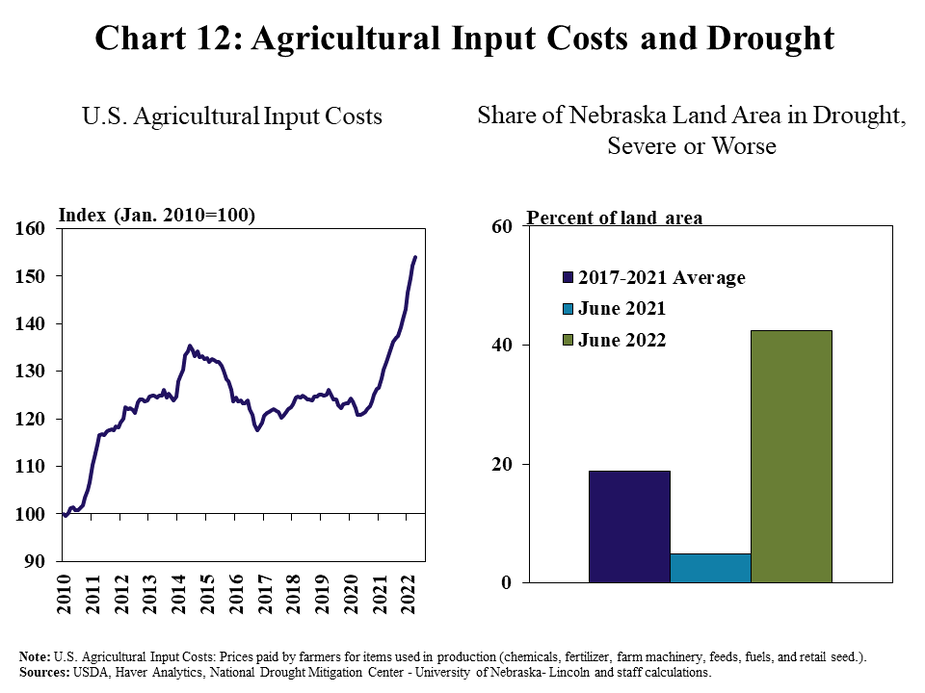
The agricultural sector remained strong and continued to support the Nebraska economy, but could face pressures from rising production costs and drought. Higher agricultural commodity prices continued to support farm revenues, but input costs also have increased sharply in recent months and could limit producer profits going forward (Chart 12, left panel). In addition, more than 40% of Nebraska land area was in severe drought, which could hinder incomes for producers most directly impacted (Chart 12, right panel).
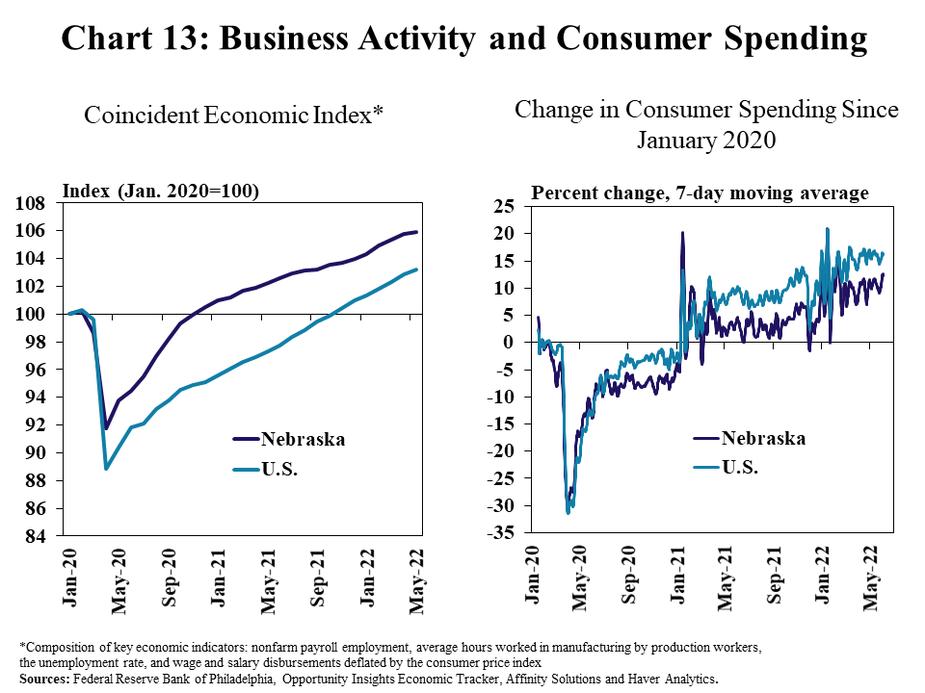
Despite broad inflationary pressures and intensifying headwinds, economic activity and consumer spending in Nebraska remained firm through the first half of 2022. Key economic indicators in the state were strong through May, with broad measures of activity remaining well above pre-pandemic levels and the nation (Chart 13, left panel). Consumer spending also continued to support economic conditions, with total spending in the state about 12% higher than in early 2020 (Chart 13, right panel).
Conclusion
High and far-reaching inflation has directly impacted households and businesses in recent months, resulting in pessimistic expectations about economic prospects in the year ahead. Despite the headwinds, Nebraska businesses continued to seek new employees at a record pace, while consumer spending and overall economic activity remained strong. Though some risks may have intensified, Nebraska’s economy has appeared to be well-positioned through mid-2022 as it faces uncertain growth prospects in the second half of the year.
The views expressed are those of the authors and do not necessarily reflect the positions of the Federal Reserve Bank of Kansas City or the Federal Reserve System.
Authors

Nate Kauffman
Senior Vice President, Economist, and Omaha Branch Executive; Executive Director of the Center for Agriculture and the Economy
