Overall economic growth in Oklahoma continued to expand in the fall of 2014. Payroll employment in the state was up 2.2 percent (over 36,000 jobs) from a year ago in October, significantly higher than the 0.8 percent growth this time last year (Chart 1). National payroll employment grew 1.9 percent from the previous year. Employment growth in the Oklahoma City metro area continued at a solid pace with close to 20,000 jobs being added year-over-year (3.2 percent). Tulsa added approximately 7,600 jobs in the same time (1.8 percent), and at last reached pre-recession employment levels. Energy jobs grew 4.2 percent, the fastest rate in the state, adding more than 2,600 jobs since last year. Other industries with solid year-over-year employment growth were manufacturing, education and health services, and leisure and hospitality. Information-related jobs, however, continued to contract.
Chart 1: Payroll Employment Growth Through October 2014; Seasonally Adjusted
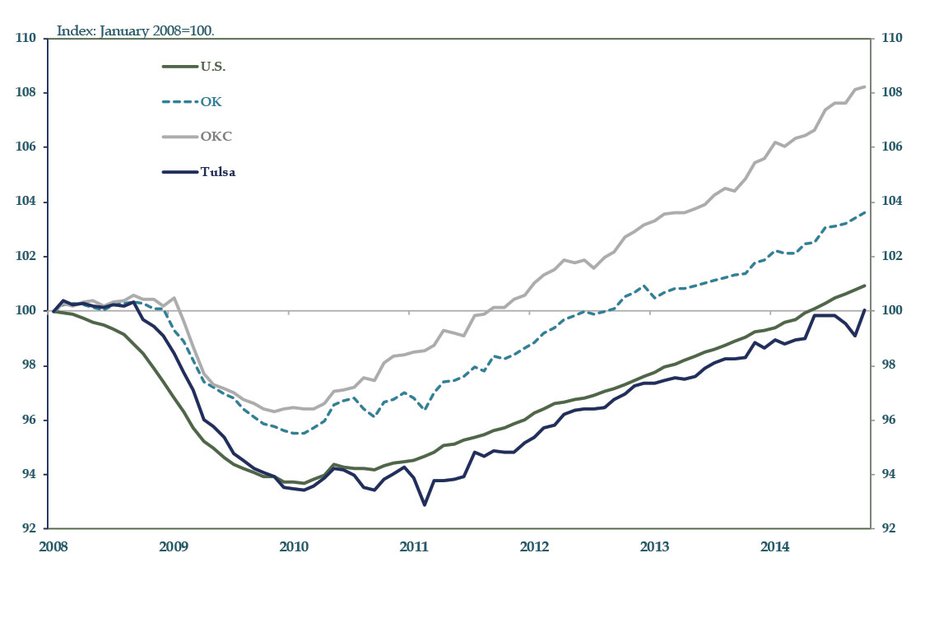
Oklahoma’s unemployment rate of 4.5 percent is 11th lowest in the nation. The unemployment rate in Oklahoma City decreased further in September (the latest data available) to 4.2 percent, while the Tulsa jobless rate inched down to 4.6 percent. Across the state, most counties posted marginally lower or flat unemployment rates and only six counties saw slight increases. Statewide, the labor force increased slightly for a second consecutive month in October, likely indicating that workers are more encouraged about finding employment, reversing a downward trend that began in March.
Update provided by Megan Williams, associate economist and manager, and Elena Ojeda, research associate, at the Kansas City Fed, Oklahoma City Branch.
Spotlight on...Occupational Data for Oklahoma's Fastest Growing Industries
Employment in Oklahoma has grown over the past year. Occupational data for the top job producing industries can give a better understanding of the standard of living of those workers. Specifically, wage differentials show how local wages in these fastest growing industries compare to those in other areas.
Nonmetro Oklahoma
Manufacturing has grown 5.2 percent since last year outside of Oklahoma’s metro areas. In most of these areas, welders make up the biggest occupation among production jobs. Average hourly wages in 2013 for welders varied somewhat across the state, from $14.52 in southeastern Oklahoma to $18.83 in northwestern Oklahoma.
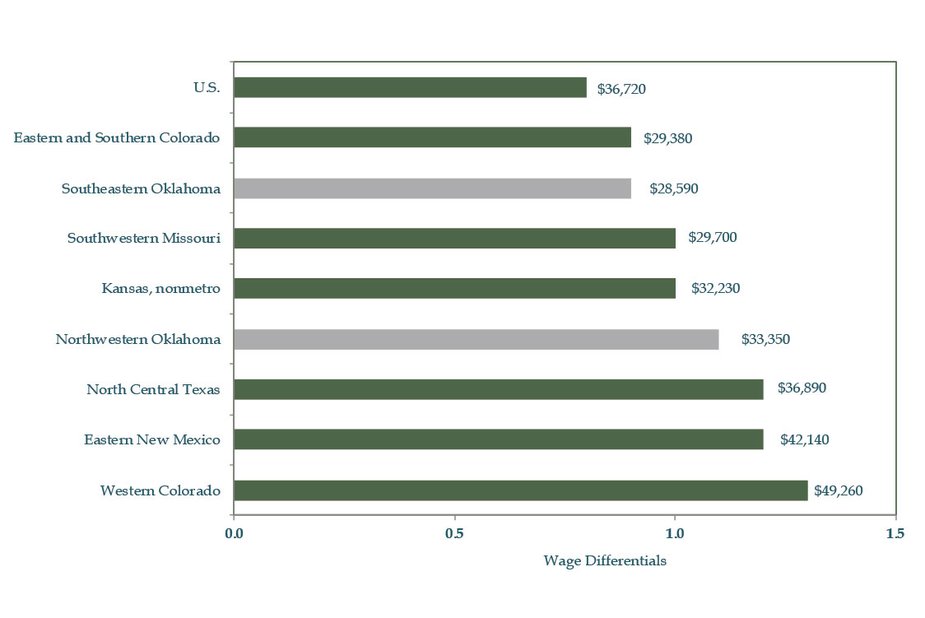
Wage differentials also varied, with welders in southeastern Oklahoma earning less of a wage premium than those in the northwestern area (Chart 5). Comparing local wages to selected nonmetro portions of nearby states shows a similar story. Average wages for welders in the eastern and southern nonmetro areas of Colorado were $15.54 per hour. Actual wages were higher than those in southeastern Oklahoma, but the wage differential was the same, so welders in both areas enjoy the same premium over average local wages. However, welders in western Colorado, eastern New Mexico and north central Texas earned a higher actual wage and wage premium than all local welders. The wage differential for welders in Kansas and southwestern Missouri was exactly 1, meaning they earned the average wage for all occupations in their respective areas. In comparison to Oklahoma welders, they earned less than those in northwestern Oklahoma but more than those in southeastern Oklahoma. Actual wages in southeastern Oklahoma were lower than the national average, $14.52 versus $18.80, but they earned a slightly higher wage premium. Welders in northwestern Oklahoma earned a bit more than the national average at $18.83, but earned more according to the wage differential of 1.1.
Oklahoma City Metro
Construction employment in October was up 11.7 percent year-over-year in the Oklahoma City metro. Within the construction sector, laborers form the largest occupation. The wage differential for construction laborers in the OKC metro is 0.7, meaning they earned 30 percent less than the average for all occupations in the metro. However, that wage differential is within the range of those across other metro areas and is actually only slightly lower than in the nation (Chart 3).
Employment in Oklahoma has grown 1.4 percent since October 2013, with varied growth by industry across the state. In the Oklahoma City metro, the fastest-growing industry has been construction, while the energy industry has posted the top growth in Tulsa (Chart 2). The rest of the state has seen strong growth in manufacturing employment. The different wage patterns in these industries can have varying effects on local economies. Occupational data for the top job producing industries can give a better understanding of the standard of living of those workers. Specifically, wage differentials—the ratio of occupational wages to average pay for all occupations in a specific area —show how local wages in these fastest growing industries compare to those in other areas.
As shown through the use of wage differentials, occupational wages in some of Oklahoma’s fastest growing sectors compare favorably with those in other nearby states when accounting for overall average wages. This is good news for workers in these occupations across the state and for their local economies.
Chart 2: Employment Growth by Industry October 2014
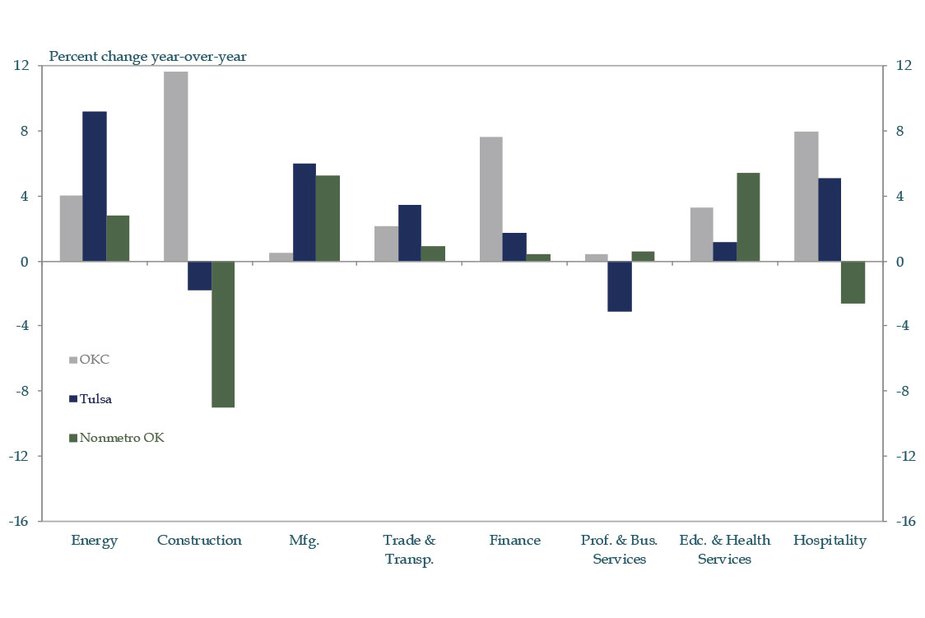
Chart 3: Wage Differentials for Construction Laborers 2013 AVERAGE with annual median wage
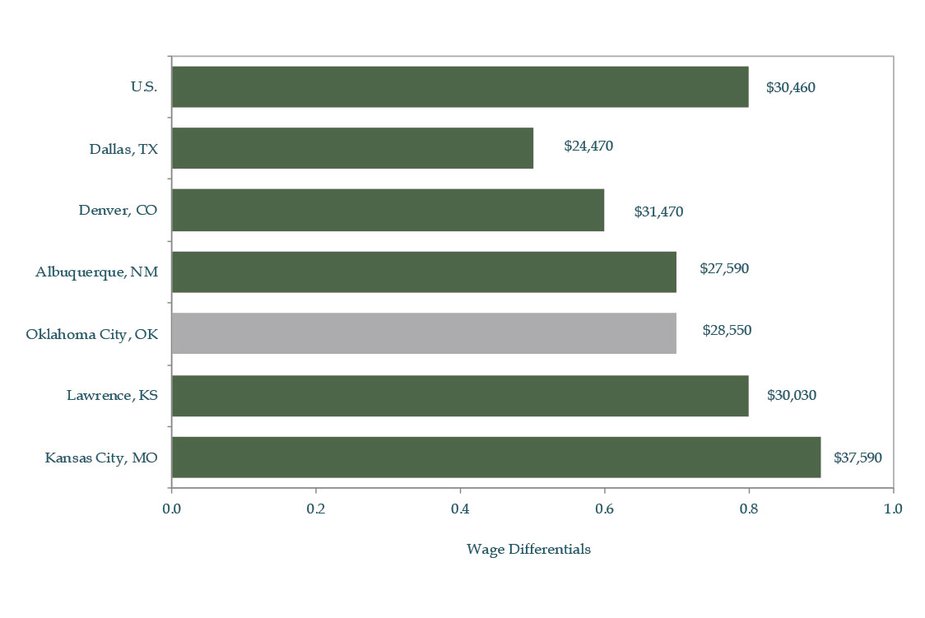
In comparison to other metro areas, Oklahoma City construction laborers were among the top earners in 2013 when accounting for differences in average wages across metros. For example, when comparing actual wages, construction workers in Denver earned more per hour than those in Oklahoma City, $15.50 versus $14.26. However, Oklahoma City construction laborers earned more of a wage premium than their Denver counterparts, as shown by the higher wage differential. Local construction laborers also earned more than those in the Dallas metro, while Albuquerque construction workers earned a similar wage to those in Oklahoma City. Some of the neighboring areas where construction laborers earned a higher wage premium than Oklahoma City were the Lawrence, Kan., and Kansas City metros. Actual wages in Lawrence were $12.87 per hour, less than in Oklahoma City, but the wage differential was higher at 0.8.
Chart 4: Wage Differentials for Petroleum Engineers 2013 Average with annual median wage
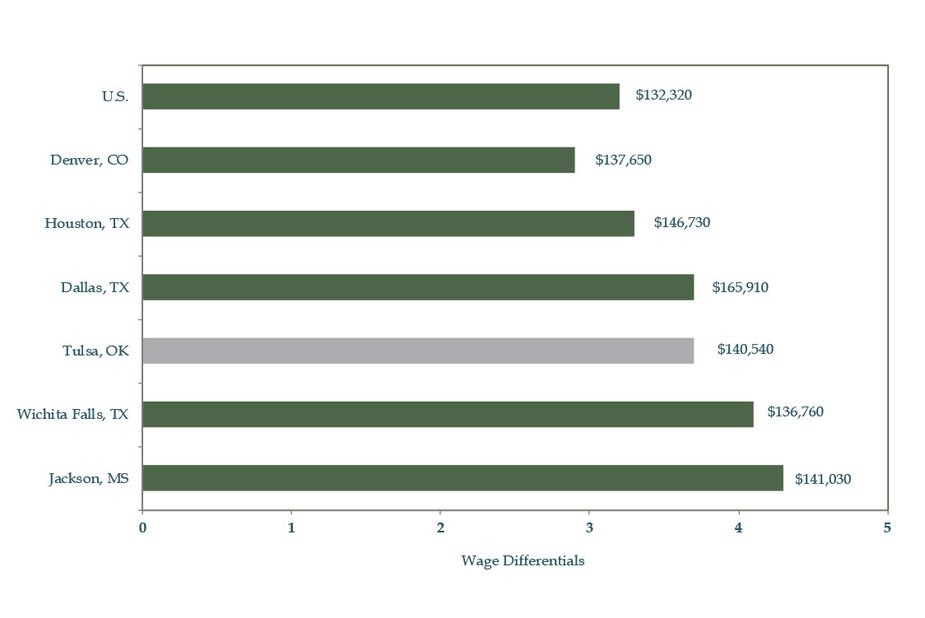
Chart 5: Wage Differentials for Welders 2013 Average with annual median wage
Tulsa Metro
The fastest growing industry in the Tulsa metro this year has been mining (energy), which has grown 9.2 percent over the last year. Within this sector, petroleum engineers are one of the largest energy-related occupations in the Tulsa metro.
In 2013, Tulsa petroleum engineers earned 3.7 times the amount earned by the average worker in the Tulsa metro. In comparison to the wages earned by petroleum engineers in other metro areas, wage differentials show that those in Tulsa fell near the middle. In Dallas, petroleum engineers earned $86.08 per hour in 2013 while their counterparts in Tulsa earned $74.84 per hour. However, even though the actual pay earned by petroleum engineers in Dallas and Tulsa is vastly different, their wage premiums were similar (Chart 4). Petroleum engineers in Wichita Falls, Texas, however, earned a higher wage premium than those in Tulsa. The average hourly wage was $69.39 per hour, less than the Tulsa average, but with a wage differential of 4.3, Wichita Falls petroleum engineers earned more relative to average pay for all workers in the area. In contrast, petroleum engineers in Denver earned much less than those in Tulsa. The wage differential for Denver was 2.9, even though the actual pay was only slightly less than in Tulsa at $72.84 per hour.
Ask An Economist: What Price Do Oil Producers in our Region Need to Remain Profitable?
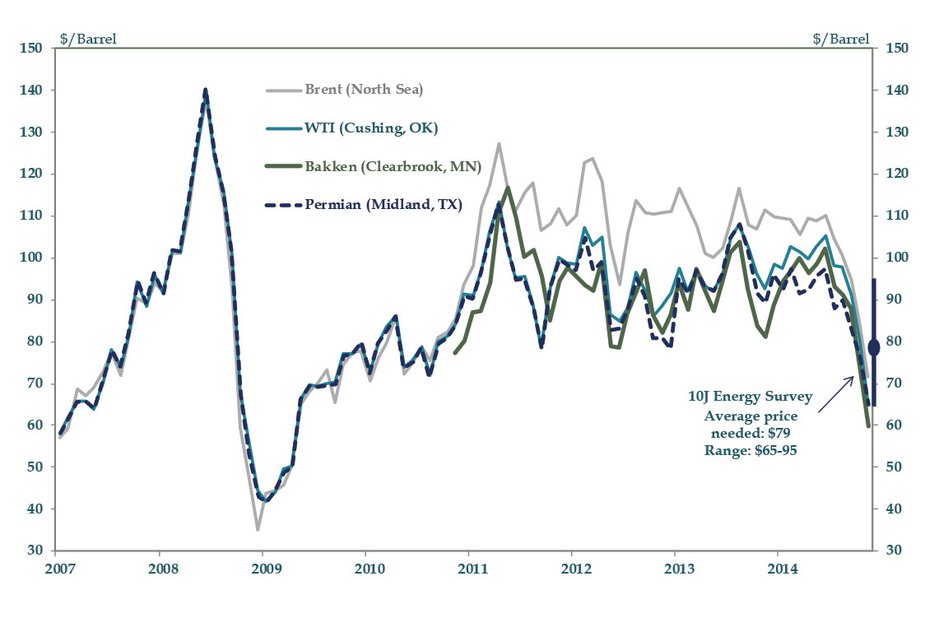
Since June 2014, crude oil prices have fallen more than 30 percent (Chart 6). This is true of the global and U.S. benchmarks (Brent North Sea and West Texas Intermediate (WTI), respectively), as well as regional oil prices in key shale plays in the central United States (such as the Bakken in North Dakota and Permian in West Texas). By late November, domestic prices had fallen below $70 per barrel. In a quarterly energy survey started in 2014 by the Federal Reserve Bank of Kansas City, firms were asked in late September what average price they needed to remain profitable across fields in which they are active. The average price reported across all firms was $79 per barrel. However, responses ranged widely—from $55 to $95 per barrel—based largely on differing production costs across and within plays where firms are active. There was little difference in the reported profitable price across firm sizes, but larger firms on average maintained stronger drilling and capital expenditure plans than smaller firms at that time. Some of these firms reported having hedges that keep their average price relatively high through 2015. Full results of the Kansas City Fed’s energy survey are expected to be released in 2015, once there is enough history to show trends.
Chart 6: Crude Oil Prices by Region January 2007 through November 2014
The views expressed are those of the authors and do not necessarily reflect the positions of the Federal Reserve Bank of Kansas City or the Federal Reserve System.
Author