10th District Energy Overview
The 10th District remained a leading energy producing region over the last decade. Since 2015, the 10th District ranked second among Federal Reserve District’s for fossil fuel production (Chart 1, left panel). While fossil fuel production in the 10th District fell, mostly due to declining coal production in Wyoming (Chart 5, right panel), oil and natural gas production continued growing within the district (Chart 3, right panel).
For renewable energy, the 10th District ranked third among Fed districts. Power generation from renewable sources grew from roughly 14 percent to roughly 37 percent over the last decade (Chart 1, right panel). The shift toward renewable energy was driven primarily by the expansion of wind facilities (purple area) in states like Oklahoma and Kansas – some of the windiest locations in the country (Cowley and Farha 2024, EIA 2024). All-in the 10th District is an energy-abundant region of the U.S., which maintained its importance over the last decade.
Chart 1: The 10th District remained a leader in energy production over the last decade.

Note: The top six of the twelve Federal Reserve Districts by fossil fuel production are shown in each chart. Energy productions measure in the left panel place southern New Mexico in the Dallas Fed District and northern Louisiana in the Atlanta Fed District. We measure the combined production of oil, gas, and coal on a barrel of oil equivalent (BOE) basis.
Source: EIA (Haver Analytics), authors’ calculations
Energy Trade Flows
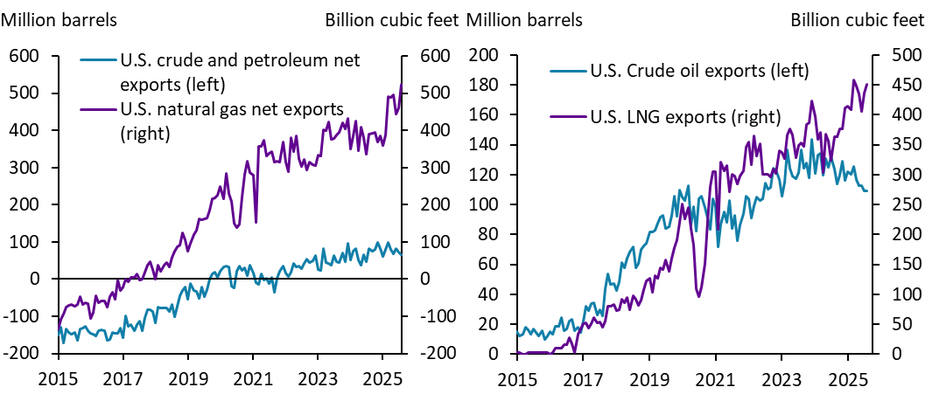
Energy trade flows were a key change in the U.S. energy system in the last decade – the topic for the External LinkFederal Reserve’s 10th Annual Energy Conference._ Growing energy exports were supported by rising production levels (Chart 3 – Panel A) and the U.S. moved from being a net importer to net exporter of energy products over the last decade. The U.S. became a net exporter of natural gas in 2017 (Chart 2, left panel), driven by growing natural gas production and a rapid increase in liquified natural gas (LNG) exports (Chart 2, right panel). The U.S. is now the world’s largest LNG exporter (EIA 2025a). Similarly, the U.S. became a net exporter of petroleum in 2018 (Chart 2, left panel), following the repeal of the crude oil export ban in 2015. The growth in U.S. petroleum exports over the last decade were driven primarily by growing crude oil exports (Chart 2, right panel). The U.S. is now one of the top five crude oil exporting nations globally.
Chart 2: The U.S. Shifted from being a net importer of energy to a net exporter in the last decade.
Note: We measure the combined production of oil and gas on a barrel of oil equivalent (BOE) basis.
Source: EIA (Haver Analytics)
Oil and Natural Gas Production
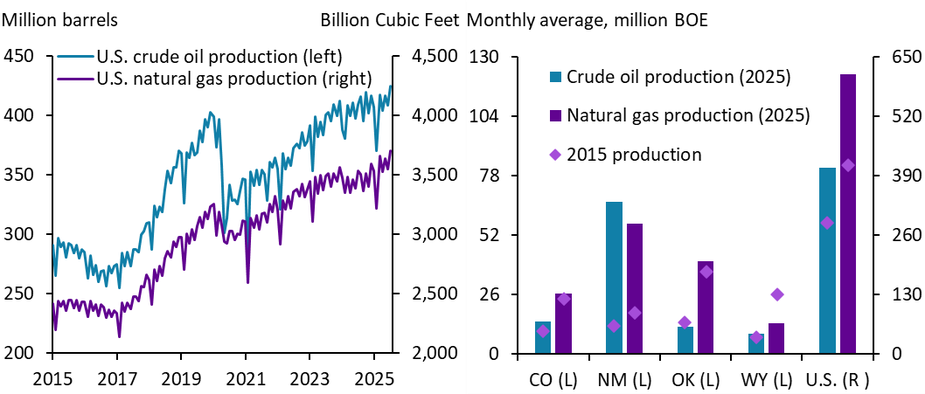
Greater energy exports coincided with rapidly growing domestic energy production over the last decade. U.S. crude oil and natural gas production rose by roughly 50 percent over the last decade (Chart 3, left panel). However, oil and natural gas production growth was mixed across 10th District states in the last decade – New Mexico (Permian Basin) was a notable outlier with oil production growth over 4 times and natural gas production growth roughly 2 times. Colorado had a more modest oil and natural gas production growth – 39 and 9 percent, respectively. Oklahoma witnessed a 12 percent decline in oil production growth and 13 percent increase in natural gas. Wyoming had a 24 percent increase in oil production and 48 percent decline in natural gas production (Chart 3, right panel). Higher oil and gas production growth over the last decade was predominantly concentrated in locations with the greatest productivity gains.
Chart 3: U.S. Crude oil and natural gas production rose steadily over the last decade, but regional production was mixed.
Source: EIA (Haver Analytics)
Drilling Productivity
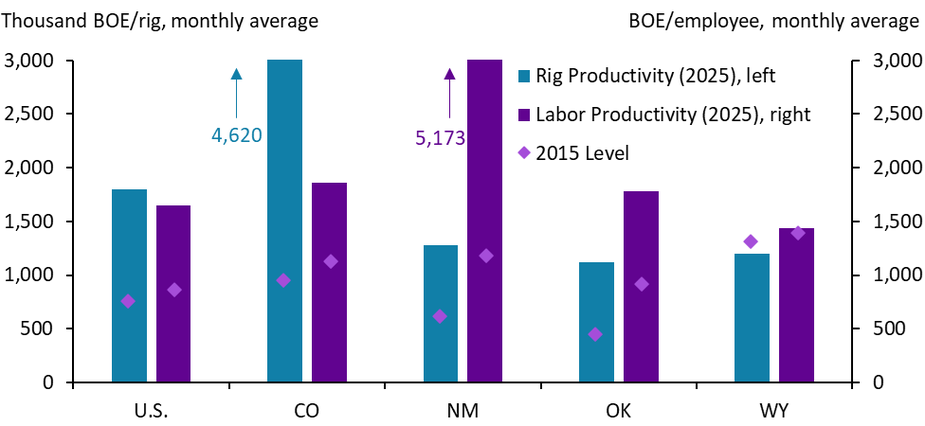
A driving force behind growing oil and gas production levels in the U.S. is a substantial rise in productivity. Chart 4 shows a measure of capital and labor productivity – output per unit input – for oil and gas production by location. Drill rig productivity – the primary form of capital equipment used for extracting oil and gas – more than doubled over the last decade and labor productivity rose by roughly 90 percent._ Drilling productivity changes were mixed across District states: Colorado and New Mexico both saw substantial productivity gains – rig productivity rose 385 percent and 108 percent in CO and NM respectively, while labor productivity rose 64 percent and 336 percent respectively. Oklahoma rig and labor productivity rose by 147 percent and 93 percent. Wyoming witnessed a modest 9 percent decline in rig productivity and 3 percent increase in labor productivity in the last decade.
Chart 4: Oil and gas drilling productivity grew in the U.S. and in most 10th District states.
Sources: EIA, Baker Hughes, BLS (all accessed via Haver Analytics), authors’ calculations
Coal Electricity Generation and Mining Activity
While oil and gas production rose in the last decade, coal declined. Coal electricity generation fell by nearly 50 percent in the U.S. and roughly 40 percent in the 10th District over the last decade. As overall electricity generation capacity grew – driven mostly wind and natural gas – coal as a share of total electricity generation fell by 17 percentage points in the U.S. and 27 percentage points in 10J (Chart 5, left panel). Coal as a share of net electricity generation now makes up only 16 percent of electricity generation for the U.S. and 34 percent for the 10th District. As demand from the power sector subsided, coal mining activity also fell in the last decade. U.S. and 10th District (mostly Wyoming) coal mine production fell by nearly 50 percent in the last ten years (Chart 5, right panel)._
Chart 5: The use of coal for electricity generation and coal production declined.

Note: Coal production in right panel includes bituminous and lignite coal production.
Source: EIA (Haver Analytics), authors’ calculations
Renewable Energy
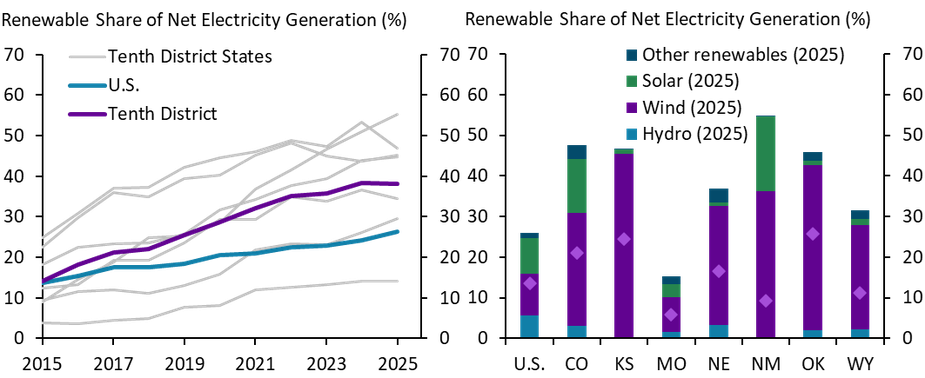
While coal declined in prominence, renewable energy adoption steadily grew over the last decade. Renewable energy generation in the 10th District grew by a little over three-fold and roughly doubled in the U.S., driven by steady growth in wind and more recently greater solar adoption. Consequently, the renewable share of electricity generation grew from roughly 14 percent in the 10th District and U.S. to roughly 37 and 26 percent, respectively (Chart 6, left panel). With rapid expansion in renewable generation over the last decade, most District states now exceed the national average share for renewables, with wind and solar as the primary contributors to the renewable generation mix (Chart 6, right panel).
Chart 6: Renewable sources’ share of electricity generation grew, especially in 10th District states.
Source: EIA (Haver Analytics), authors’ calculations
Conclusion
Over the last decade the 10th District remained a leading energy region in the U.S., even as domestic energy system witnessed several key changes. Oil and natural gas production grew nationally and regionally, driven by rising productivity. Growing domestic oil and gas production helped support energy exports, turning the U.S. into a net exporter of natural gas and petroleum over during that time period. While coal production declined regionally and nationally, renewables rose substantially. The 10th District outpaced the U.S. in renewable energy additions, driven by rapid growth in wind and solar generation. While the U.S. energy system is continually evolving, the 10th District is well poised to retain a leading role in energy in the coming decade.
Endnotes
-
1 The External LinkTenth District covers Colorado, Kansas, Nebraska, Oklahoma, and Wyoming, western Missouri, and northern New Mexico.
-
2 The oil and gas productivity measures presented in this article provide an easily understandable measure of productivity and roughly tracks more sophisticated oil and gas productivity measures (Brown et al., EIA 2025).
-
3 Wyoming makes up nearly 90 percent of Tenth District coal production and roughly one third of total U.S. coal production (Tenth District Economic DataBooks).
References
Brown, Jason, David Rodziewicz, and Colton Tousey. 2019. “External LinkDrilling Productivity in the United States: What Lies Beneath.” Federal Reserve Bank of Kansas City, Economic Bulletin, May 22.
Cowley, Cortney and Chase Farha. 2024. “External LinkHarvesting the Wind: Oklahoma’s Strong Electricity Growth Has Few Agricultural Tradeoffs.” Federal Reserve Bank of Kansas City, Oklahoma Economist, August 30.
Energy Information Agency (EIA). 2024. External Link“Wind Explained: Where is Wind Power Harnessed”, June 12.
Energy Information Agency (EIA). 2025a. “External LinkThe United States remained the world’s largest liquefied natural gas exporter in 2024,” Today in Energy, March 27.
Energy Information Agency (EIA). 2025b. Table 10a: Drilling and Productivity Metrics. External Link“Short-term Energy Outlook (STEO),” October 7.
The views expressed are those of the authors and do not necessarily reflect the positions of the Federal Reserve Bank of Kansas City or the Federal Reserve System.
Authors

Chase Farha
Research Associate II