The industrial composition of the U.S. economy has undergone significant changes over time as new industries emerge and others evolve or diminish in importance. Changing demand for new products and services, technological advancements and international trade all have led to a current economy that looks different from decades ago. Part of this evolution is characterized by the rise of service-providing sectors over the last 40 years and growth in their share of economic output and employment. This issue of the Rocky Mountain Economist explores the growing importance of the services sector in recent decades.
The Rise of the Services Sector
Industries commonly are classified into one of two categories, those that produce goods and those that provide services. Goods-producing industries tend to create a tangible product, and include farming, natural resources (such as logging or fishing), manufacturing, construction and mining. Conversely, service-providing firms offer some sort of service, and include sectors such as finance, real estate, leisure and hospitality, education, health care, retail trade and professional and business services.i The composition of the United States and Rocky Mountain States’ economies over time has shifted from goods-producing sectors to service-providing sectors.
In the early 20th century, a majority of workers in the United States and Rocky Mountain States were employed in goods-producing sectors. In particular, agriculture and manufacturing employed more than 55 percent of U.S. workers in 1920. However, growth in the services sector outpaced that of the goods-producing sector in the following decades and employed the majority of workers by the middle of the 20th century.ii This trend has continued, and over the past four decades the service-providing sectors’ share of total employment in the United States, Colorado and New Mexico has risen significantly (Chart 1). The services sector now employs more than 85 percent of workers in the United States, Colorado and New Mexico and almost 80 percent in Wyoming. The share of employment of goods-producing sectors consistently has been larger in Wyoming due primarily to high levels of employment in the energy sector.
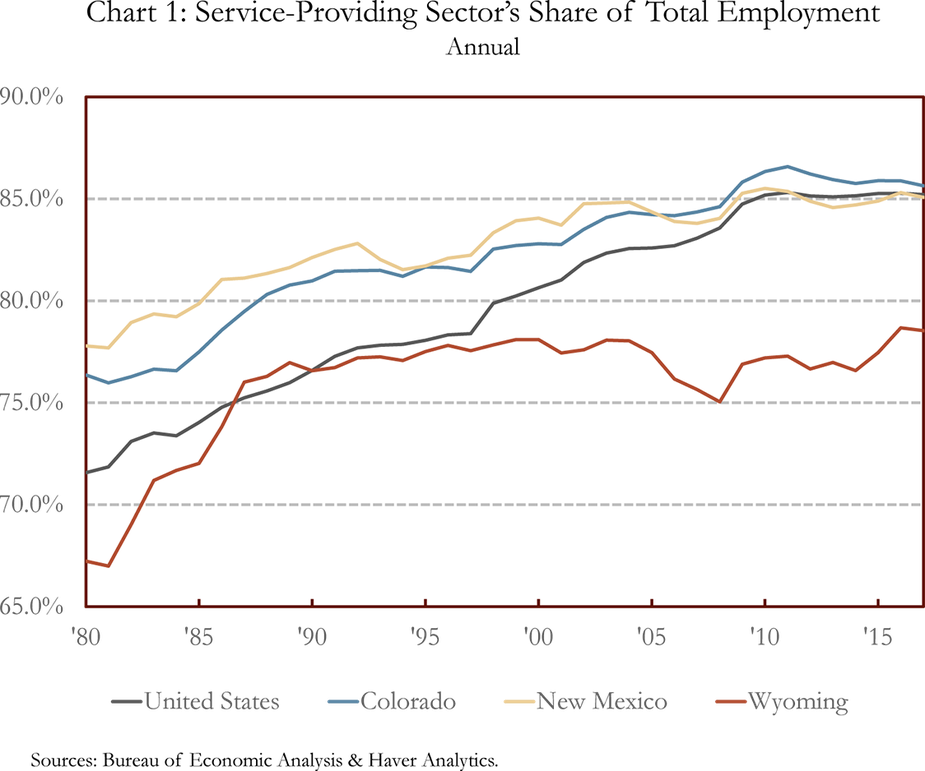
Even as the share of employment in goods-producing sectors has declined, employment in these industries has continued to increase in Colorado and New Mexico. However, the pace of employment growth in the services sector was about four times that of the goods-producing sectors in these states which quickly led to a lower overall share of total employment. Unlike Colorado and New Mexico, the current level of employment in goods-producing sectors in the United States and Wyoming is below 1980 levels, largely due to a decrease in employment in the manufacturing and mining sectors.
Subsectors of the Services-Providing and Goods-Producing Sectors
The composition of industries across the Rocky Mountain States varies, although there are some similarities. Within the goods-producing sectors, the manufacturing sector employed the largest share of U.S. workers in February 2019, while the construction sector employed the largest share in each of the Rocky Mountain States (Chart 2). Looking to 1980, the largest goods-producing subsector for both the United States and Colorado was the manufacturing sector, which employed 18 percent and 11 percent of total employment, respectively. New Mexico’s largest goods-producing sector in 1980 was construction at a similar share of total employment to its February 2019 value of about 6 percent. The mining sector was Wyoming’s largest employer within the goods-producing sector in 1980, employing 14 percent of Wyoming workers. However, by February 2019, employment in the mining sector had dropped to about 7 percent.
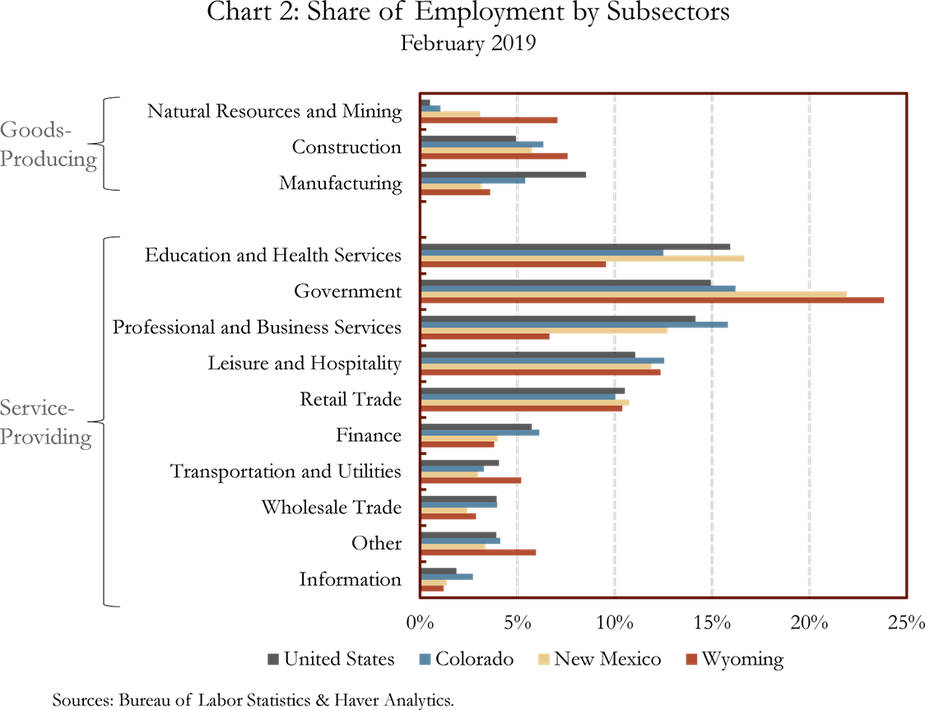
The largest service-providing sectors for the United States and Rocky Mountain States in 1980 (not shown in Chart 2) were retail trade and government, and both are still relatively large sectors today. As of February 2019, the largest services sector in the United States was education and health services, while the government sector was the largest services sector within the Rocky Mountain States. The largest private services industries within the Rocky Mountain States include education and health services, professional and business services and leisure and hospitality.
Recent Trends in the Services Sector
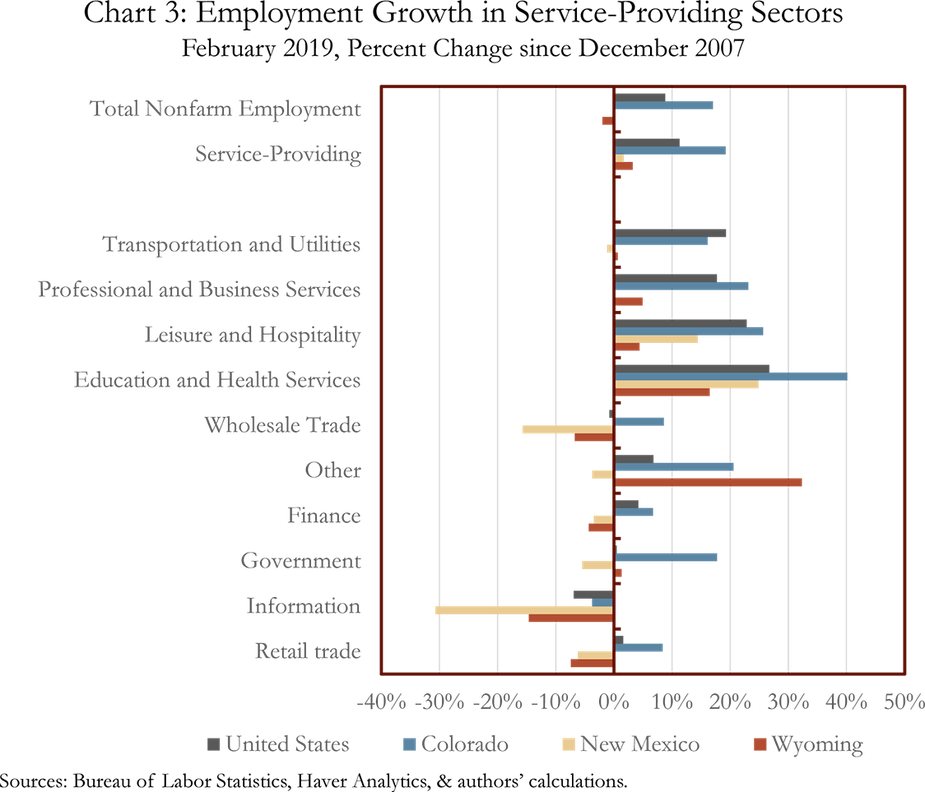
Not only did employment growth in the services sector outperform that of the goods-producing sector during the 1980s and 1990s, it also has outperformed in recent years following the 2007-09 recession. As of February 2019, employment in the goods-producing sector still was below pre-recession levels from December 2007 in the United States, New Mexico and Wyoming. Employment in Colorado’s goods-producing sector has performed better and is up 3.8 percent since December 2007 with across-the-board growth in construction, manufacturing and natural resources and mining.
Conversely, employment in the services sector has surpassed pre-recession levels in the United States and every Rocky Mountain State (Chart 3). Employment growth since December 2007 has been broad based across the services subsectors in the United States and Colorado, with overall services sector employment up 11 percent in the United States and 19 percent in Colorado. Services sector growth has been more mixed in New Mexico and Wyoming, but services sector employment is still 1.7 percent and 3.2 percent higher than December 2007 levels, respectively. Three of the fastest growing industries in Colorado, New Mexico and Wyoming in recent years have been education and health services, leisure and hospitality and professional and business services.
Measuring Current and Expected Activity in the Services Sector
Given the importance of the services sector in the U.S. and regional economies, it is crucial to understand the current health of these sectors. In addition to analyzing economic data, such as employment and gross domestic product, surveys are a key tool used to gauge activity levels within specific areas of the economy. Surveys provide a timely view of current economic conditions, and some provide respondents’ expectations for future levels of activity.
The Institute of Supply Management’s (ISM) Non-Manufacturing Survey is a frequently cited survey of activity in the services sector. ISM surveys purchasing and supply executives at firms across the United States and asks them about current economic conditions compared with the previous month (Chart 4). The diffusion index in Chart 4 equally weights four subcomponents of the survey including business activity, new orders, employment and suppliers deliveries.iii An index reading above 50 indicates that services sector activity is expanding, while a reading below 50 indicates the sector is contracting.
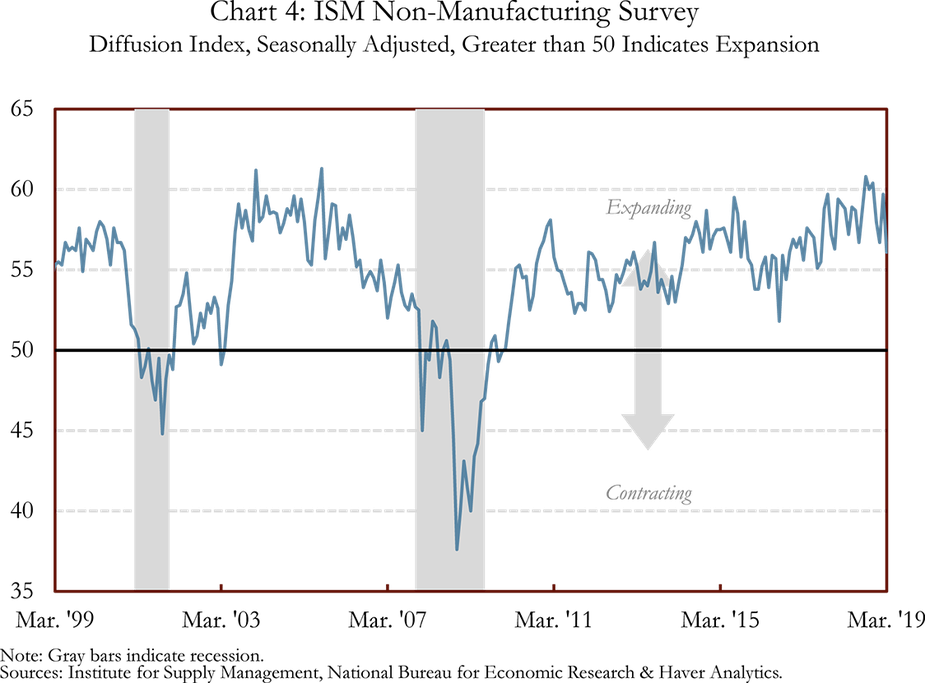
The ISM Non-Manufacturing Survey index has remained above 50 since early 2010, indicating that the services sector has been expanding in the United States for more than nine years. The index increased throughout 2017 and 2018, suggesting that activity in the services sector strengthened and was expanding at a strong pace by mid-2018. So far in 2019, index levels mostly have been below average levels of 2018 but remain well above 50. Therefore, the services sector has continued to expand in 2019 but at a slightly slower pace than last year.
The Federal Reserve Bank of Kansas City started conducting a similar survey of the services sector in 2014, and began releasing results from that survey earlier this year.iv Unlike the ISM Non-Manufacturing Survey, which is national in scope, the Federal Reserve Bank of Kansas City’s survey focuses on conditions within the seven states of its District including Colorado, Kansas, western Missouri, Nebraska, northern New Mexico, Oklahoma and Wyoming. The Kansas City Fed survey includes contacts from services industries including retail and wholesale trade, transportation, high-tech and professional services, education, restaurants, automobile dealers, information, real estate, health services, tourism and other services. Similar to the national survey, this regional survey also provides a composite index which reflects overall economic activity within the services sector, as well as 10 subcomponents including general revenue/sales, employment, prices and inventory levels. The composite index is a weighted average of the general revenue/sales components, employment and inventory indexes, the first two of which also are included in the ISM Non-Manufacturing Survey composite index.
Similar to the ISM Non-Manufacturing index, the Kansas City Fed Services Survey also uses a diffusion index but has a slightly different scale, ranging from -100 to 100. On this scale, a reading below zero indicates contraction and a reading above zero indicates expansion (Chart 5). In addition to asking about current conditions compared with the previous month, the Kansas City Fed survey asks respondents to compare current conditions with conditions one year ago and asks contacts about their expectations for activity six months from now.
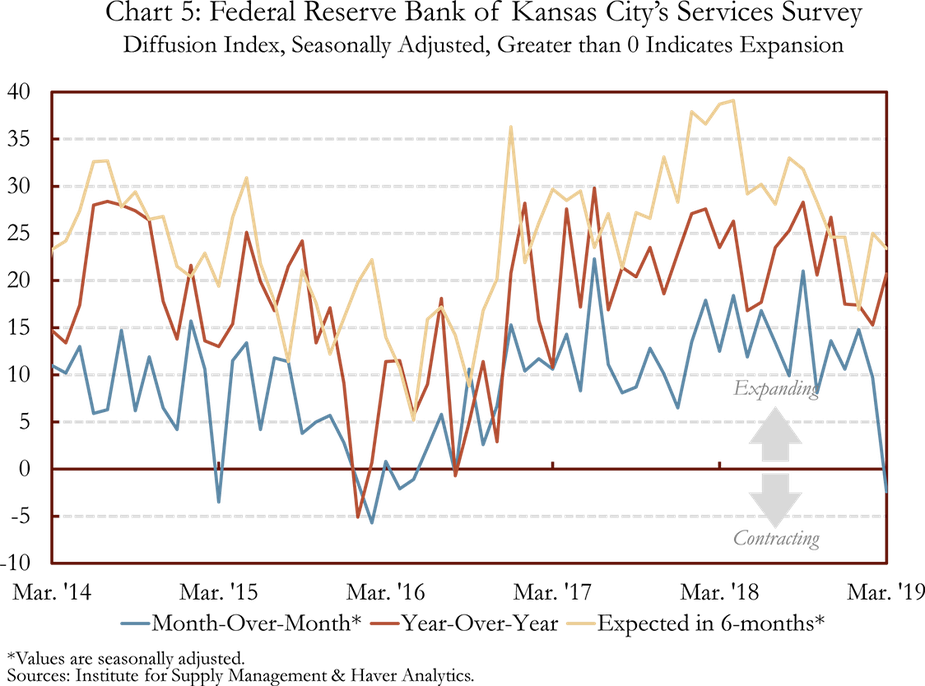
Since the regional survey began five years ago, all three indexes have remained positive for almost all of that time, suggesting that the services sector has been expanding. However, these indexes did fall in late 2015 and early 2016 as the energy sector weakened throughout our region of the county. Activity levels rebounded in 2017 and early 2018, with index levels indicating a fairly strong services sector. The month-over-month index has fallen in more recent months, and in March fell just slightly into negative territory. Some of the slowdown in the level of services activity in recent months appears to be connected to temporary factors such as the partial government shutdown, harsh winter weather and the recent severe flooding in parts of the region. Overall, contacts remain optimistic that the services sector will expand over the next six months.
Conclusion
The composition of the economies of the United States and Rocky Mountain States has shifted from goods-producing to predominantly service-providing in the last 100 years. Large private industries in the services sector across the three-state region include professional and business services, leisure and hospitality and education and health services. The ISM Non-Manufacturing Survey and recently released Federal Reserve Bank of Kansas City's Services Survey have shown growth in the services sectors over the last few years, and contacts in the Kansas City Fed Survey expect the services sector to expand over the next six months.
End Notes
i For a more comprehensive definition on goods-producing and services-providing industries, the Bureau of Economic Analysis provides additional information here: External Linkhttps://www.bea.gov/index.php/help/faq/182
ii For additional information on what the U.S. and Rocky Mountain economies looked like at the turn of the 20th century, see the Rocky Mountain Economist from the fourth quarter of 2017 here: https://www.kansascityfed.org/publications/research/rme/articles/2017/rme-4q-2017
iii External Linkhttps://www.instituteforsupplymanagement.org/ISMReport/NonMfgROB.cfm?SSO=1
iv For more information on the Kansas City Federal Reserve Bank’s Services Survey, including new releases, visit our website at: External Linkhttps://www.kansascityfed.org/research/indicatorsdata/services
The views expressed are those of the authors and do not necessarily reflect the positions of the Federal Reserve Bank of Kansas City or the Federal Reserve System.
Author