Real wage growth, meaning wage growth after accounting for inflation, was faster in most states in 2024 compared to recent years. With inflationary pressures subsiding over the last year, average real wages returned to positive territory for many households in most locations across the U.S. However, the average rate of real wage growth fluctuates widely for individual states, causing their pace of real wage growth to frequently shift relative to one another. In September 2024, Rocky Mountain states arrived at the upper end of the wage growth distribution compared to other states. Despite the natural inclination to attribute shifts in real wages to differences in regional price growth, the composition of job gains plays an even bigger part. In this Rocky Mountain Economist, we show that real wage growth has stabilized across all U.S. states, even as individual states may be experiencing differences in real wage growth currently. We demonstrate that differences in average wage gains are the primary drivers of these disparities, rather than differences in price growth, and highlight the role of the composition of job gains in driving relative wage growth rates across states.
Most states have positive real wage growth, with disparities that are in line with historical norms
With inflationary pressures subsiding over the last year, average real wages increased for most U.S. states (Chart 1). In 2024, continued economic growth, growing nominal wages, and lower inflation all contributed to healthier real wage growth. As of September 2024, 72 percent of states had positive real wage growth on average, just behind the average of 92 percent of states during the 2017-19 period. The pace of real wage growth is normalizing across the U.S., though it may take further time for household earnings to fully catch up with higher price levels after the recent inflationary episode.
States tend to move rapidly with the U.S. real wage growth distribution, a fact that is common across time. For states currently in the upper 50th percentile of the wage growth distribution, only two1 were consistently2 in the upper 50th percentile and only four3 remained consistently in the lower 50th percentile during the 2017-19 period – a period characterized by steady and positive average U.S. real wage growth. Said differently, underlying local factors at the state and regional level can cause average state-level real wage growth to shift rapidly, asynchronous from the national trends. Some states move from the bottom to the top end of national wage distribution in a matter of months – a phenomenon evident in Colorado, New Mexico, and Wyoming.
Chart 1: The U.S. Distribution of Real Wage Growth Is Normalizing to Longer-Term Rates
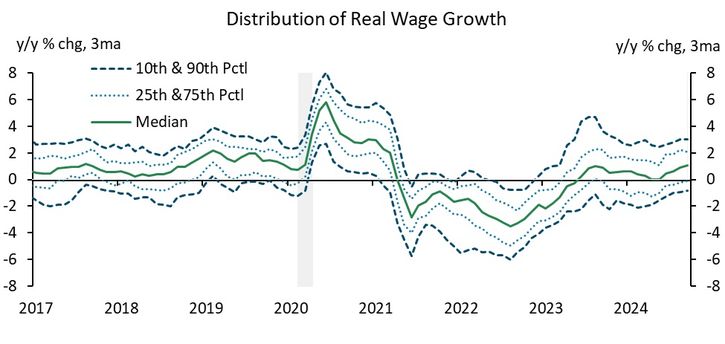
Notes: Smoothed using a 3-month moving average
Source: BLS, Haver Analytics, staff calculation
Differences in real wage growth rates between states tend not to be persistent
The ranking of Rocky Mountain states’ real wage growth fluctuated widely since 2017, converging at the top in 2024. Colorado, New Mexico, and Wyoming were last near the 90th percentile of the wage growth distribution in September 2019 (Chart 2). Yet, Colorado went from the bottom to the top of the distribution twice between 2017 and 2024. Wyoming also showed wild fluctuations in ranking, placing at the very top of the distribution during the second half of 2019, and remaining between the 25th percentile and the median in 2021-23. New Mexico consistently remained around the median in 2017-21, then ranked at the very top of the distribution in 2022, and the very bottom in 2023.
Chart 2: Real Wage Growth in Rocky Mountain States Currently Ranks Near the Top
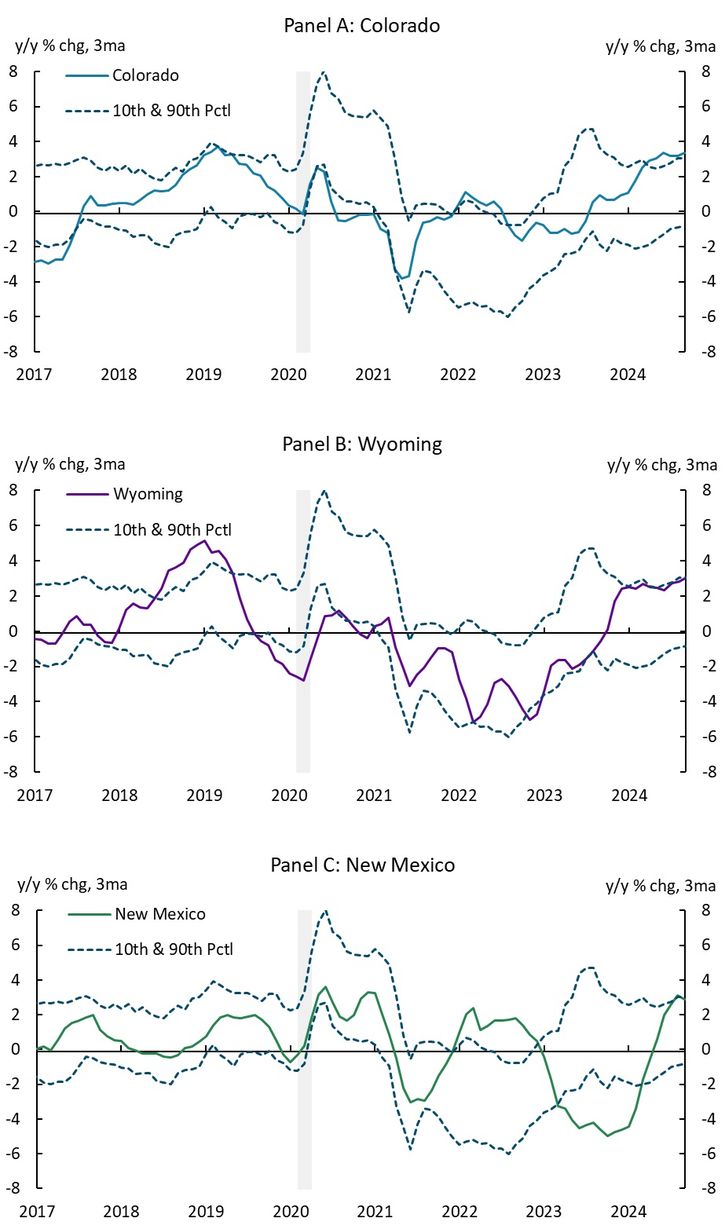
Notes: Smoothed using a 3-month rolling average
Source: BLS, Haver Analytics, staff calculation
Variation in real wage growth is driven by differences in wage growth, not inflation
Different regions experienced somewhat different rates of price growth recently, which can contribute to differences in relative real wage growth. Inflation for the west region4 was steady, averaging 3 percent in the years preceding the pandemic and fell between 2020 and early 2021 (Chart 3, dark purple bars). From late 2021 to the end of 2023, inflation in the west region ballooned to an average just over 6 percent, creating meaningful headwinds for real wages, and eroding purchasing power for consumers (External LinkClark et. al. 2023). With healing supply chains and the U.S. economy coming back into balance, inflation in the west region again averaged roughly 3 percent in the first three quarters for 2024 and is closer to 2 percent in recent months. This common regional inflation factor is helping push up average real wage growth for Colorado, Wyoming, and New Mexico to the upper end of the U.S. wage distribution.
However, moderating regional inflation is only part of the real wage story, as average nominal wage growth across states plays a more important role in explaining differences in real wage growth (Chart 3). For example, in 2017-19, hourly nominal wages grew by an average of 3.7 percent in Colorado and fell materially during the pandemic (2020-21), even going negative on average in mid-2021. Average nominal wage growth rebounded to 6.1 percent in 2022-23 and remain elevated in 2024, just shy of 6 percent. These pronounced swings in average state nominal wage growth contributed to fluctuations Colorado’s real wages over the last 8 years. Wyoming faced similar nominal wage variability, with average nominal wages growing at 4.3 percent in 2017-19, a striking drop in nominal wage growth during 2021-22, with a slow and unsteady recovery during 2023-23. Nominal wage growth resurged in Wyoming in 2024, averaging 5.8% throughout the year. New Mexico followed still a different path for nominal wage growth, averaging 3.7 percent in 2017-19, with a slight slowdown in nominal wage gains in 2021. New Mexico then saw a swift surge in nominal wage growth in 2022 to early 2023, before facing negative average nominal wage growth for most of 2023. Nominal wage growth returned to positive territory averaging 3.3 percent in 2024, just slightly behind the state’s longer-term average. Overall, each Rocky Mountain state experienced differing underlying nominal wage dynamics, but they have all recently converged near the top relative to other states.
Chart 3: Wage and Inflation Components of Real Wage Growth in Rocky Mountain States
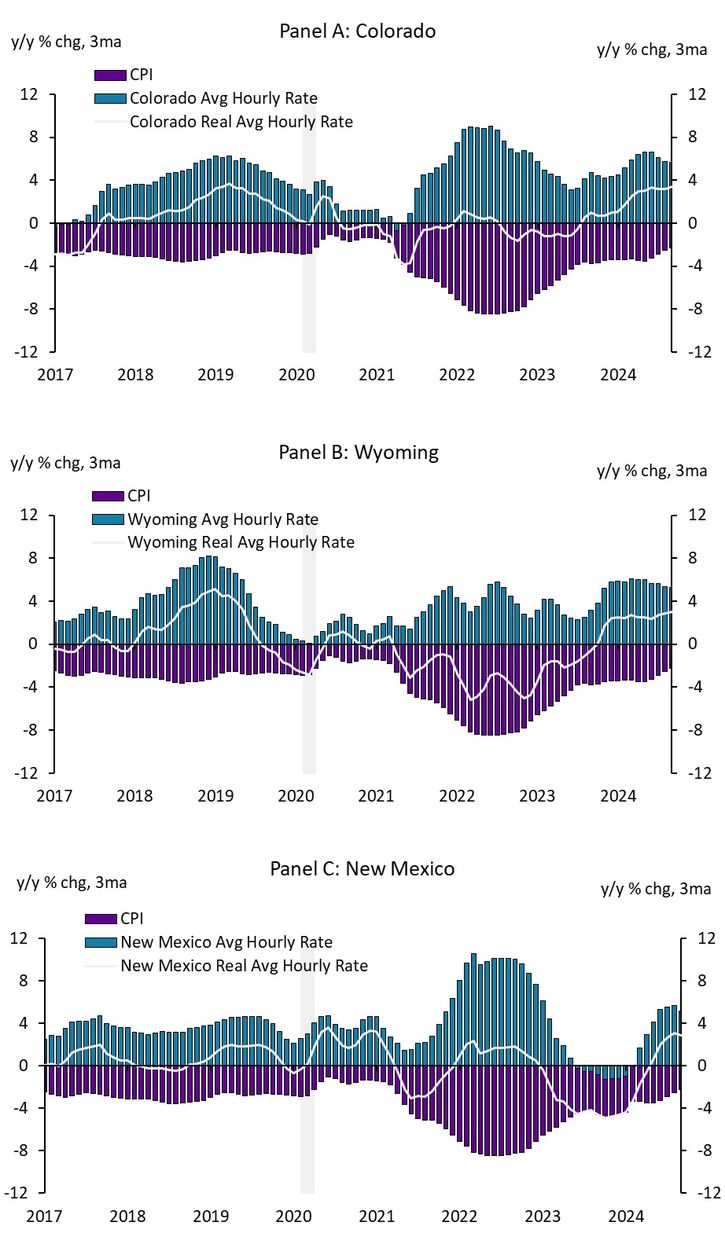
Notes: Smoothed using a 3-month rolling average
Source: BLS, Haver Analytics, staff calculation
Compositional changes in job gains drive fluctuations in nominal wages across states
The primary factor driving the rate of average nominal wage growth within states is the composition of job gains across industries (Chart 4). All Rocky Mountain states witnessed healthy nominal wage gains between 2017 and 2019 as the composition of employment5 was shifting between lower paying industries to higher paid industries. However, the specific job gains differed across state. In the 2017-19 period, Colorado showed that job gains in the consumer services industry and the business & professional services industry gained ground against new jobs in the goods producing industry. Meanwhile in Wyoming, job gains in the goods producing industry and in government was a meaningful contributor to the state’s wage growth during this period. Simultaneously during this period, New Mexico experienced steady job gains in the goods producing industry and in the business & professional services industry, and experienced a noticeable decline in government job gains. These differences in job gains help explain much of variability in nominal wage gains seen in Chart 2. In 2024, these three Rocky Mountain states underwent a shift towards slightly higher paying industries like goods and government. Colorado, Wyoming, and New Mexico experienced steady growth in government employment and weak growth in lower paid consumer services employment. However, New Mexico saw steady growth in the higher paid goods producing industry, with muted gains in other industries. All told, compositional changes in state level employment are a significant contributor to average nominal wage changes, and by extension an important driving factor for higher average real wages in Rocky Mountain states this year.
Chart 4: Composition of Job Gains Across Rocky Mountain States
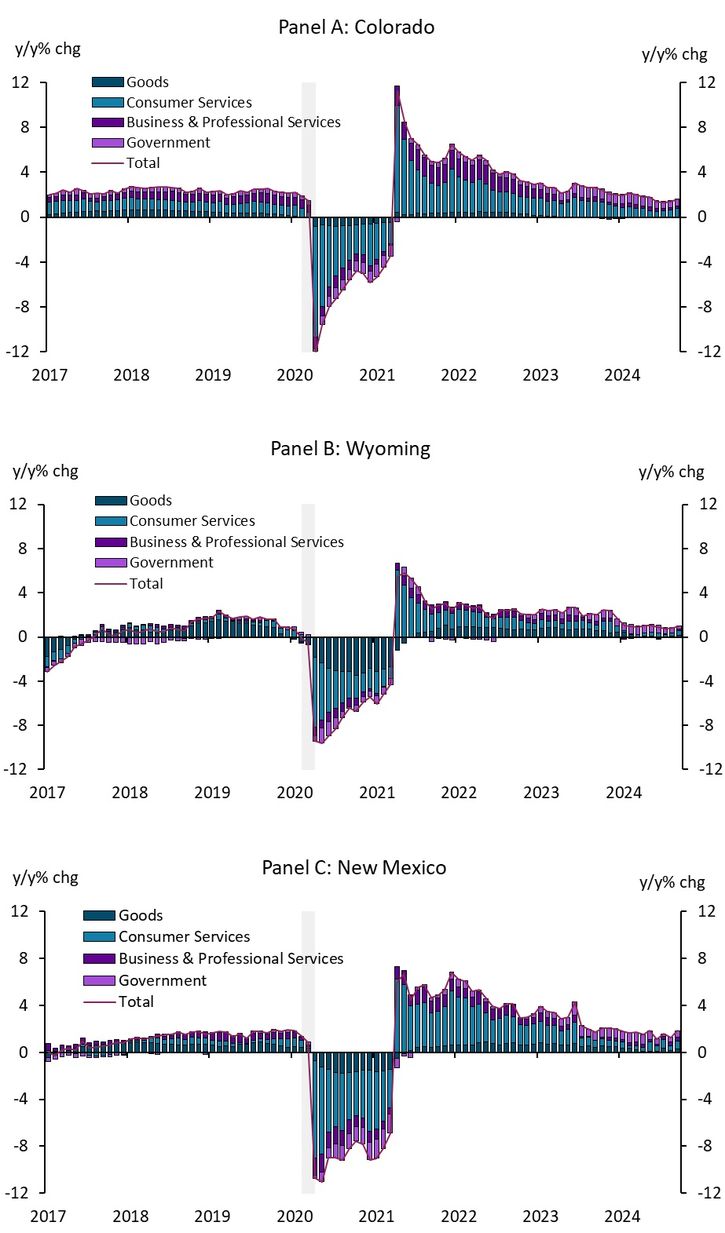
Source: BLS, Haver Analytics, staff calculation
Conclusion
As the U.S. economy continues growing steadily, average real wages are approaching longer-term averages. Many states are again seeing positive real wage gains as inflation returns to the Fed’s 2 percent target and nominal wage growth is supported by still strong labor markets. Positive real wage gains are an important factor helping households recover from the country’s recent inflationary episode. While the national trends are important, each state is also affected by unique economic drivers. Regional inflation and importantly fluctuations in average nominal wages both contribute to variability in state-level average real wages. These regional dynamics are particularly evident in Rocky Mountain states over the last year as subsiding regional inflation, nominal wage gain growth, and compositional changes in regional labor markets, pushed Colorado, Wyoming, and New Mexico to the top end of the wage distribution.
__________
1 West Virginia and Michigan.
2 75% of the time or more.
3 Louisiana, New Hampshire, Pennsylvania, and Utah.
4 All Urban Consumers CPI-U – West Region, US Bureau of Labor Statistics, smoothed using a 3-month moving average.
5 The 4 categories are: goods, consumer services, business & professional services, and government. They add up to the total of All Employees: Total Nonagricultural in each state, US Bureau of Labor Statistics via Haver Analytics.
Reference
Clark, Maggie, Bethany Greene, David Rodziewicz and Nicholas Sly. 2023. “External LinkInflation Hit Higher Peaks in the Rocky Mountain Region, But Is Following the National Descent” Federal Reserve Bank of Kansas City, Rocky Mountain Economist
The views expressed are those of the authors and do not necessarily reflect the positions of the Federal Reserve Bank of Kansas City or the Federal Reserve System.
Authors

Juan David Munoz Henao
Research Associate II