Download Article | Average debt for Tenth District consumers, defined for this report as all outstanding debt other than first mortgages and presented as a four-quarter moving average, increased $100 to $16,340 in the third quarter of 2015 (Chart 1).1 Except for two quarters of modest decline, average consumer debt has increased steadily and is up about $900, or 5.8 percent, since the first quarter of 2012. Average consumer debt in the District remained 6.2 percent less than its recession-era-high of $17,415 in the first quarter of 2009. National average consumer debt of $17,392 remained well above the District level. National debt also has been increasing, but was up only 1.6 percent from the first quarter of 2012.
Chart 1: Outstanding Consumer Debt and Revolving Debt per Consumer
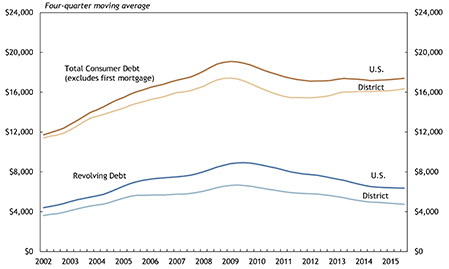
Average revolving debt, which consists largely of credit cards and home equity lines of credit (HELOCs), continued to decline, inching down to $4,741, or 28 percent below its recession-era peak. Most consumers (with credit reports) have credit cards, while about 6 percent have open HELOCs. Rising total debt and declining revolving debt imply that installment debt (other than first mortgages) has increased significantly. The components of consumer debt are discussed later in the report.
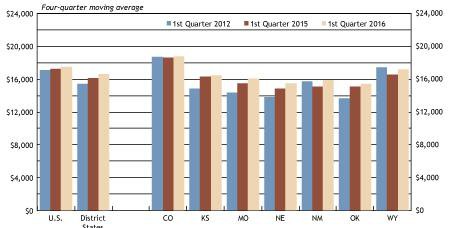
Average consumer debt varied significantly across District states, from about $15,200 in Nebraska and Oklahoma to $18,524 in Colorado (Chart 2). Coloradans consistently carry more debt than consumers in other District states, due largely to a higher cost of living—especially for housing—and above-average incomes. Consumer debt tends to move with both the cost of living and income. Local economic factors also play an important role in cross-state debt balances. The New Mexico economy is among the poorest-performing state economies in the nation. Consumer debt rebounded much later after the recession in New Mexico than in other District states and did so at a slower rate.2 Consumer debt in New Mexico, however, increased the most among District states in the past year, 5.2 percent, compared to 1.5 percent for the entire District. Historically, consumer debt in New Mexico has been about on par with the District average. All other District states saw average consumer debt increase at least 1.1 percent. Socioeconomic factors also contribute to the variation in average debt across states and time, including demographics, cultural differences, trends in financial intermediation and public policy.3
Chart 2: Outstanding Consumer Debt per Consumer
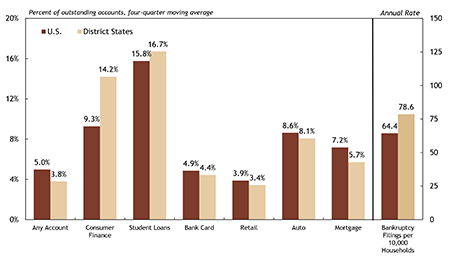
Overall credit delinquency in the third quarter in the District was 3.8 percent, down slightly from the first quarter and significantly lower than the U.S. rate of 5 percent (Chart 3).4 The lower overall delinquency rate in the District is attributed to lower mortgage delinquency rates in District states. Specifically, the rate for mortgage delinquency (30 or more days past due) in the District was 5.7 percent in the third quarter, compared to 7.2 percent for the entire nation.5
Chart 3: Consumer Credit Delinquency Rates
Beginning with the third quarter 2015 report, information on consumer finance loans (mostly installment loans) and retail lending (mostly revolving credit) is provided in the Tenth District Consumer Credit Report.
The third quarter District delinquency rate on consumer finance loans of 14.2 percent was significantly higher than the rate for the entire nation of 9.3 percent. The higher District delinquency rate was driven by significantly higher delinquency rates in Missouri, New Mexico and Oklahoma (Chart 4). Many factors help explain the level of debt and delinquency across states and time, as noted for consumer lending more generally. For example, the consumer finance sector is less regulated than most lending sectors, even for closed-end installment loans. State-level variation in consumer law and policy is significant and could be an important factor.6
Chart 4: Past Due Consumer Finance Accounts
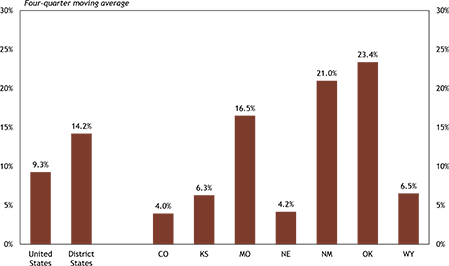
While not necessarily the primary cause of District differences in delinquency rates for consumer installment loans, the states with the highest delinquency rates—Missouri, New Mexico and Oklahoma—also are among the states with the most generous limits on interest that can be charged. Using a six-month, $500 installment loan, Missouri and New Mexico are among the eight states with no cap on interest; the annual percentage rate (APR) in Oklahoma is capped at 116 percent, the highest among states that cap APR.7 Research suggests higher interest rates are associated with higher risk of default.8
Late bills for all forms of credit (excluding student loans) were less common in District states than in the nation. Auto and student loan delinquencies continued to increase through the third quarter, while bank card delinquencies decreased. Increased subprime activity in the auto loan sector may be responsible, at least in part, for recent increases in delinquency, as subprime loans historically have had higher delinquency rates and defaults.9 The student loan delinquency rate is sharply higher if only loans in repayment are considered, ranging from 16.7 percent in North Dakota to 49.6 percent in Mississippi.10 Delinquencies on retail loans ticked up from the first quarter to 3.9 percent, while consumer finance delinquencies declined sharply from 15 percent to 14.2 percent.11
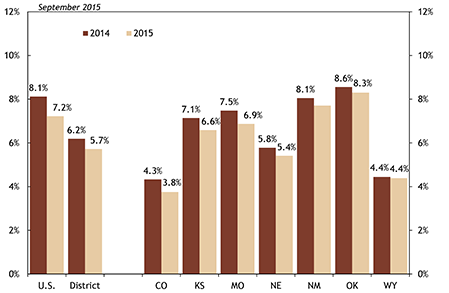
Delinquency rates for mortgages in the District continued a downward trend and remained below national rates in the third quarter (Chart 5)12. The past due rate for mortgages in the District was 5.7 percent, down from 6.2 percent a year ago. The seriously delinquent rate (not shown in Chart 5), which consists of all mortgages 90 or more days past due or in foreclosure, was 2.5 percent, down from 2.8 percent a year ago. U.S. serious delinquencies were consistently higher (4.3 percent in the third quarter), but the difference is due mostly to a higher U.S. foreclosure rate. The past due rate for the nation over the last year fell from 8.1 percent to 7.2 percent. Mortgage delinquency rates continued to vary widely across District states, from 3.8 percent in Colorado to 8.3 percent in Oklahoma.
Chart 5: Mortgage Delinquency, U.S., District and District States
In This Issue: The Composition of Consumer Debt
Consumer credit, or the capacity to borrow, comes in many forms. For this report, consumer credit includes auto and student loans, retail and consumer finance credit, and bank cards, as well as secondary mortgage liens and HELOCs.13 Debt balances (amount owed) on specific types of credit accounts generally are not reported in the Tenth District Consumer Credit Report.
Account balances can be computed many ways. In this report, account balance is calculated as the average balance of consumers with at least one account of that type, such as credit cards. In that case, a person with three credit cards is treated the same as a consumer with a single credit card in that the average is across all accounts of that type for that consumer.14 Another important issue in these calculations is the treatment of joint accounts.15 The Tenth District Consumer Credit Report does not split joint accounts.16
Average balances over 2011-15 for the various forms of credit not backed by real property (land and improvements) are shown in Chart 6. Most salient in the chart is that auto loan and student loan balances have increased significantly.17
Chart 6: Average Outstanding Balance for Those with at Least One Account
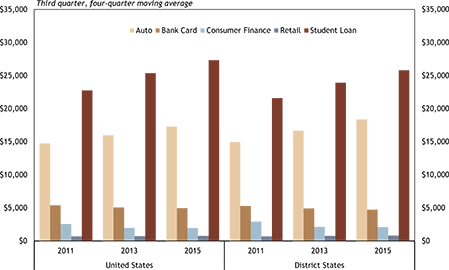
In the third quarter of 2011, the aggregate student loan balance for those with student loan debt was $21,592 in the District and $23,480 nationally. By 2013, the average student loan balance in the District had increased to $23,930 and currently is $25,797. The (compounded) annual increase over the four-year period was 4.5 percent, compared to 1.4 percent for all consumer debt. Nationally, average student debt has increased 4.7 percent annually to $27,326. Many factors have affected the increase in average student loan balance, including (1) the cost of attendance; (2) fiscal restraints in the public sector and restrictions on aid; (3) a change in the composition of students, particularly greater matriculation at proprietary schools and less-qualified applicants; and (4) changes in student loan policies.18
Increased auto debt has resulted largely from increased purchases of new vehicles. About 73 percent of new cars are financed, either through a purchase loan or a lease, with the remainder purchased with cash.19 Sales of new autos dropped sharply during the recession and early in the recovery, significantly increasing the average age of automobiles in use.20 The aging fleet of existing autos and latent demand for new autos produced a spike in sales over the last two to three years, resulting in a significant increase in aggregate auto debt. The increase in average debt suggests a greater share of outstanding auto loans was made relatively recently, which comports with the increase in sales creating a younger loan stock. Consumers also may be purchasing more expensive cars, reflecting increased income and economic security.
Balances for revolving products, such as bank cards and retail credit, have declined following the recession. Average debt for bank cards in the District (for those who have bank cards) declined 10.5 percent over 2011-15 to $4,723. Nationally, bank card debt fell from $5,387 to $4,961, or 7.9 percent. Looking over longer trends (not shown in Chart 6), consumer finance debt is highly cyclical, often increasing sharply during economic downturns. In both the District and the nation, consumer finance decreased rapidly through 2013, but since has leveled off. Retail balances typically are low relative to other forms of debt, with a third quarter 2015 average balance of $778 in the District and $820 nationally.
Endnotes
[1] Statistics in this report are derived from data in the Federal Reserve Bank of New York Consumer Credit Panel/Equifax unless otherwise indicated. The data consist of a 5 percent sample of Equifax credit reports, which are devoid of any information that could be used to identify individuals. Average consumer debt is calculated by dividing the aggregate consumer debt of those in the sample by the number of individuals (with credit reports) in the sample. Credit and debt statistics can be calculated many ways, and thus these statistics may not be comparable to similar statistics published elsewhere, including by other Federal Reserve Banks. The Tenth District includes Colorado, Kansas, the western third of Missouri, Nebraska, the northern half of New Mexico, Oklahoma and Wyoming. In many cases in the report, data from all of Missouri and New Mexico are used, in which case the label for the region is “District States.”
[2] Employment growth in New Mexico was 49th in the nation in 2010-15, compared to seventh in 2001-07. See Jeff Mitchell, “New Mexico’s Economy: Recent Developments and Outlook,” Bureau of Business & Economic Research, University of New Mexico, presented at the Regional Economic Roundtable, Federal Reserve Bank of Kansas City, Nov. 2, 2015.
[3] See, for example, Basak Kus, 2015, “Sociology of Debt: States, Credit Markets, and Indebted Citizens,” Sociology Compass, vol. 9, no. 3, pp. 212-223; see also, Thomas Durkin et al., 2015, Consumer Credit and the American Economy (Oxford University Press USA).
[4] Delinquencies are calculated as a share of open trade lines. For example, bank card delinquency expresses the share of bank cards that is delinquent.
[5] Lender Processing Services Inc. (datafile).
[6] See National Consumer Law Center, July 2015, “Installment Loans: Will States Protect Borrowers from A New Wave of Predatory Lending?,” available at External Linkwww.nclc.org/images/pdf/pr-reports/report-installment-loans.pdf.
[7] National Consumer Law Center, pp. 69-70.
[8] See, for example, Delvin Davis and Joshua M. Frank, 2011, “Under the Hood: Auto Loan Interest Rate Hikes Inflate Consumer Costs and Loan Losses,” April 19. Available at External Linkdx.doi.org/10.2139/ssrn.1860188.
[9] See Amy Crews Cutts and Dennis W. Carlson, “Subprime Auto Loans: A Second Chance at Economic Opportunity,” Economic Trends Commentary, Equifax, Feb. 17, 2015. Available at External Linkwww.equifax.com/assets/corp/subprime_auto_economic_commentary.pdf. Recent subprime loans have been performing better than those made prior to the financial crisis.
[10] Wenhua Di and Kelly D. Edmiston, 2015, “State Variation of Student Loan Debt and Performance,” Suffolk University Law Review, vol. 48, no. 3, pp. 661-688. Loans not in repayment typically are deferred or in forbearance.
[11] Consumer finance accounts are much less common than most other types of credit accounts. Thus, balances and delinquency rates would be expected to be more fluid. Still, the trend in consumer finance delinquencies is clearly downward.
[12] These data cover both primary (first mortgage) and junior (second mortgages, third mortgages, etc.) liens. The May 2015 issue of the Tenth District Consumer Credit Report considered only primary liens.
[13] Other forms of credit also do not fit these definitions, but credit agencies do not report information about the credit, and the effect on total outstanding debt is negligible.
[14] Account balances can be computed many ways. One method is to calculate the average balance per open account. Another is to calculate the average balance of consumers with at least one account of that type, such as credit cards. In that case, a person with three credit cards is treated the same as a consumer with a single credit card in that the average is across all accounts of that type for that consumer. Finally, an average balance can be calculated for each account with a positive balance or each consumer who has a positive balance on at least one account. This report provides a picture of the credit status of a “typical” consumer (with a credit report) for the District, the United States, and, in some cases, individual District states. To that end, the report computes average account balances by individuals with accounts.
Another important issue in these calculations is the treatment of joint accounts. The splitting of joint accounts avoids double counting when totaling debt across individuals. For example, in its “Quarterly Report on Household Debt and Credit,” which largely takes a national view, the Federal Reserve Bank of New York splits joint accounts as it sums total amounts of debt for the United States. The Tenth District Consumer Credit Report does not split joint accounts for two reasons. First, the analysis does not calculate aggregate balances, where double counting would be a significant concern. Second, and most important, all parties holding a joint account are individually responsible for the entire debt. To provide an accurate picture of a typical consumer’s credit status, all debt responsibilities should be included, including the full amount of joint debt. Mortgages are the most common type of debt to have joint accounts. Thus, the effect of splitting joint accounts has the greatest effect on that form of credit when computing aggregate balances.
[15] This issue is discussed in detail in the fourth quarter 2013 issue of the Tenth District Consumer Credit Report, available at www.kansascityfed.org/publicat/community/ccr/2013-4q-District-CCR.pdf. The splitting of joint accounts avoids double counting when totaling debt across individuals. For example, in its “Quarterly Report on Household Debt and Credit,” which largely takes a national view, the Federal Reserve Bank of New York splits joint accounts as it sums total amounts of debt for the United States (see External Linkwww.newyorkfed.org/microeconomics/hhdc.html#/2015/q2).
[16] Accounts are not split for two reasons. First, the analysis does not calculate aggregate balances, where double counting would be a significant concern. Second, and most important, all parties holding a joint account are individually responsible for the entire debt. To provide an accurate picture of a typical consumer’s credit status, all debt responsibilities should be included, including the full amount of joint debt. Mortgages are the most common type of debt to have joint accounts. Thus, the effect of splitting joint accounts has the greatest effect on that form of credit when computing aggregate balances.
[17] Trends in auto debt (third quarter, 2014) and student loan debt (first quarter, 2013) have been discussed at length in previous issues of this report.
[18] See Kelly D. Edmiston and others, 2012 (Revised April 2013), “Student Loans: Overview and Issues,” Federal Reserve Bank of Kansas City, Research Working Paper 12-05, available at www.kansascityfed.org/~/media/files/publicat/reswkpap/pdf/rwp%2012-05.pdf.
[19] Newcars.com, a subsidiary of cars.com.
[20] R.L. Polk & Co., a subsidiary of IHS Automotive.
