Average consumer debt for Tenth District residents, defined as all outstanding debt other than first mortgages and presented as a four-quarter moving average, rose from an inflation-adjusted $17,239 in the first quarter of 2017 to $17,346 in the third quarter, an increase of 0.6 percent (Chart 1).1 Inflation-adjusted consumer debt for the United States rose from $18,067 to $18,171, also up about 0.6 percent.
Although inflation-adjusted consumer debt has been climbing moderately since 2012, it remains 13.7 percent below its 2009 high of $20,103. Average inflation-adjusted consumer debt in the United States is 17.5 percent below its 2009 high.
Chart 1: Outstanding Consumer Debt Per Consumer and Revolving Debt Per Consumer
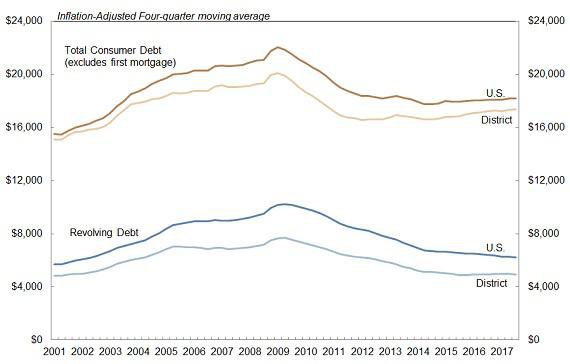
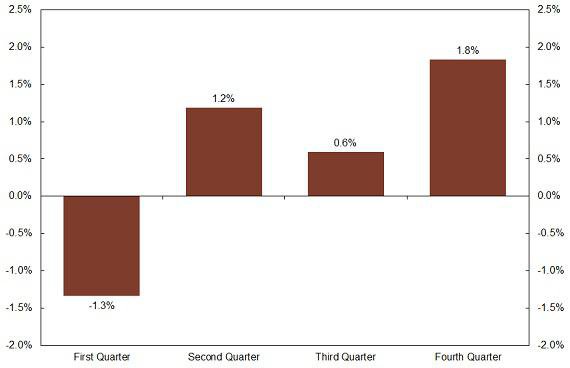
Average balance on revolving lines of credit—mostly credit cards, but also home equity lines of credit and retail cards—declined modestly in the third quarter in both the District and the nation. Moving into the holiday shopping season, revolving debt is expected to follow its usual pattern of rising sharply in the fourth quarter (1.8 percent, on average) and retreating significantly in the first quarter (-1.3 percent, on average) (Chart 2). While the first quarter decline mostly offsets the holiday bounce in the District, the average annual increase in revolving debt is 2.3 percent, as balances tend to grow in the second and third quarters.
Chart 2: Average Quarterly Growth in Revolving Debt, 2001-2016
The majority of revolving and installment retail borrowing comes from older consumers; younger consumers, however, are more likely to use bank-branded credit cards for their retail borrowing needs and rarely retail financing.2 Most retail debt is revolving debt. Installment retail debt typically appears in credit reports as “consumer finance” debt. Average consumer finance debt for those with an account is $2,217 in the District, compared with $2,072 nationally. Although average retail card debt is less than $1,000, many more people have retail credit cards than consumer finance credit. Examples of purchases often financed with installment consumer credit rather than revolving credit are furniture and appliances (auto debt is captured separately). In the third quarter, average bank-branded credit card debt, for those with at least one credit card, was $4,981 in the District versus $5,156 nationally.3
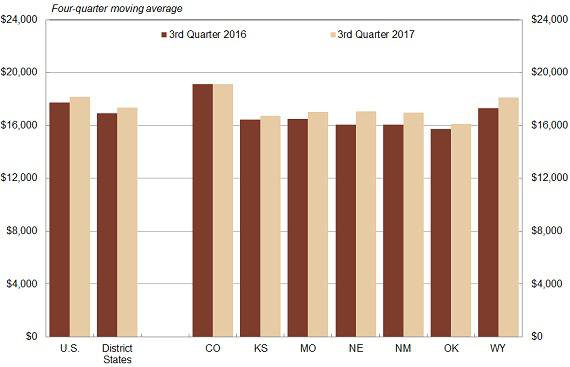
Average consumer debt varied significantly across District states in the third quarter, ranging from $16,119 in Oklahoma to $19,135 in Colorado (Chart 3). Consumer debt in all District states except Colorado remained below the U.S. average. Nebraska had the largest year-over-year change in consumer debt at 6.3 percent. The change in consumer debt for all District states averaged 2.1 percent. Many factors explain differences in debt loads across states, including economic conditions, income, cost of living, consumer regulations and consumer culture.4
Chart 3: Outstanding Consumer Debt Per Consumer by State
Beginning with this issue, delinquencies are calculated as the share of consumers with an account who are past due on an account. This measure generally results in higher delinquency rates than when looking just at the share of all accounts past due (see “In This Issue” below). Delinquency rates are adjusted for previous quarters, and the delinquency data in this issue are not comparable to past issues. The change better reflects the credit position of the typical consumer in the District and the United States.
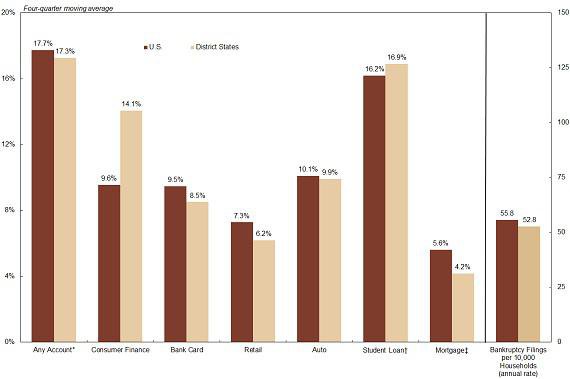
Consumer delinquency rates increased from the first to the third quarters in all District states. The exception is student loans, where the delinquency rate was unchanged at 16.8 percent (Chart 4).5 The share of consumers with a delinquency on any account rose to 17.2 percent in the third quarter from 17.0 percent in the first quarter. The bank card delinquency rate rose from 7.8 percent to 8.2 percent, while the auto loan delinquency rate rose from 9.6 percent to 9.8 percent. Retail and consumer finance debt each ticked up 0.1 percentage point to 6.4 percent and 14.1 percent, respectively.
Chart 4: Consumer Credit Delinquency Rates and Bankruptcy Filings
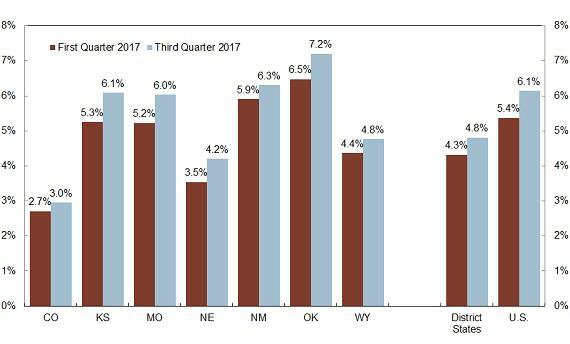
The District mortgage delinquency rate rose sharply from the 4.3 percent in the first quarter to 4.8 percent in the third quarter (Chart 5), although the seriously delinquent mortgage rate (not shown in chart) fell from 1.8 percent to 1.6 percent.6 Since reaching a peak in January 2010, the District mortgage delinquency rate has risen 0.5 percentage point or more in only four of 93 six-month periods.7
The increase in mortgage delinquency was broad based across the District. At the same time, the U.S. rate of past due mortgages moved to 6.1 percent from 5.4 percent. Increased delinquencies have come disproportionately from relatively new Federal Housing Administration (FHA) loans and mostly for 30-day delinquencies, or one payment past due.8 FHA borrowers typically have lower incomes and make lower down payments. One possibility is that they have struggled to manage larger debts in the face of higher house prices. Additional data are necessary to determine if these increases represent a new pattern and a cause for concern or are transient bounce-backs from years of falling delinquency rates. About 70 percent of seriously delinquent mortgage balances are legacy debt from the housing boom that financial institutions continue to work through the foreclosure process.9
Although mortgage delinquencies increased significantly from the first quarter, they remain well below rates at the peak of the housing bust. In January 2010, the District past-due mortgage rate was 9.5 percent, sharply higher than the current rate of 4.8 percent. The seriously delinquent mortgage rate peaked at 5.1 percent in January 2010, compared with 1.6 percent in the third quarter (not shown in chart). U.S. past-due and serious delinquency rates were 6.1 percent and 2.2 percent in September 2017, respectively, compared with 13.9 percent and 8.8 percent in January 2010.
Mortgage balances climbed significantly as delinquency rates declined. Aggregate mortgage debt, at $8.7 trillion nationally in the third quarter, is nearing pre-recession peaks.10 The average mortgage balance in the District in the third quarter was $167,589, up 3.9 percent from last year and 6.5 percent over the last two years. Mortgage balances grew especially fast in Colorado, climbing 4.7 percent over the past year to $238,950. Nationally, average mortgage balance was $198,024 in the third quarter, up 3.1 percent from the past year and 4.8 percent over the past two years.
Chart 5: Share of Mortgages Past Due
In This Issue: Delinquency Measures
Because delinquency rates can be measured many ways, comparing rates from different sources may lead to misunderstanding or confusion. Using CCP/Equifax data, delinquency rates can be measured as the share of accounts past due, the share of aggregate outstanding balance past due, or the share of consumers with an account past due. Each measurement is valid and the proper choice of delinquency measure depends on the goal of the calculation.
If the interest is the financial position of the banking industry, the delinquent share of aggregate balances would be most relevant. For example, the share of aggregate balance past due could be compared to aggregate reserves as an indication of potential systemic risks.
If one is interested in evaluating the financial health of consumers, as in this report, the share of borrowers with past due accounts would be most relevant. Delinquency is measured as the share of consumers with at least one account that is 30 or more days past due. For a consumer with five credit cards, s/he would add one to the past-due tally if one or more were past due and not add to the tally only if all credit cards were current (paid as agreed).
Another measure of delinquency is the share of accounts past due. In credit cards, for example, the delinquency rate is the total number of past due credit cards divided by the total number of outstanding credit card accounts. Thus, an individual with five delinquent credit cards would contribute five accounts to the past-due tally. Unlike share of aggregate balance, this measure provides a market view of delinquency that includes accounts with zero balances.
Chart 6 shows auto delinquencies and bank card delinquencies measured by the share of aggregate balance past due, the share of accounts past due and the share of borrowers who have past-due accounts.
Chart 6: Delinquencies with Alternative Measures of Delinquency, United States, 2000 - 2017
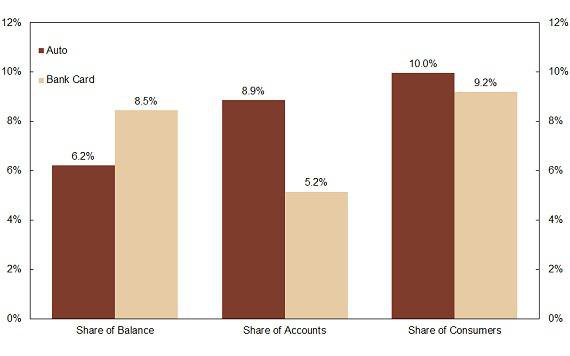
A look at auto loans in the United States for the third quarter shows 6.2 percent of the aggregate balance was past due, 8.9 percent of accounts were past due and 10 percent of consumers had at least one past-due account. Many households, particularly single-member households, have one auto loan, which tends to make the share of accounts past due and the share of consumers past due similar.11 With multiple auto loans, a struggling household likely would make every effort to retain one of the vehicles, if possible, to ensure the availability of transportation. This phenomenon would have the effect of reducing the share of accounts past due compared to the share of borrowers past due, but not likely by a large margin. Finally, subprime borrowers might be expected to have relatively low loan balances with relatively high interest rates, meaning delinquent auto loans would be more likely to have relatively small balances. This phenomenon would tend to make the share of balance past due lower than the share of accounts past due and the share of borrowers past due.
Bank card delinquency in the third quarter was 8.5 percent as a share of aggregate balance, 5.2 percent as a share of accounts and 9.2 percent as a share of consumers (with credit cards). The data on bank card delinquencies suggest that, unlike auto loans, those with large balances are more likely to be delinquent. This reality would make the delinquent share of aggregate balance relatively high. An individual is much more likely to have multiple bank cards than multiple auto loans. The data suggest that many borrowers who are delinquent on at least one account likely have other cards that are current, such as cards that are not frequently used and may have a zero balance. This phenomenon would result in a high share of consumers past due compared to accounts past due.
Although measures of delinquency often vary widely, as demonstrated here for auto loans and bank credit cards, the differences can be explained. All measures of delinquency discussed here are valid: the analyst must choose the option that is best-suited for his/her purpose.
[1] Beginning with this issue, credit data in Chart 1 is adjusted for inflation using the Consumer Price Index. Data are expressed in 2017 dollars, meaning earlier debts are valued as they would be if the same amount were incurred in 2017. Data used to calculate most statistics in this report come from the Federal Reserve Bank of New York Consumer Credit Panel, which is a 5 percent sample of Equifax credit reports. All identifying information is removed by Equifax before the data are accessible to Federal Reserve System researchers.
[2] See Schwahn, Lauren. “2016 Consumer Holiday Shopping Report,” Nerdwallet.com. Accessible at External Linkhttps://www.nerdwallet.com/blog/shopping/2016-consumer-holiday-shopping-report/.
[3] Published average credit card balances differ widely, depending on how the debt is calculated and who is doing the reporting. Only 35 percent of credit card users do not carry a balance (Money Magazine, Feb. 9, 2016; External Linkhttp://time.com/money/4213757/average-american-credit-card-debt/).
[4] Economic factors are discussed in some detail in the last issue of this report (June 2, 2017), see Chart 2 and associated text. It is available at https://www.kansascityfed.org/en/publications/community/consumer-credit-reports/articles/2017/consumer-credit-report-6-2017. For information on cultural factors in explaining differences in debt, see, for example, Basak Kus, “Sociology of Debt: States, Credit Markets, and Indebted Citizens,” Sociology Compass, 9(3), pp. 212-223. See also Kevin Helliker, “The Wealth Report: The Corn Belt Gets Rich, Quietly—Farmers Don’t Flaunt Sudden Crop Windfalls; Buying Same Pickup,” The Wall Street Journal, Aug. 17 2007, p. W1.
[5] These delinquency rates are the share of all student loans past due. Delinquency rates are much higher when considering only those is repayment (not deferred or forborne). This issue is analyzed in detail in the last issue of this report (June 2, 2017), which is available at https://www.kansascityfed.org/en/publications/community/consumer-credit-reports/articles/2017/consumer-credit-report-6-2017.
[6] The serious delinquency rate includes mortgages 90 or more days past due or in foreclosure.
[7] A six-month period would be January to July, February to August, March to September, etc.
[8] Mortgage Bankers Association, “Delinquencies Increase in Fourth Quarter from Ten-Year Lows, Foreclosure Starts Continue Decline in Latest MBA Mortgage Delinquency Survey,” press release, Feb. 15, 2017. Available at External Linkhttps://www.mba.org/2017-press-releases/february/delinquencies-increase-in-fourth-quarter-from-ten-year-lows-foreclosure-starts-continue-decline-in-latest-mba-mortgage-delinquency-survey.
[9] Ibid.
[10] Federal Reserve Bank of New York, Quarterly Report on Household Debt and Credit (Third Quarter, 2017). Available at External Linkhttps://www.newyorkfed.org/microeconomics/hhdc.html (see, particularly, <Page 3 Data>, “Total Debt Balance and Its Composition” in the data available for download on the website). Aggregate mortgage debt outstanding peaked at $9.3 trillion in mid-2008.
[11] One-person households typically have one vehicle and two-person households typically have two vehicles. Households of greater size usually have children below driving age; the average number of vehicles in a household of seven is 2.8. See Bureau of Transportation Statistics, “Household, Individual, and Vehicle Characteristics.” Accessible at External Linkhttps://www.rita.dot.gov/bts/sites/rita.dot.gov.bts/files/publications/highlights_of_the_2001_national_household_travel_survey/html/section_01.html.
The views expressed are those of the authors and do not necessarily reflect the positions of the Federal Reserve Bank of Kansas City or the Federal Reserve System.