Interest rates on agricultural loans made by commercial banks increased slightly for some types of lending, but remained historically low through the first half of 2021. The average rate on non-real estate loans was about 30 basis points higher than the all-time low reached at the end of 2020 and the uptick was largely consistent across loan types. In contrast, average rates on farm real estate loans continued to decline and marked another historic low. Rates also remained comparatively low at the largest commercial banks and those lenders offered a sizeable discount for the lowest risk loans, while smaller lenders continued to provide similar accommodation regardless of riskiness.
Despite the slight increase in rates for operating loans, the historically low interest rate environment and External Linkmuted demand for agricultural lending suggests that interest expenses have remained low relative to recent years. Profitability in the sector also continued to be supported by strong prices for most major commodities. The slight decline in financing costs for farm real estate may also provide ongoing support External Linkto farmland values. With the exception of some persistent headwinds for the cattle industry and producers impacted by drought, the outlook for the agricultural economy in 2021 remained strong through the second quarter.
Second Quarter National Survey of Terms of Lending to Farmers
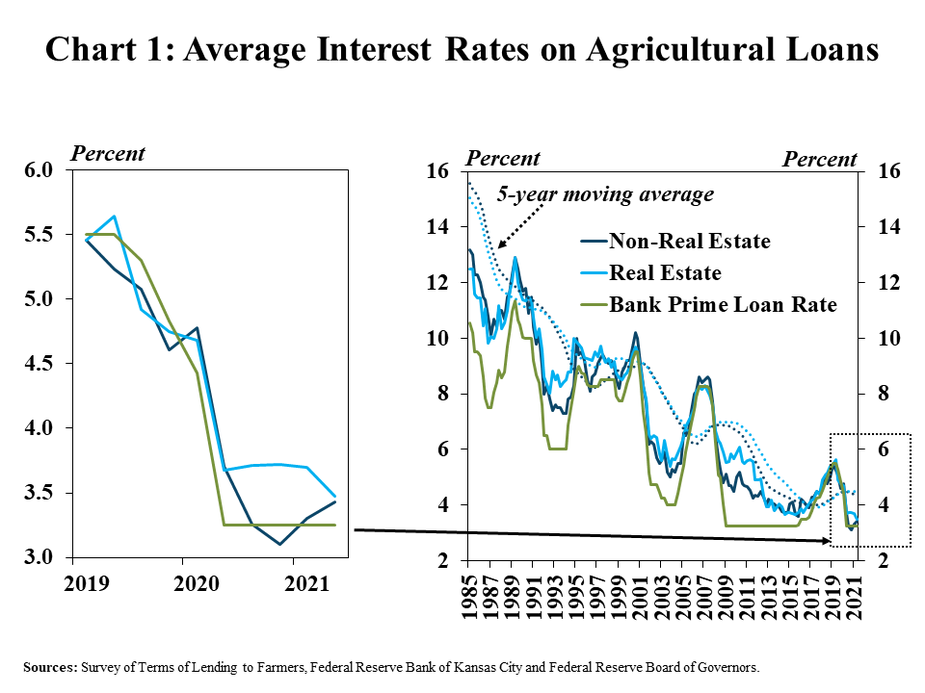
Interest rates on some agricultural loans have increased slightly in recent quarters, according to the National Survey of Terms of Lending to Farmers. The average rate on non-real estate farm loans increased about 30 basis points from the all-time low at the end of 2020 while the average for real estate loans declined further (Chart 1). However, alongside steady benchmark rates, the average cost of financing on all farm loans remained more than 80 basis points less than the recent average and substantially lower than any previous period on record.
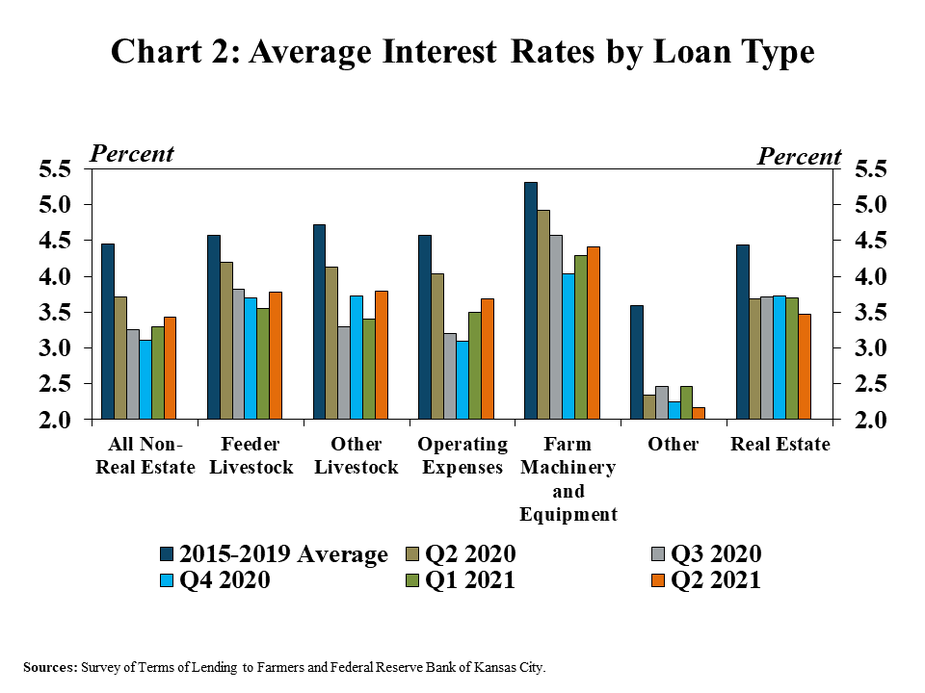
The slight uptick in interest rates for non-real estate loans was consistent across nearly all types of non-real estate lending, but rates also remained well below historic averages. Rates on operating loans increased 60 basis points from the record low reached at the end of 2020 (Chart 2). Rates for farm machinery, feeder livestock and other livestock loans also were higher than recent quarters. In contrast, the average rate on farm real estate loans declined slightly and remained at a historic low.
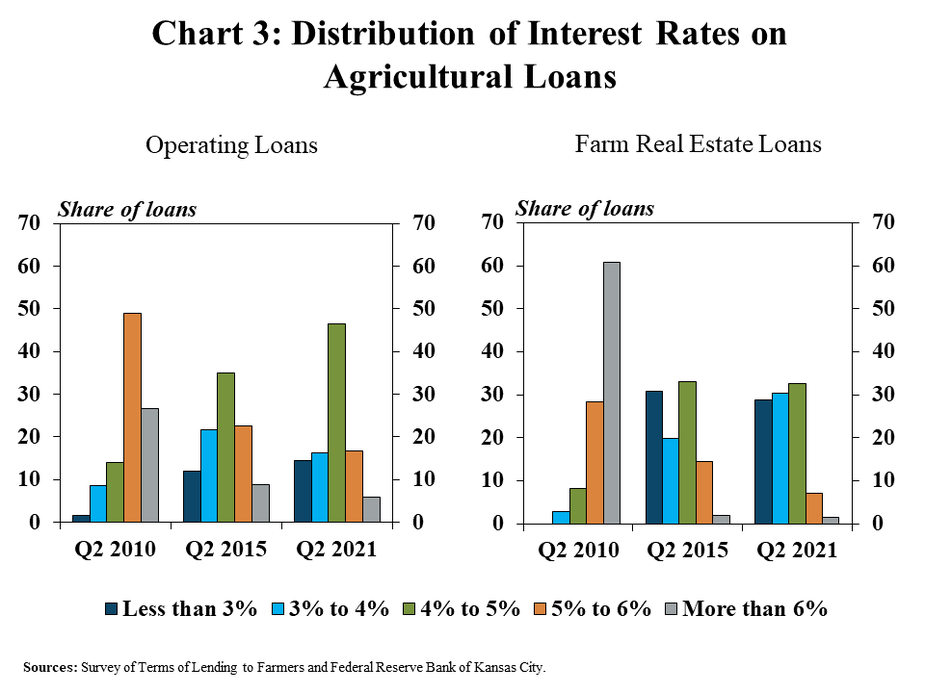
The distribution of rates on operating and real estate loans was similar to five years ago, but starkly different than 10 years ago. About 15% of operating loans had rates less than 3% in the second quarter, compared with 12% of loans the same time in 2015 and 2% of loans in 2010 (Chart 3). Almost a third of farm real estate loans had an interest rate less than 3% in the second quarter of 2021, compared with a similar share in 2015 and none in 2010.
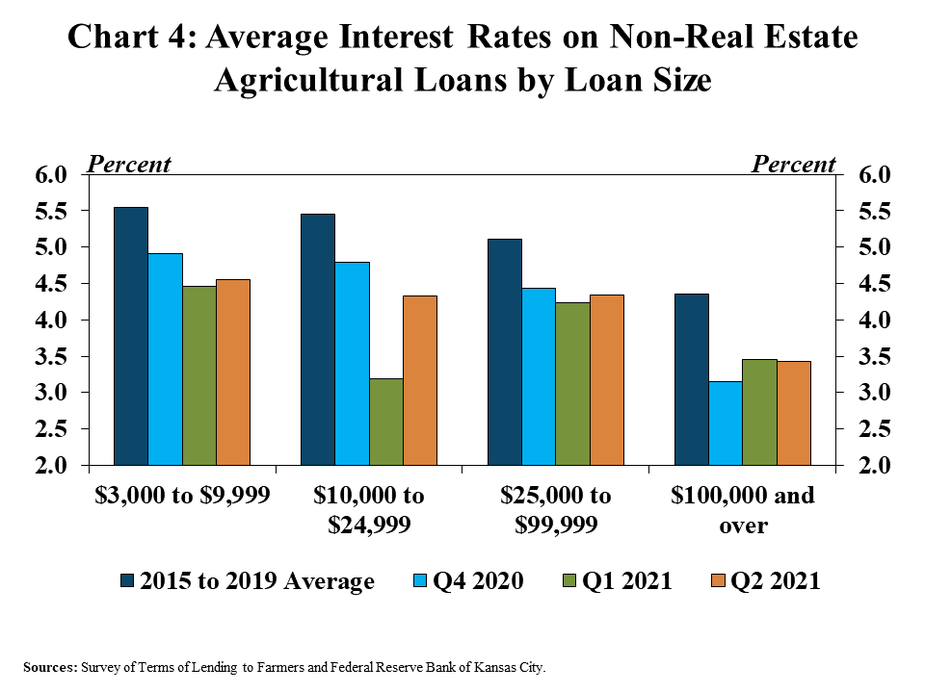
The cost of financing continued to be lower on large loans. Even as rates reached all-time lows for all types of loans, a spread of at least 100 basis points has remained between loans less than $10,000 and loans above $100,000 (Chart 4). Similar to the aggregate average for non-real estate loans, the rates on all loan sizes have increased slightly from the low points in previous quarters.
The largest commercial banks also have continued to book loans with lower rates than other agricultural banks. The average rate on non-real estate loans at the largest banks was more than 150 basis points less than all others (Chart 5). Average rates at small and midsized banks reached all-time lows in the first quarter of 2021 and increased slightly during the second quarter, while rates at the largest lenders continued to decrease.

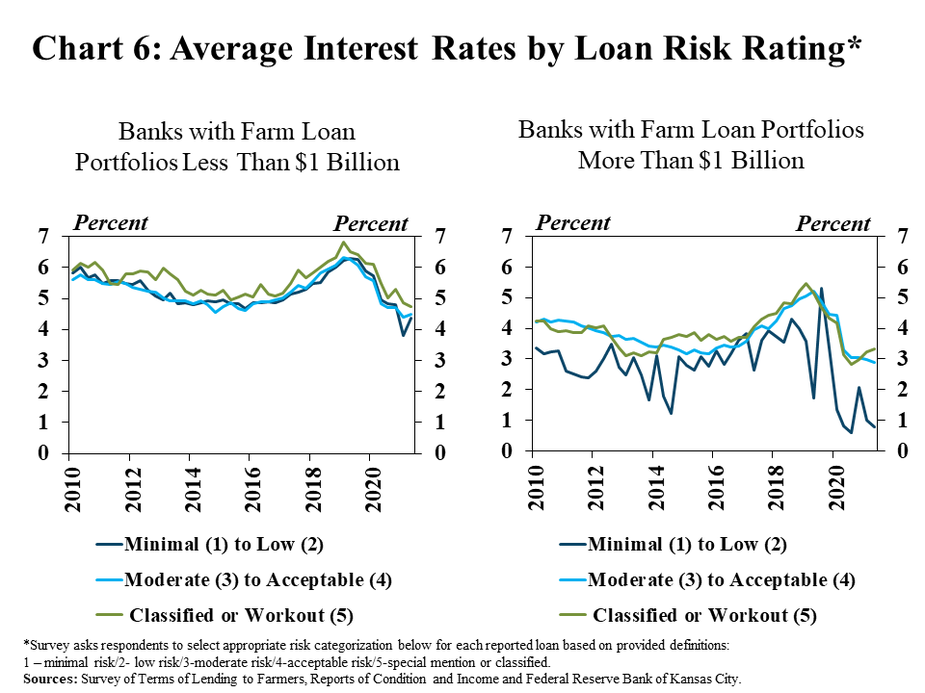
The average interest rate for loans with all levels of risk was notably less than a year ago at lenders of all sizes, but large lenders offered markedly more accommodative terms for the lowest risk loans. Consistent with the prior ten-year period, the smallest lenders offered similar accommodation for low to acceptable risk loans and required only a slightly higher rate for the highest risk credits (Chart 6, left). In contrast, the difference between rates on the lowest risk loans and all other loans at the largest lenders has grown considerably since the beginning of 2020 (Chart 6, right).
Data and Information
National Survey of Terms of Lending to Farmers Historical Data
The views expressed are those of the authors and do not necessarily reflect the positions of the Federal Reserve Bank of Kansas City or the Federal Reserve System.
Authors

Nate Kauffman
Senior Vice President, Economist, and Omaha Branch Executive; Executive Director of the Center for Agriculture and the Economy
