Agricultural debt at commercial banks eased further at the end of 2020, and loan repayment problems moderated slightly. General improvement in the agricultural economy likely drove the pullback in farm lending activity and strengthened credit conditions. Higher crop prices and an influx of government payments in 2020 also contributed stronger growth in deposits, which supported a sharp increase in liquidity at agricultural banks_.
Fourth Quarter Commercial Bank Call Report Data
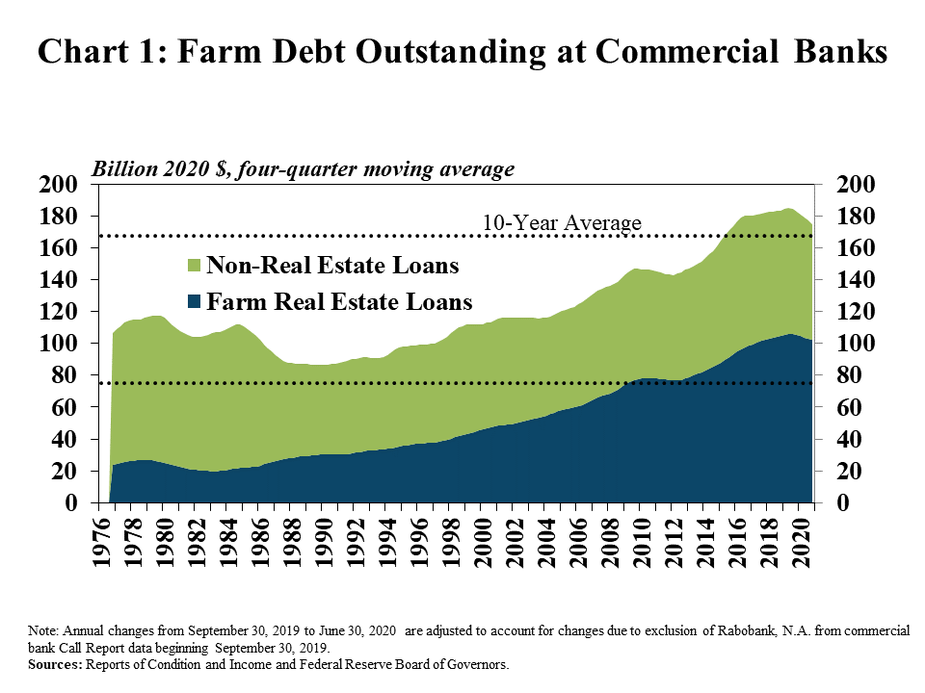
Agricultural loan balances at commercial banks reached a five-year low in the fourth quarter and continued to shift toward farm real estate. Although the accumulation of farm debt remained higher than the average of the past ten years, the total value of farm loan portfolios fell 5% from the previous year (Chart 1). Moreover, loans to purchase farmland accounted for 57% of total loan volumes, which was the highest allocation for real estate loans on record.
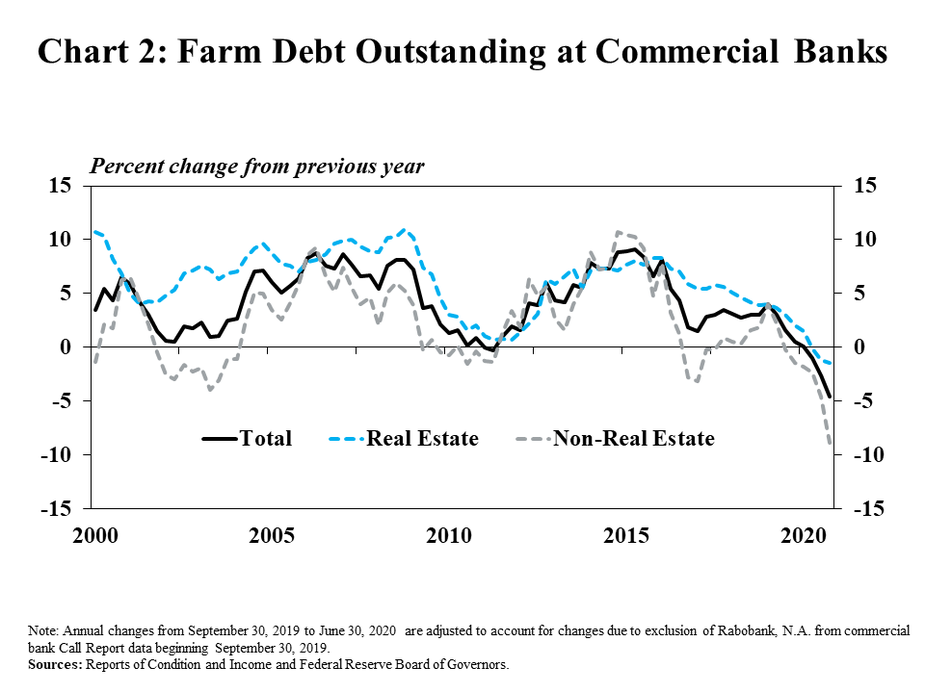
Total farm debt decreased at the fastest pace since the 1980s, with continued declines in both farm real estate and production loans. In the fourth quarter, the drop in total farm debt was driven by a 9% decline in non-real estate loans and a 1% decline in real estate loans (Chart 2). Although the decline in loans to finance farm real estate remained small, it was the first time farmland loans decreased for three consecutive quarters since 1981.
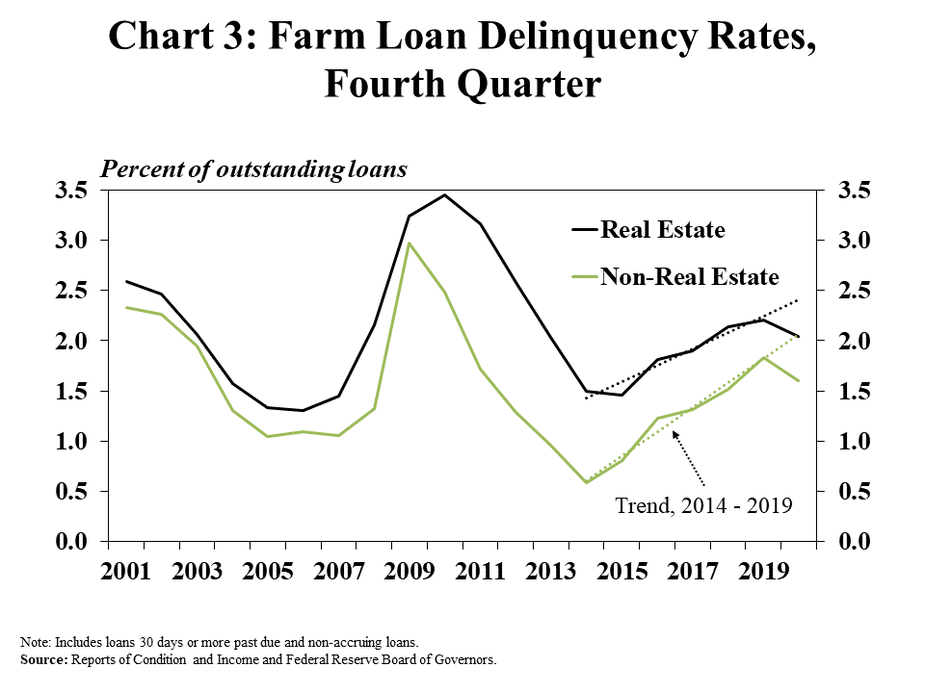
Alongside better farm financial conditions and lower debt levels, delinquency rates on agricultural loans declined from a year ago. From 2014 to 2019, delinquency rates on farm loans grew by about 0.2 percentage points per year in the fourth quarter, on average. (Chart 3). However, the share of real estate and non-real estate loans past due fell 0.16 and 0.24 percentage points, respectively, from the previous year in 2020, which was a notable reversal of the previous trend.
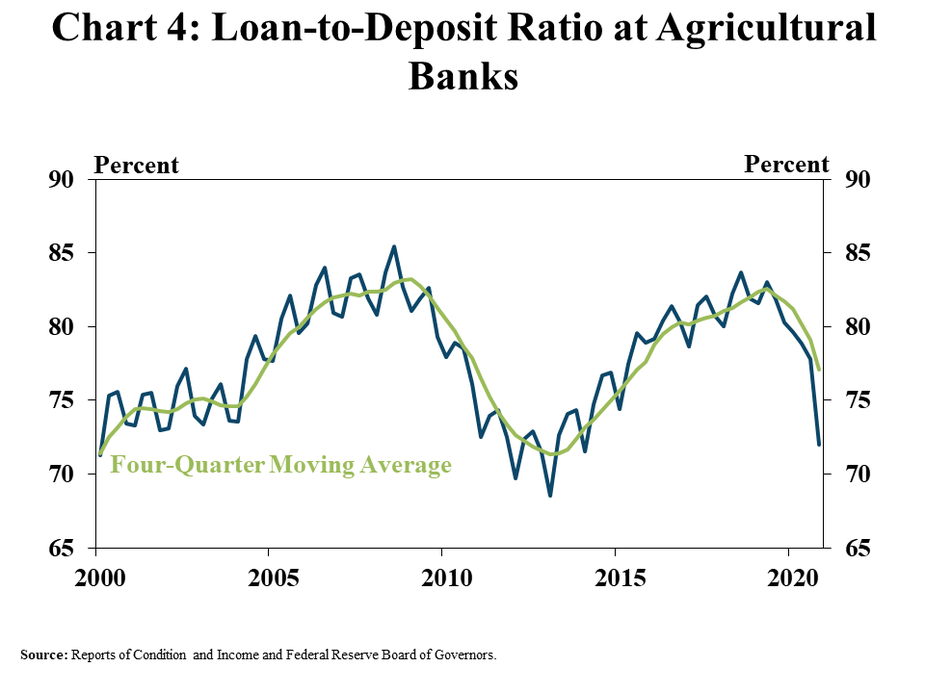
In contrast to recent years, liquidity at agricultural banks surged in 2020. Total deposits at agricultural banks increased almost 3% from the previous year in the fourth quarter. In addition, total loans outstanding decreased nearly 8%. The strong growth in deposits combined with the decline in loan balances led to a significant decline in loan-to-deposit ratios (Chart 4).
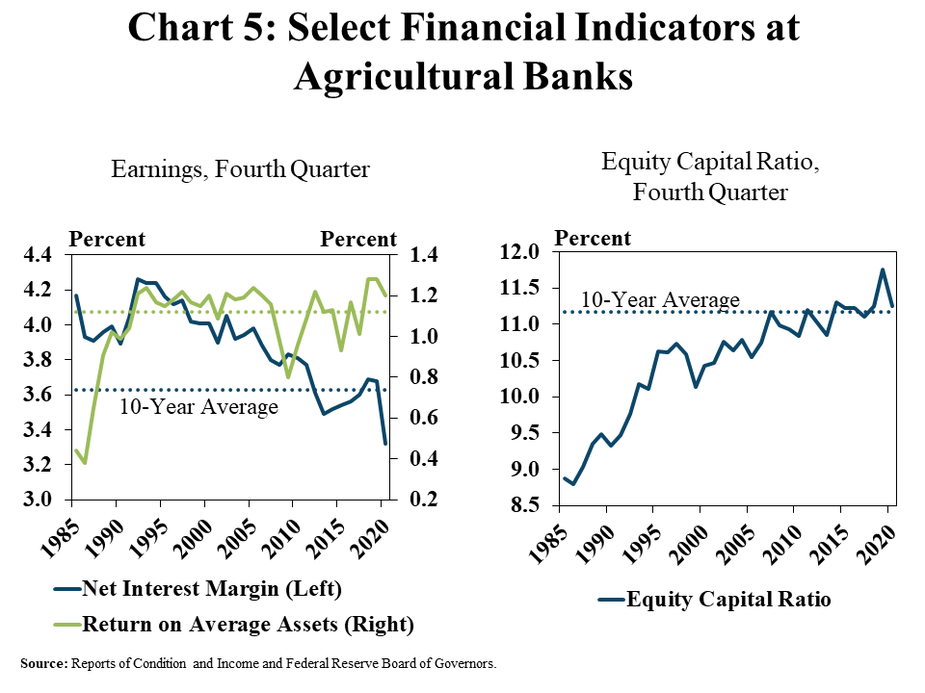
Agricultural banks remained financially strong, despite a historically low net interest margin. Interest income decreased more than interest expense and asset balances increased at agricultural banks in 2020, driving a sharp decline in the net interest margin (Chart 5). A tighter margin likely put some downward pressure on income and the ability to grow capital stocks. However, the return on assets and the equity capital ratio at agricultural banks remained historically high.
Conclusion
Farm debt outstanding at commercial banks continued to decline through the end of 2020. The pace of decline increased slightly from the previous quarter and agricultural loan balances dropped closer to the ten-year average. Alongside general improvement in the farm economy and a pullback in lending, bank liquidity surged, supporting a stronger outlook for loan performance. Moving forward, the pace of lending to farmers may remain slower than in previous years, as 2020 government payments and recent strength in crop prices have improved borrower liquidity and farm balance sheets.
Data and Information
Commercial Call Report Data Historical Data
Endnotes
-
1 Agricultural banks include all banks with agricultural loans comprising at least 25 percent of total loans in each quarter. The panel of agricultural banks is specific to each quarter and data are not adjusted to account for banks meeting the agricultural bank threshold in any previous quarter, but not the current quarter.
The views expressed in this article are those of the authors and do not necessarily reflect the views of the Federal Reserve Bank of Kansas City or the Federal Reserve System.
Authors

Cortney Cowley
Assistant Vice President and Oklahoma City Branch Executive
