Farm real estate values increased considerably in 2022 but showed signs of softening during the final months of 2022 as interest rates rose sharply. Interest rates on farm loans jumped to decade highs alongside increases in the federal funds rate. While the value of most types of farmland continued to rise, the increase was the slowest since early 2021. Agricultural credit conditions remained strong in the fourth quarter and continued to be bolstered by broad strength in the farm economy throughout 2022.
The outlook for agricultural credit conditions looking ahead into 2023 also remained generally positive, despite some ongoing concerns. Elevated commodity prices continued to support profit opportunities for many producers across the farm sector, but concerns about operating expenses, higher interest rates and intense drought persisted. While improvement in farm income and credit conditions has softened slightly in recent months, farm finances remained strong following especially strong agricultural economic conditions the past two years.
Fourth Quarter Federal Reserve District Ag Credit Surveys
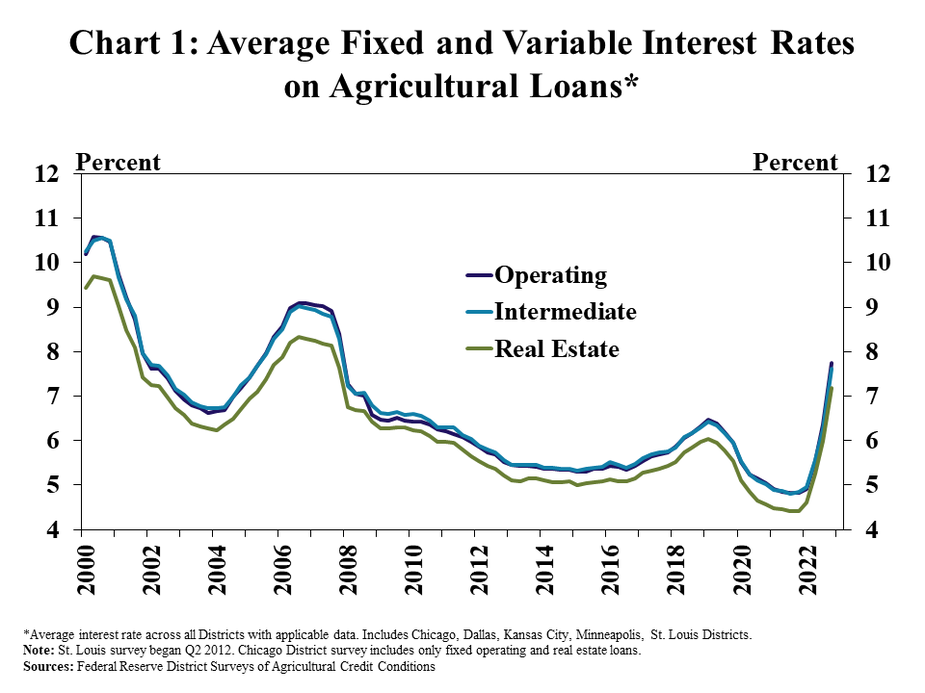
Interest rates on farm loans jumped to decade highs as benchmark rates rose further. The average rate charged on agricultural loans at banks in reporting Federal Reserve Districts increased nearly 150 basis points from the previous quarter and were about 300 basis points higher than the same time a year ago (Chart 1). Rates rose to the highest level since 2008 and pushed up financing costs considerably.
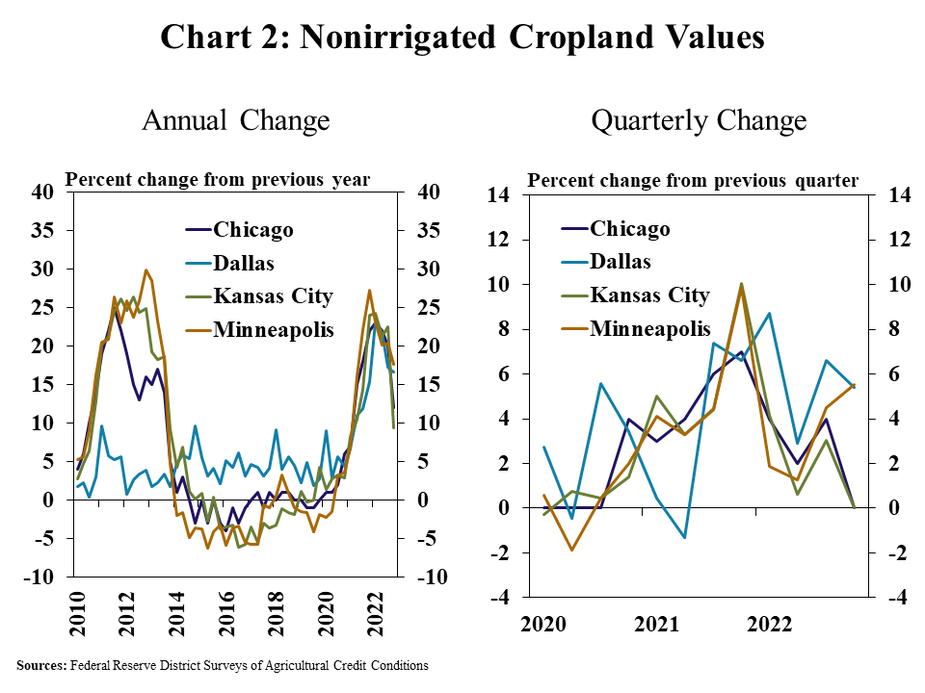
Farmland values increased sharply in 2022, but growth slowed during recent quarters in some regions alongside higher interest rates. The value of nonirrigated cropland increased by an average of 15% from the previous year across all regions, following growth of more than 20% in early 2022 (Chart 2, left panel). The average value of cropland was unchanged from the previous quarter in the Chicago and Kansas City Districts, but increased at a pace similar to the past year in the Dallas and Minneapolis regions (Chart 2, right panel).
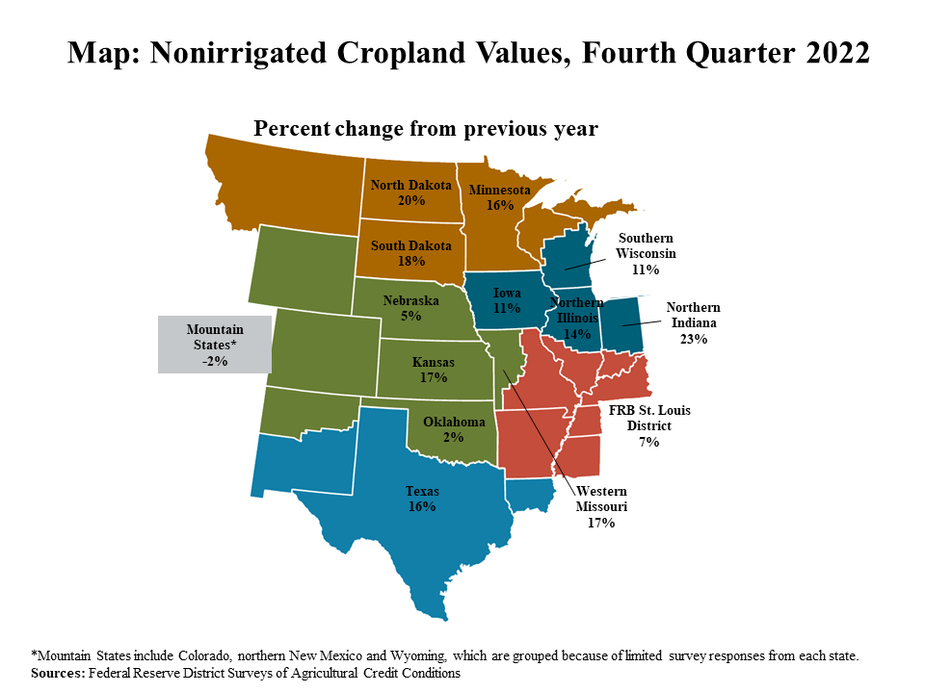
Growth in agricultural real estate values remained strong, but slowed more notably in some states. Nonirrigated cropland values grew by more than 15% in about half the states within the participating Federal Reserve Districts, but also increased less than 15% in half of states (Map). In some areas, the growth in farmland values has softened most for lower-priced land and in states most heavily affected by drought.
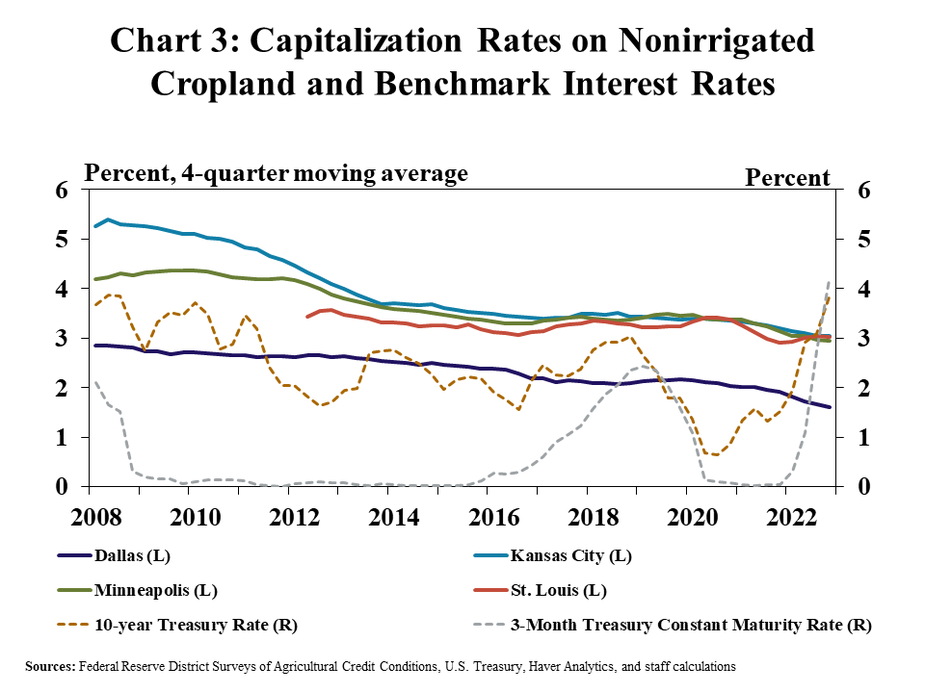
Benchmark interest rates surpassed returns to farmland owners in recent months, which could put some downward pressure on growth in farmland values going forward. Capitalization rates, calculated as the ratio of cash rents to farmland values, have decreased continuously over the past 15 years._ In the Kansas City region, capitalization rates fell from 5.4 percent in 2009 to 3 percent at the end of 2022 (Chart 3). Returns on farmland have been comparatively lower in the Dallas region and recently fell below 2 percent. Conversely, risk-free rates of return rose dramatically in 2022, and the average yield of a 3-month Treasury was 4.2 percent at the end of the year.
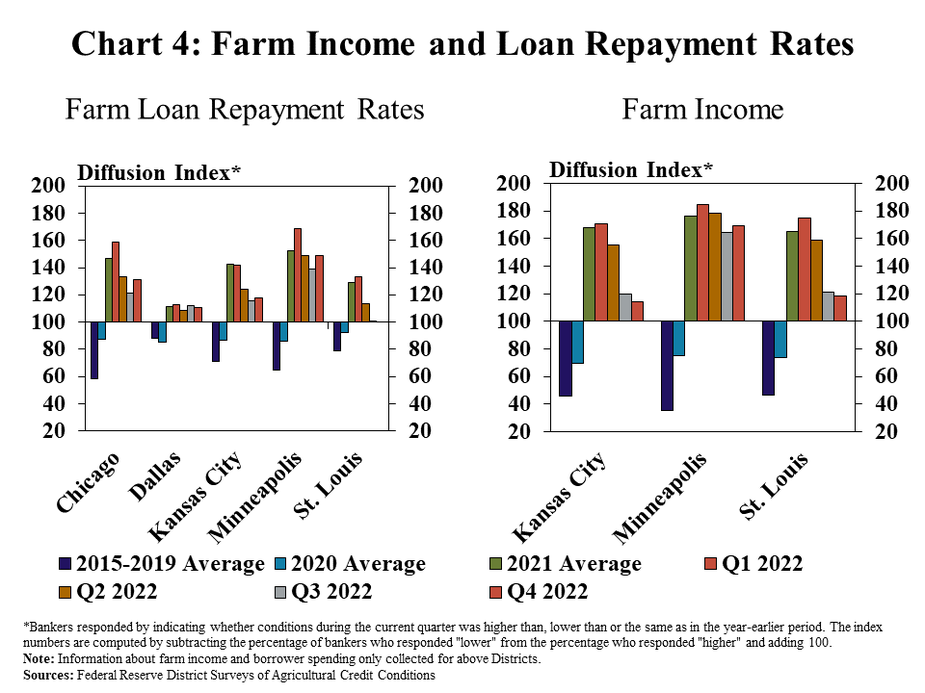
Strong farm income supported agricultural credit conditions throughout the year, but improvement softened in some regions. Bankers continued to report increases in farm income and loan repayment rates, but the pace of increase slowed at the end of 2022 in some areas (Chart 4). The pace of improvement has slowed most notably in the Kansas City and St. Louis Districts, while remaining steadier in the Minneapolis and Dallas Districts.
Endnotes
-
1 Capitalization rates approximate the annual rate of return a buyer or investor expects to receive on farm real estate; lower capitalization rates imply that land owners are receiving lower returns on capital invested in farmland. For more information, see The Outlook for Farmland Values amid Higher Interest Rates (Cowley 2019).
Data and Information
Federal Reserve Ag Credit Surveys Historical Data
Federal Reserve Ag Credit Surveys Tables
About the Federal Reserve Ag Credit Surveys
The views expressed are those of the authors and do not necessarily reflect the positions of the Federal Reserve Bank of Kansas City or the Federal Reserve System.
Authors

Cortney Cowley
Assistant Vice President and Oklahoma City Branch Executive
