Growth in farm real estate values remained strong, but showed signs of easing alongside higher interest rates. The average interest rates on farm loans increased from record lows at the beginning of the year to decade highs by December. Despite the rapid rise in rates, the value of farmland continued to increase, but at a more tempered pace than earlier in the year. The growth in farmland values has softened most for lower-priced land and in states most heavily affected by drought. Looking ahead, a majority of bankers expect higher interest rates to have a negative effect on farm real estate and some anticipated a decline in values.
Farm finances and credit conditions were supported by strong commodity prices in 2022 and the outlook for 2023 remained positive despite some persistent risks. Elevated prices for most major commodities continued to support profit opportunities for many producers, but higher expenses and adverse weather conditions remained key concerns. Cost pressures have been particularly notable for livestock producers in recent months and higher expenses across the sector are likely to increase demand for financing. Farm income and liquidity remained strong through the end of the year, but improvement slowed in the fourth quarter and bankers in some areas of the region were less optimistic about the outlook for the months ahead.
Interest Rates and Farmland Markets
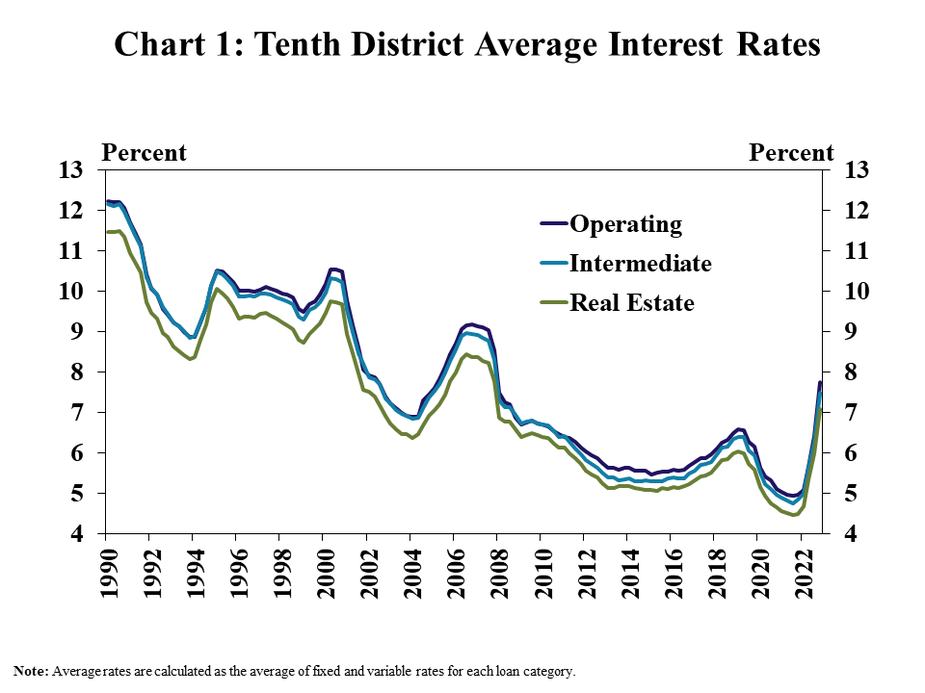
Farm loan interest rates increased sharply alongside benchmark rates and reached the highest levels in a decade. Average interest rates on all types of loans were more than 100 basis points higher than the previous quarter, marking the third consecutive quarter of sharp rate hikes (Chart 1). Interest rates on farm loans reached the highest levels since 2007, putting considerable upward pressure on financing costs for some producers.
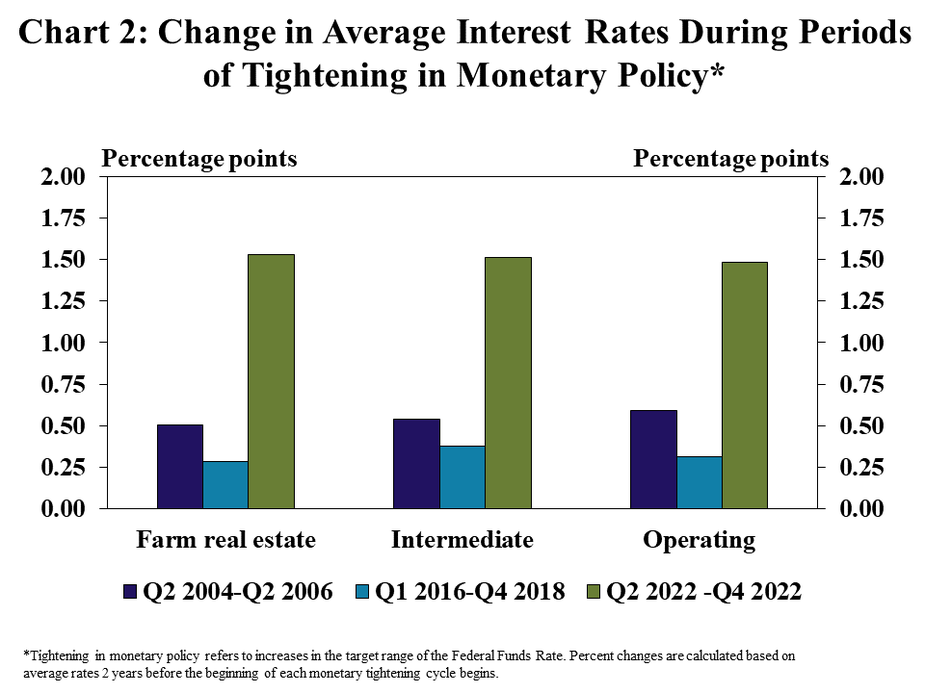
Interest rates on agricultural loans have risen notably faster in recent months than during periods of more tempered increases in benchmark rates. Average farm loan interest rates increased more than 150 basis points since the Federal Funds Rate increased from near zero early in 2022 (Chart 2). In comparison, rates on farm loans rose by only about 30 basis points over the 2-year period of increases in benchmark rates from 2014 to 2016 and only about 55 basis points during the 3-year period of rate increases from 2004 to 2006.
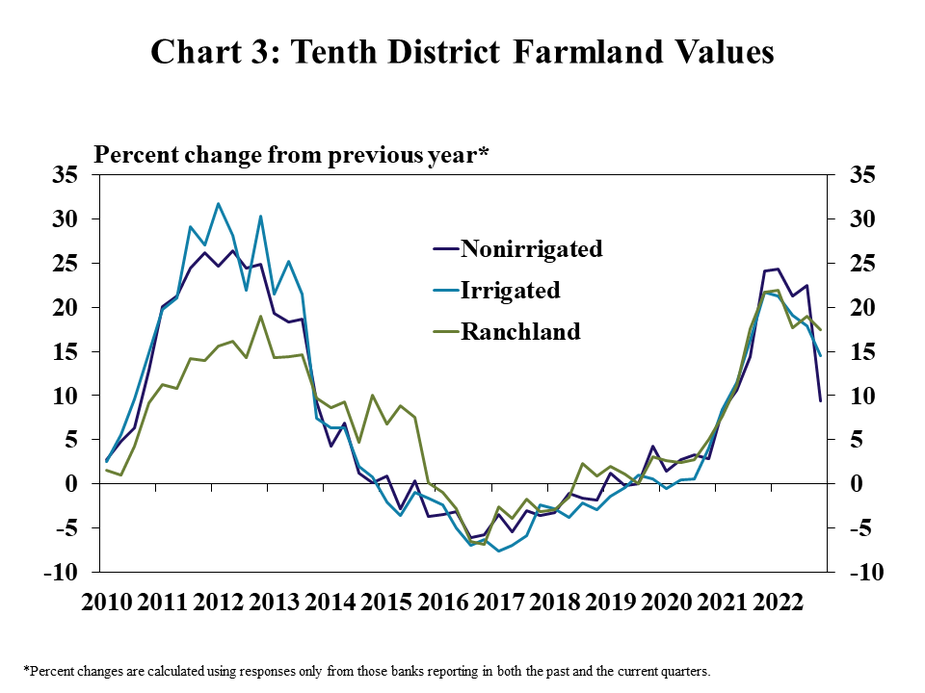
Farmland values continued to increase despite the rapid increase in interest rates, but showed further signs of softening. The value of nonirrigated farmland increased about 9% from the previous year, the slowest pace since early 2021 (Chart 3). While the majority of respondents continued to report additional increases in land values, about a quarter of bankers indicated that the average value of nonirrigated farmland was at least slightly less than a year ago.
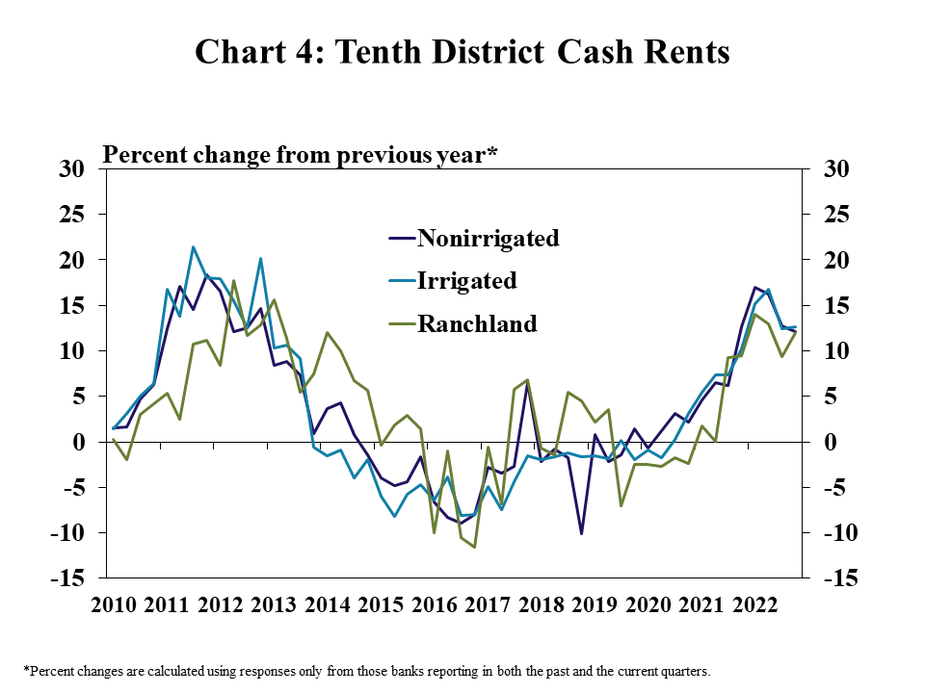
Cash rents also continued to increase and showed less pronounced signs of softening than farmland values. Rental rates on all types of farmland increased about 12% from the previous year, which was a pace similar to previous quarters (Chart 4). Following rapid acceleration in farmland values earlier in 2022, rents continued to rise more steadily through the fourth quarter.
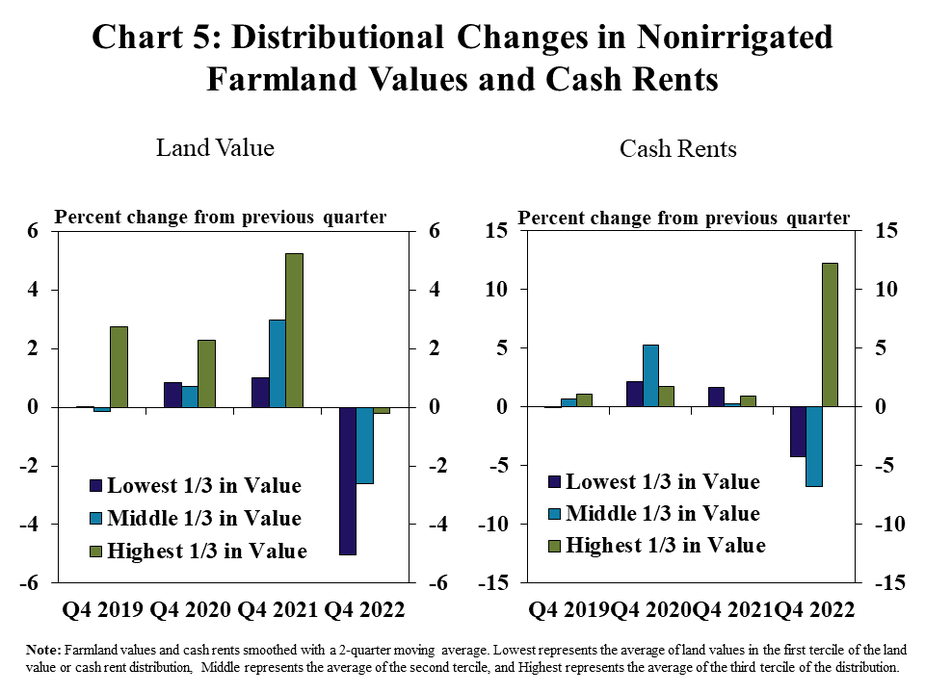
Signs of softening growth in farm real estate values and cash rents was most pronounced for the lowest priced land in the fourth quarter. The lowest priced farmland lost almost 5% in value compared to the previous quarter, while the highest priced farmland remained nearly unchanged (Chart 5, left panel). Similarly, the highest cash rents grew by more than 10% over the quarter while the lowest rents declined by about 4% (Chart 5, right panel).
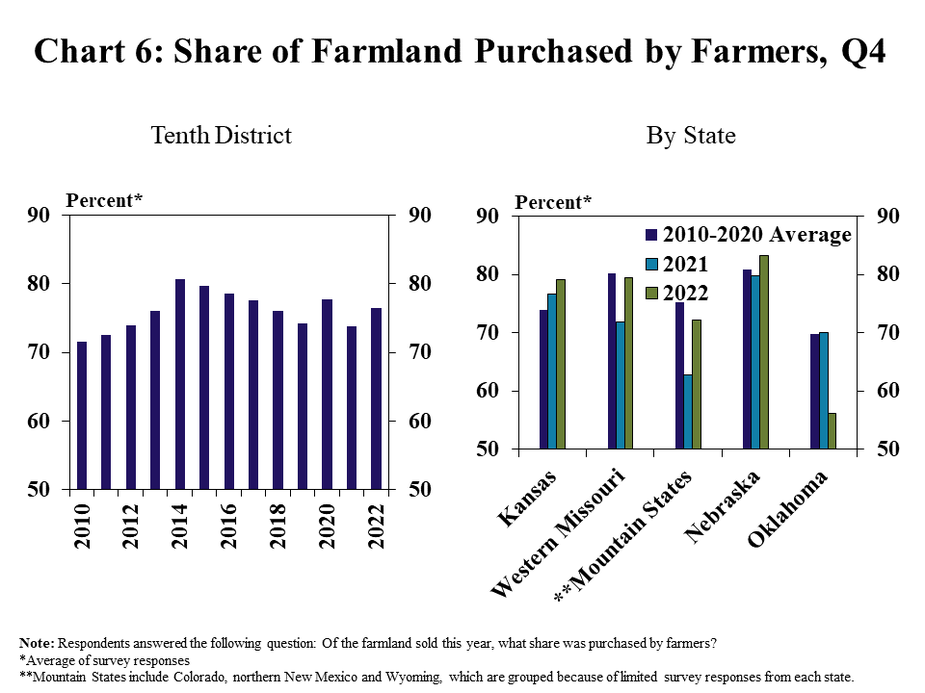
Alongside considerable improvement in farm finances the past two years, farmers in the District remained active buyers of land. Farmers accounted for more than 75% of farmland purchases in 2022, a slightly higher share than in 2021 (Chart 6, left). Contacts from most states in the District reported an increase in the share of purchases made by farmers compared with last year, with the exception of Oklahoma (Chart 6, right).
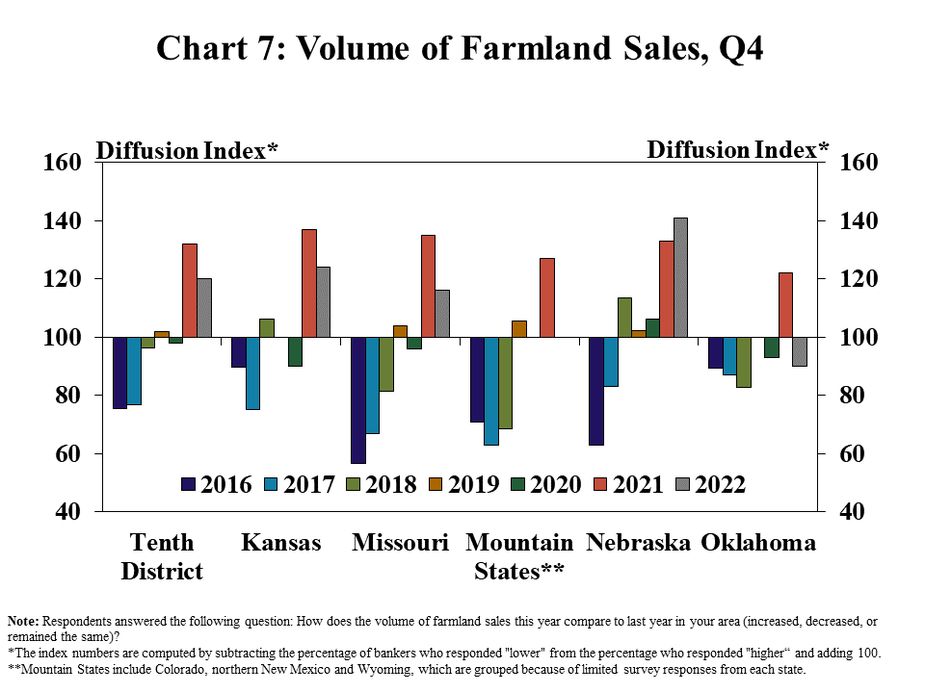
As demand for farmland remained high, the volume of land sales also increased steadily across most states in the region. Contacts in Kansas, Missouri, and Nebraska reported that the volume of sales in 2022 was higher than a year ago, following a similar increase in 2021 (Chart 7). In contrast to other states, the volume of sales was less than a year ago in Oklahoma and unchanged in the Mountain States, where persistent drought has had a more pronounced impact on the farm economy.
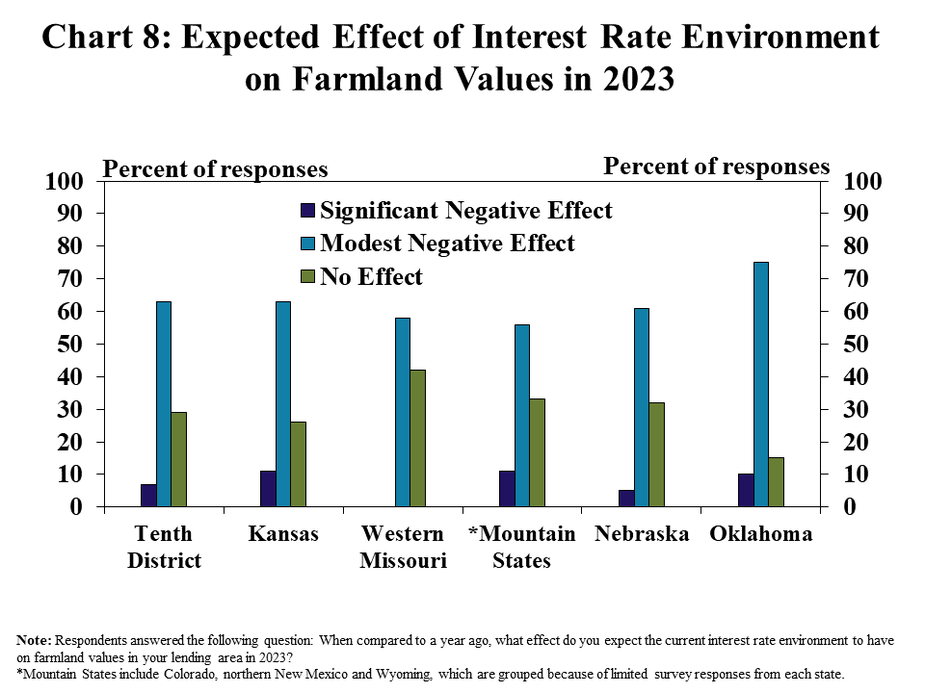
Strong market conditions supported considerable growth in farmland values the past two years, but the rapid rise in interest rates during recent months was expected to have a negative effect going forward. About 70% of all respondents in the District thought the effect of the current interest rate environment on farmland values would be at least modestly negative in 2023 (Chart 8). The anticipated impact was slightly more pronounced in Oklahoma and Kansas than in other states.
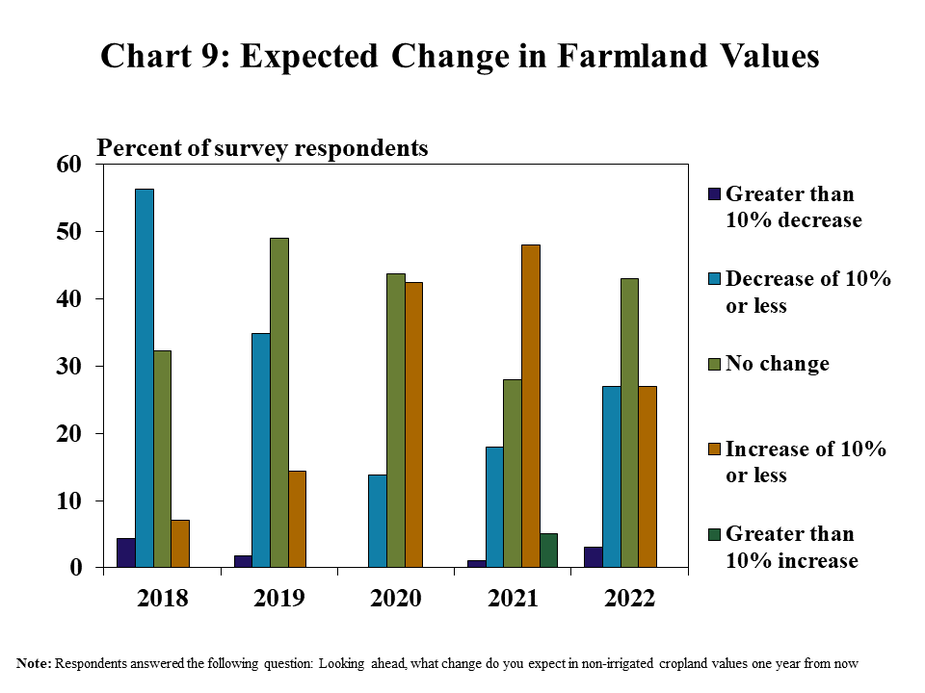
Alongside potential effects associated with higher interest rates, bankers were less optimistic about the outlook for land values than in recent years. Nearly 30% of bankers reported that farmland values were expected to decline in the year ahead, the largest share since 2019 (Chart 9). Despite the less optimistic outlook, 30% of bankers still expected land values to increase in 2023 and a slight majority anticipated no change.
Farm Income and Credit Conditions
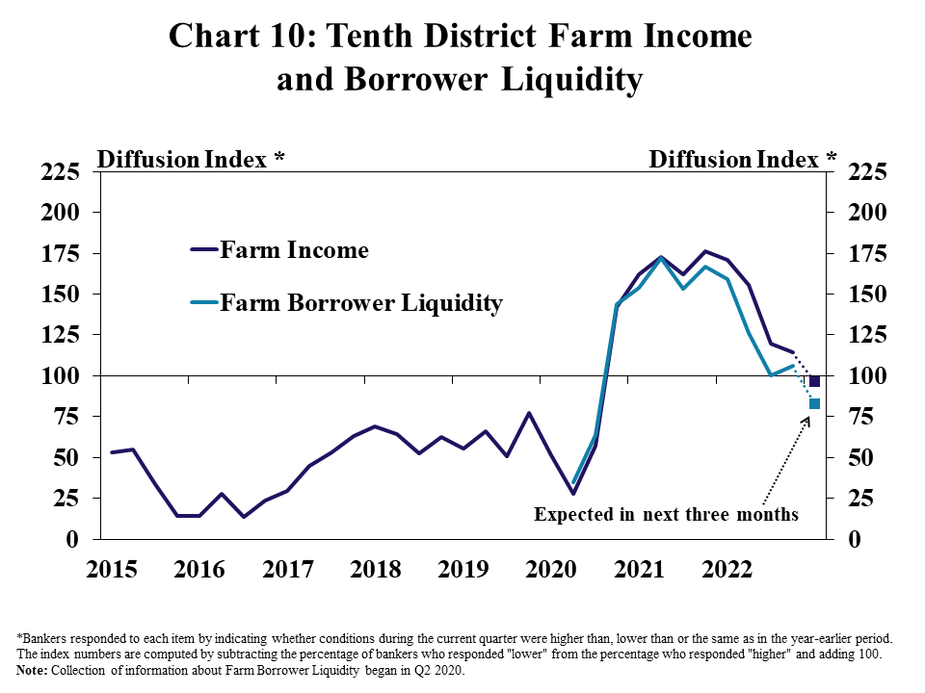
Farm finances remained strong alongside elevated commodity prices, but the pace of improvement eased. Farm income and liquidity increased from a year ago for the ninth consecutive quarter, but the pace of growth was the slowest since finances were deteriorating in early 2020 (Chart 10). A modest share of banks in areas more impacted by drought reported that farm income and liquidity were less than a year ago and looking ahead, conditions in the District were expected to deteriorate slightly.
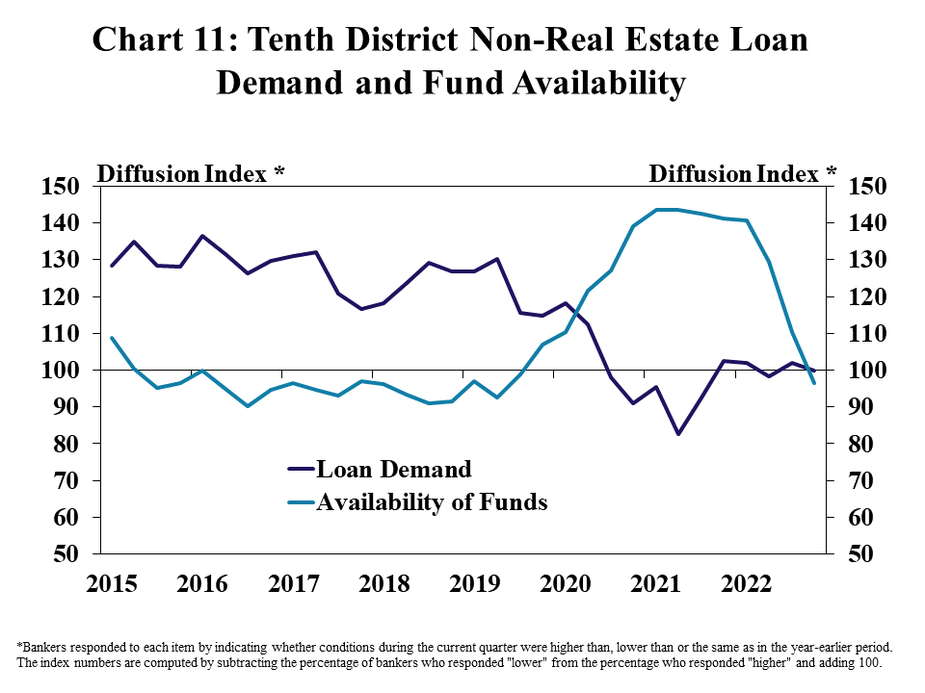
Demand for farm loans remained steady, but growth in funds at agricultural banks slowed considerably. Farm loan demand across the District was nearly unchanged from a year ago, with an equal share of bankers reported higher and lower financing needs from producers (Chart 11). Following rapid growth in liquidity alongside a surge in deposits in recent years, availability of funds was less than a year ago for the first time since 2019.
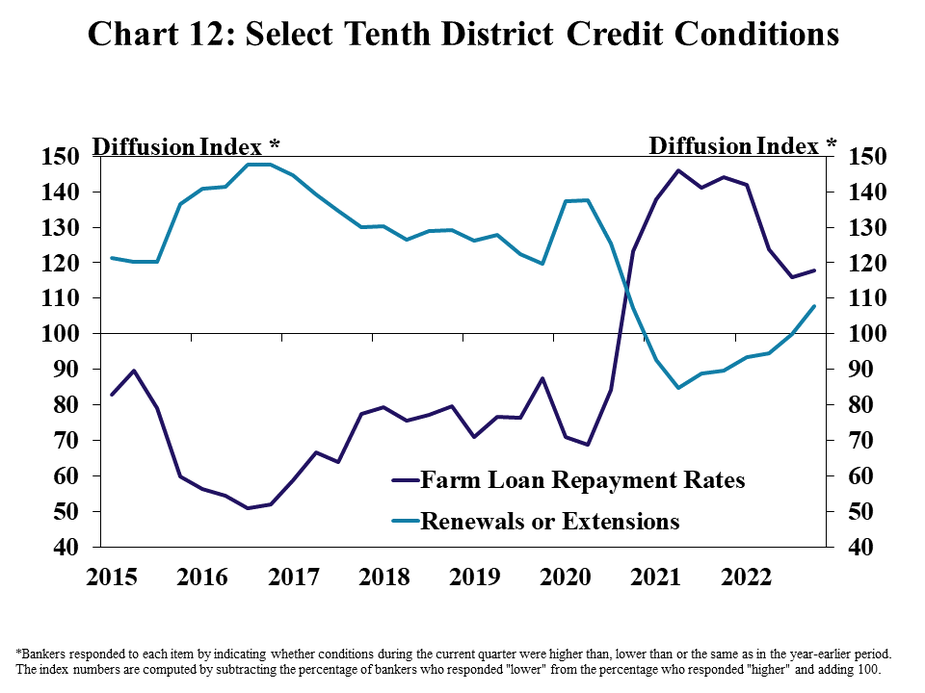
Credit conditions continued to improve gradually alongside ongoing strength in farm income. Multiple years of strong farm income has bolstered the financial position of many producers and farm loan repayment rates continued to improve at a gradual pace (Chart 12). However, as growth in farm income and liquidity softened, renewal and extension activity in the region was slightly higher than a year ago.
Banker Comments
“The continued increase of interest rates is greatly hurting farmers and ranchers that need to borrow funds for operating until they sell their crops or livestock” – Northern Colorado
“Disaster payments have come in and reduced loans outstanding, but drought is causing whole herd dispersions and sales; the most I have seen in 36 years.”– Northwest Colorado
“Higher interest rates have stalled serious lending for farmers to purchase.”– Northeast Kansas
“We have noticed a decrease in working capital position on the few renewals we have completed so far. Drought is a continuing concern and higher interest rates are having an effect on capital purchases, upgrades to equipment and possibly expansion.”– Southwest Kansas
“Inflation has impacted every sector, and its impact on household spending is most noticeable. At the same time, farmland sales have hit record level pricing and purchases are being made by strong farmers.”– Central Missouri
“Although higher interest rates should negatively impact the demand and values of farmland being sold, it hasn’t impacted the valuations yet. In fact, farmland has been selling higher than ever and farmers have a lot of liquidity and must be looking to real estate as a good long-term investment.”– Western Missouri
“Dry summer conditions caused cow/calf operations to reduce herds and tight hay supplies and high-priced feed alternatives led many ranchers to wean early and sell lighter calves earlier.”– Northcentral Nebraska
“Higher interest rates will not impact producer profitability right away, but it may begin to slow the run-away land market, which remains very hot.”– Southern Nebraska
“Drought hit southeast Oklahoma in a negative way and ag customers have been short on water and hay. About 90% of my ag customers that are short on hay.” Southeast Oklahoma
“Drought is the biggest concern and high input costs are right up there as well. If grain prices go down, then it could be a big problem for a lot of producers.” Northwest Oklahoma
Data: Credit Conditions | Fixed Interest Rates | Variable Interest Rates | Land Values
A total of 142 banks responded to the Fourth Quarter Survey of Agricultural Credit Conditions in the Tenth Federal Reserve District—an area that includes Colorado, Kansas, Nebraska, Oklahoma, Wyoming, the northern half of New Mexico and the western third of Missouri. Please refer questions to Francisco Scott, economist or Ty Kreitman, assistant economist at 1-800-333-1040.
The views expressed are those of the authors and do not necessarily reflect the positions of the Federal Reserve Bank of Kansas City or the Federal Reserve System.
Authors

Francisco Scott
Senior Economist
