Farm lending activity continued to increase gradually alongside further growth in loan sizes. The average size of non-real estate farm loans was about 20% higher than a year ago and drove an increase in lending volumes for the fourth consecutive quarter. At the same time, average interest rates on farm loans rose sharply alongside higher benchmark rates and reached a 10-year high, putting additional upward pressure on financing costs.
The outlook for farm finances remained favorable alongside elevated commodity prices, but increased interest rates, challenging weather conditions, and high production costs remained key concerns. Higher expenses contributed to a rebound in lending during 2022, but strong farm income and liquidity likely has limited financing needs of many producers. Looking ahead, however, elevated operating expenses could put additional upward pressure on loan demand.
Fourth Quarter National Survey of Terms of Lending to Farmers
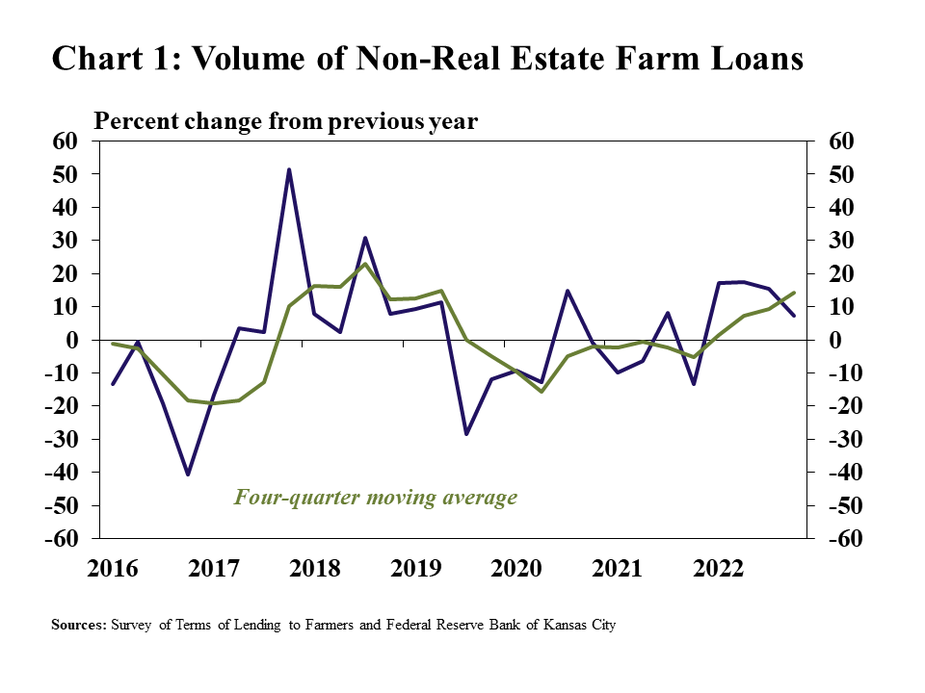
The volume of non-real estate farm loans at commercial banks increased steadily through the end of 2022. Lending activity was 7% higher than a year ago and grew at an average pace of about 15% over the past year (Chart 1). The growth continued to be driven by larger-sized operating loans and also was boosted by an increase in feeder livestock loans.
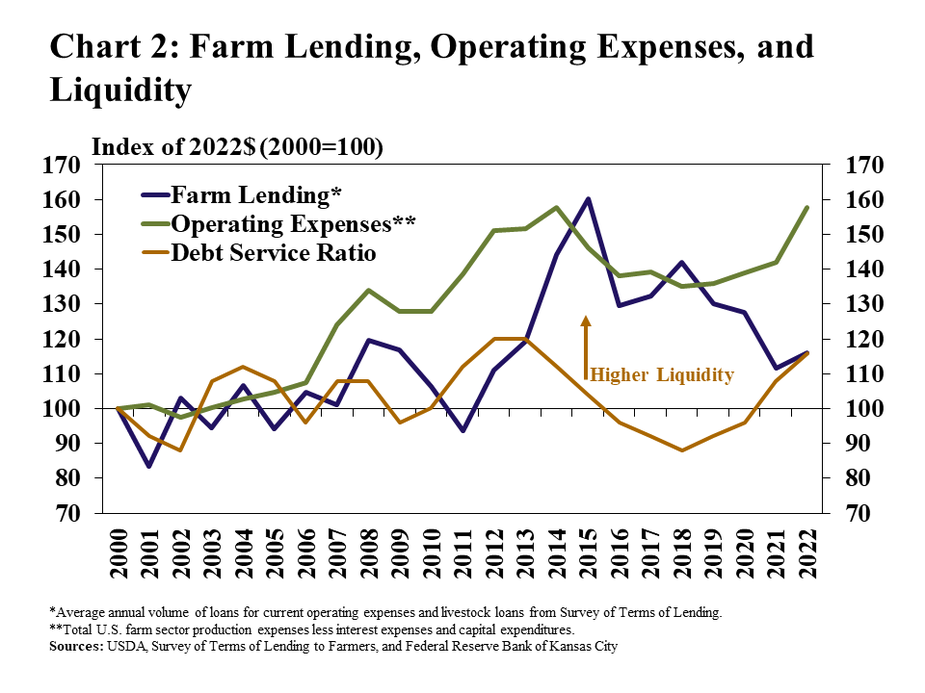
Farm lending historically has increased alongside higher production costs, but strong liquidity likely has curbed some demand the past two years. Production expenses across the farm sector have increased nearly 15% since 2020 while farm lending declined about 10% (Chart 2). Working capital on farms increased nearly 60% over that time, reducing borrowing needs for many producers and strengthening their ability to service debt.
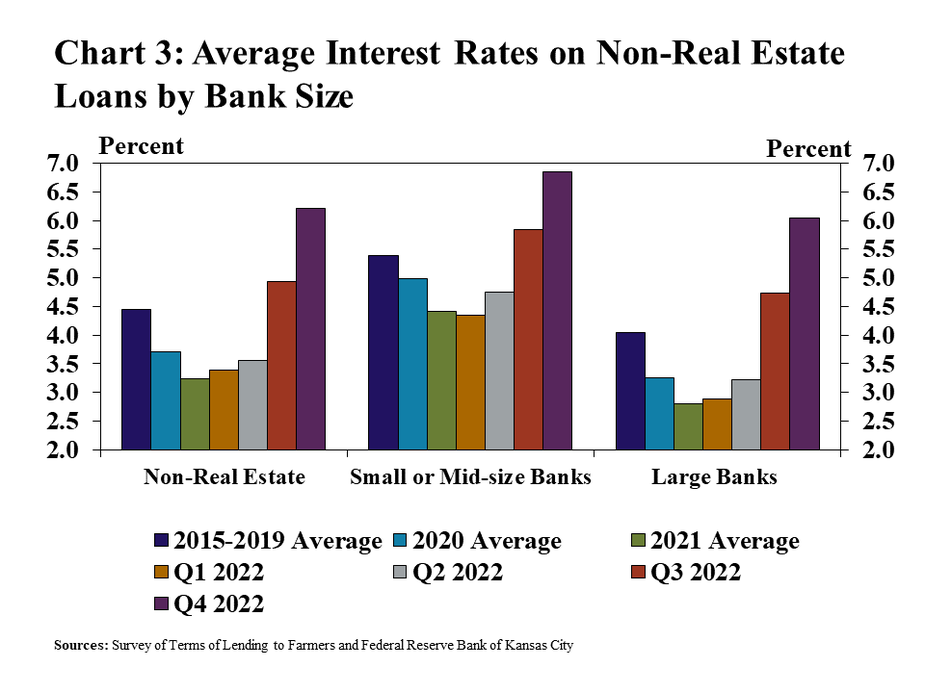
Interest rates on farm loans rose rapidly again in the fourth quarter and the spread between rates offered at large and small banks narrowed. Rates on non-real estate farm loans increased by an average of about 125 basis points from the previous quarter (Chart 3). Financing charges have risen more rapidly among large farm lenders than small or mid-sized banks during recent months and the difference between average rates charged by those groups reached the lowest level since 2007.
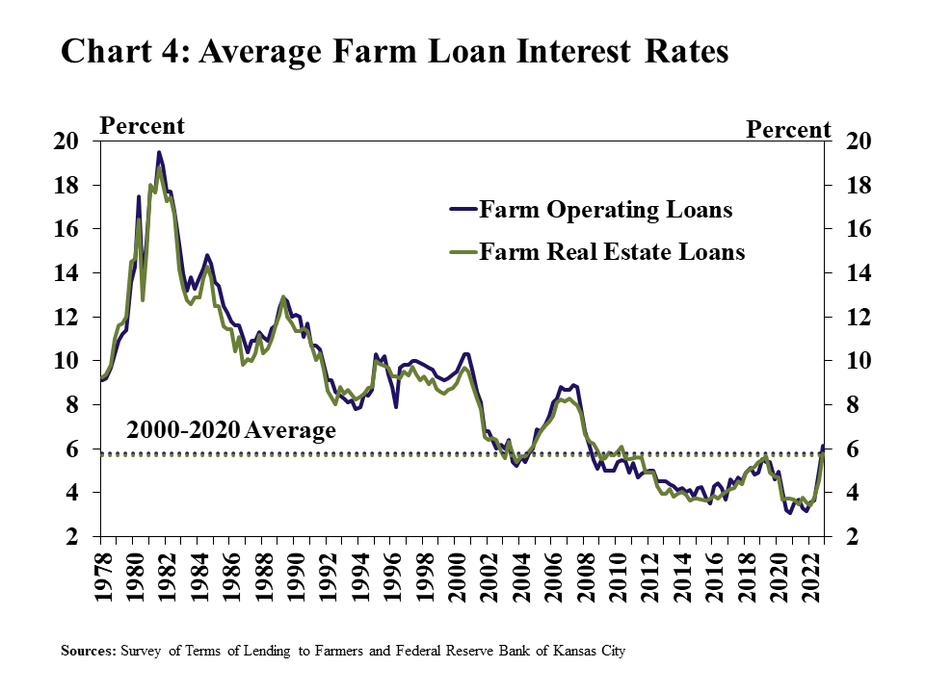
Despite increasing sharply over the past year, farm loan interest rates remained near the recent historic average. Rates charged on both real estate and non-real estate loans reached the highest level in more than a decade but were near the average of the past 20 years (Chart 4). The rapid rise has pushed financing costs up notably for producers, and the increase could be more pronounced for operations with higher debt needs.
Data and Information
National Survey of Terms of Lending to Farmers Historical Data
National Survey of Terms of Lending to Farmers Tables
About the National Survey of Terms of Lending to Farmers
The views expressed are those of the authors and do not necessarily reflect the positions of the Federal Reserve Bank of Kansas City or the Federal Reserve System.
Authors

Cortney Cowley
Assistant Vice President and Oklahoma City Branch Executive
