Smaller sized loans limited agricultural lending activity at the end of 2021. According to the Survey of Terms of Lending to Farmers, non-real estate agricultural loans at commercial banks decreased by 13% in the fourth quarter and the yearly average was the lowest since 2012. The decline was driven by a sharp drop in operating loans and lending at banks with the largest farm loan portfolios. Despite an increase in the number of all types of loans, the average size of all non-real estate and operating loans was more than 20% and 30% less than a year ago, respectively. Loan sizes decreased considerably at lenders of all sizes, but the number of loans increased notably at small and mid-sized lenders and decreased at banks with large agricultural portfolios.
Broadly, conditions in the agricultural economy remained strong through 2021 and continued to support farm finances. Despite intensifying concerns about rising input costs impacting producer returns in the coming year, commodity prices remained elevated and supported profit opportunities through the end of the year. Higher costs are likely to put upward pressure on demand for credit, but strong farm income and working capital could also supplement financing for some borrowers.
Fourth Quarter National Survey of Terms of Lending to Farmers
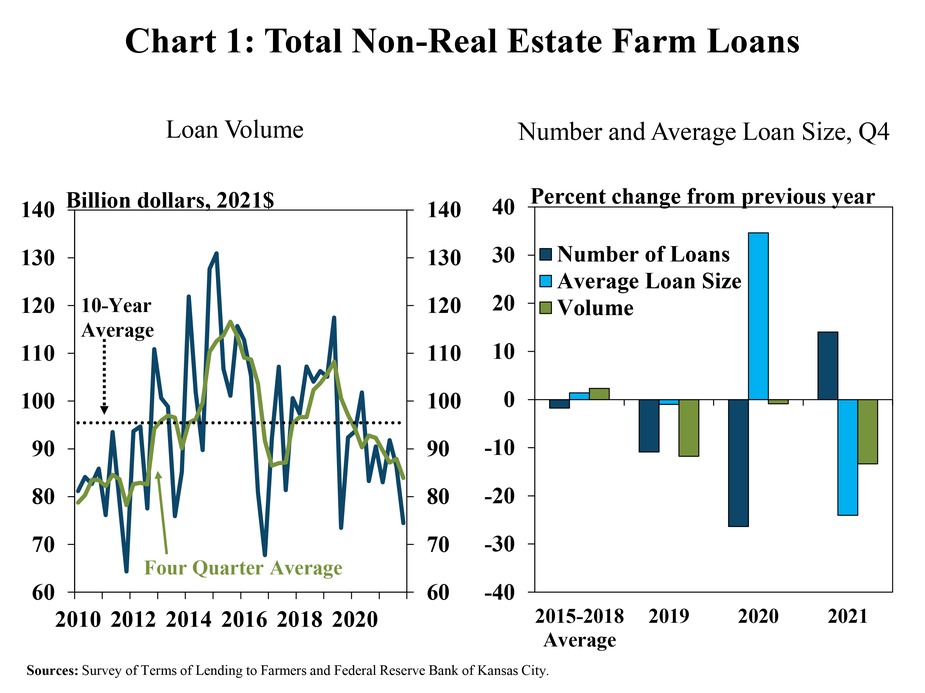
Farm lending activity dropped sharply at the end of 2021 and the average volume of non-real estate loans during the past 12 months nearly reached a ten-year low. Total non-real estate farm loans decreased about 13% from a year ago and, on a rolling four quarter basis, dropped to the lowest level since 2012 (Chart 1, left panel). The decline in lending in the fourth quarter was driven by a sharp reduction in average size of loans that offset an increase in the number of loans (Chart 1, right panel).
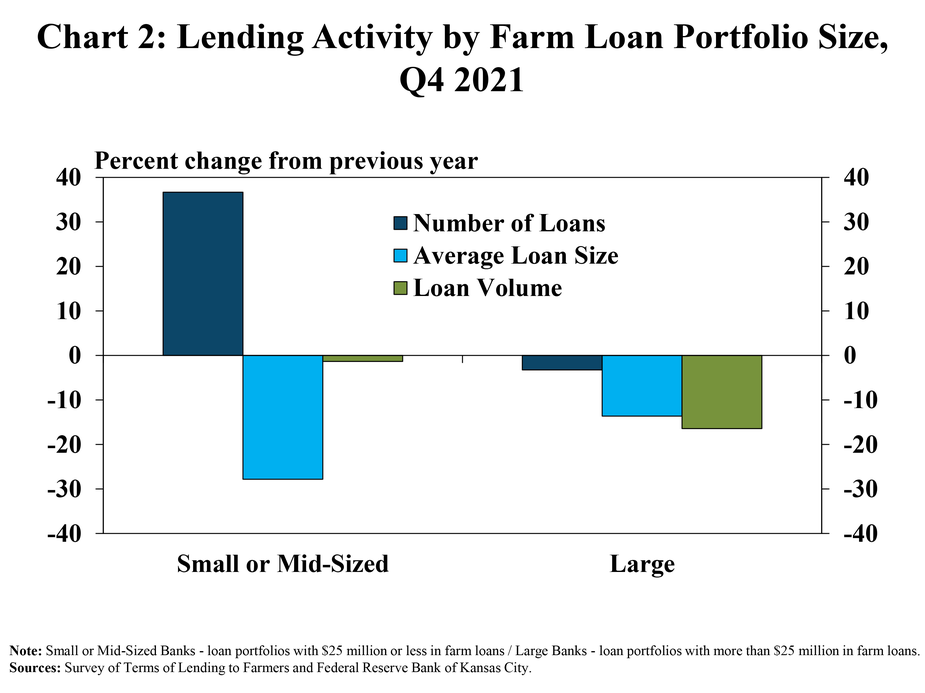
The number of new loans at small and mid-sized lenders increased considerably while most of the decline in loan volumes was among large lenders. The number of loans made by banks with the smallest farm loan portfolios grew more than 35% from a year ago, but the average size of those loans was nearly 30% lower (Chart 2). The decline in loan size among the largest lenders was less pronounced, but those banks also made fewer loans and accounted for nearly all of the decline in total non-real estate lending.
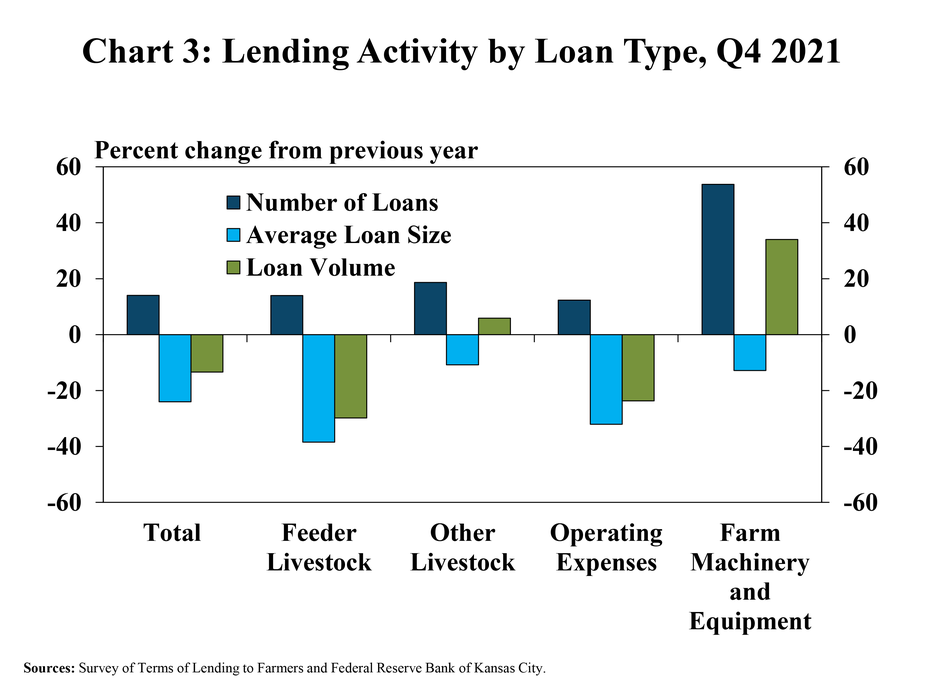
The higher number of loans and smaller loan sizes was consistent across lending types, but farm operating loans drove most of the decline in lending volume. The number of loans for all major categories of lending increased by more than 10% while average loan sizes declined by at least 10% (Chart 3). The average size of operating loans was more than 30% less than a year ago and operating loans also accounted for most of the decrease in total non-real estate loan volumes.
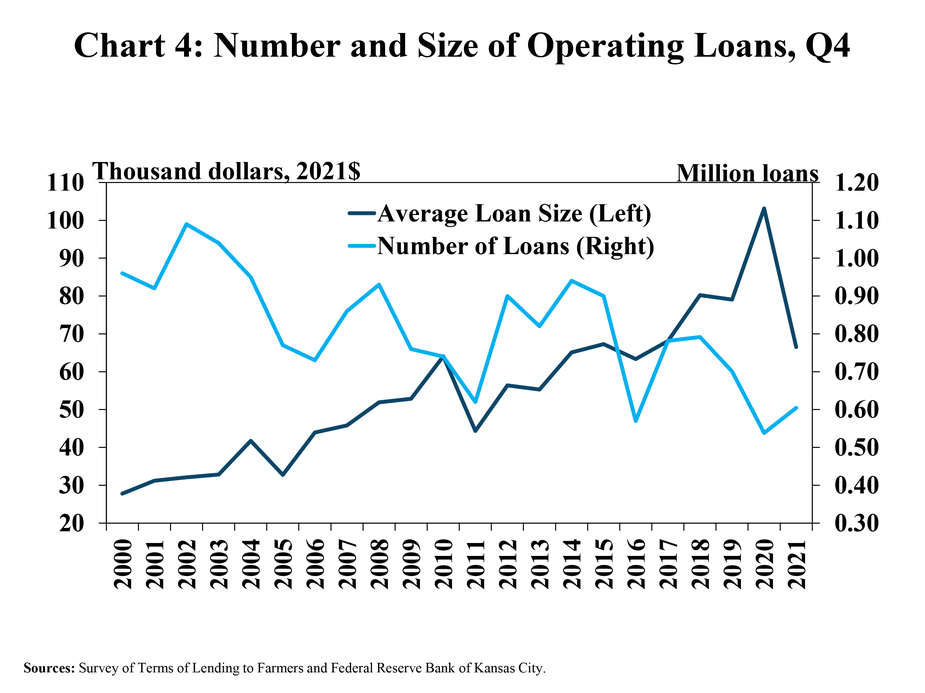
The sharp drop in the size of operating loans was a notable contrast to the trend in recent years. Following several years of consistent increases and a record high for the fourth quarter in 2020, the average size of operating loans dropped to the lowest level for this time of year since 2016 (Chart 4). The number of operating loans remained low compared with past years, but increased from the historic low for the fourth quarter reached last year.
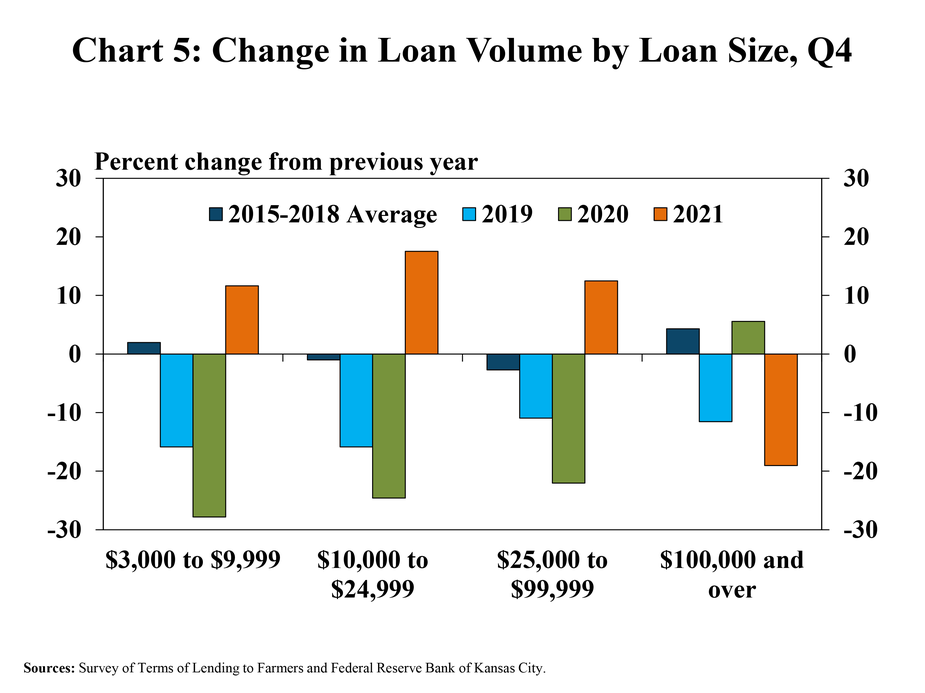
With a higher number of smaller loans, the composition of lending shifted away from large loans. The volume of loans greater than $100,000 decreased nearly 20% from a year ago, while the volume of all other loans increased almost 15% (Chart 5). The shift in the distribution of lending towards smaller-sized loans was a noticeable swing from recent years.
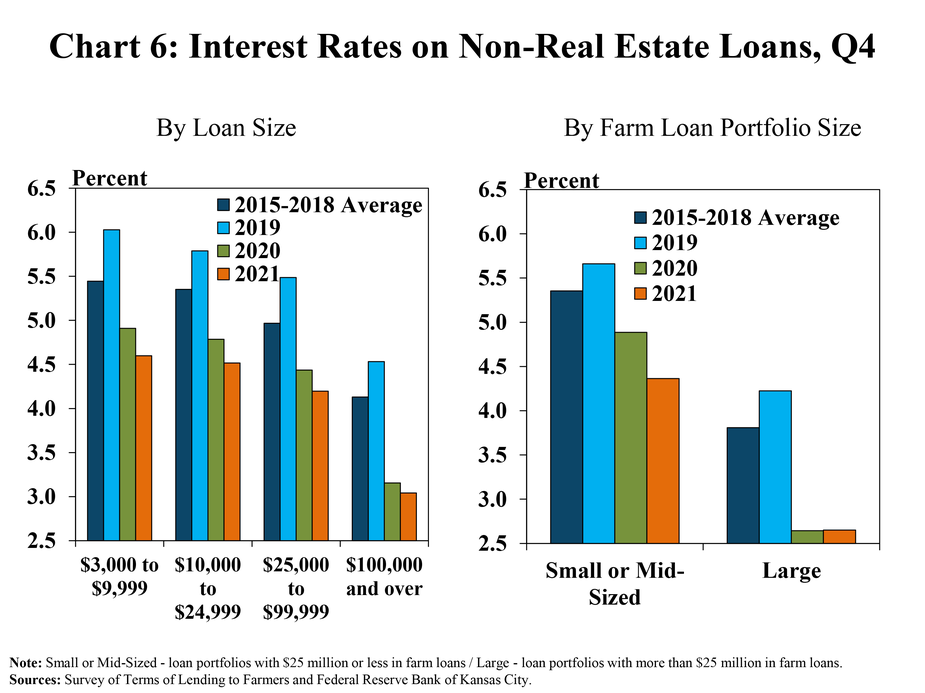
The average interest rate charged on non-real estate loans also declined further, and remained lowest for the largest loans and at the largest agricultural banks. The average rate on loans greater than $100,000 remained about 140 basis points lower than rates on smaller loans and has declined slightly more from the same time in 2019 (Chart 6). Similarly, the average rate at the largest farm banks remained lower than other lenders and has also declined slightly more from the same time in 2019.
Data and Information
National Survey of Terms of Lending to Farmers Historical Data
National Survey of Terms of Lending to Farmers Tables
About the National Survey of Terms of Lending to Farmers
The views expressed are those of the authors and do not necessarily reflect the positions of the Federal Reserve Bank of Kansas City or the Federal Reserve System.
Authors

Nate Kauffman
Senior Vice President, Economist, and Omaha Branch Executive; Executive Director of the Center for Agriculture and the Economy
