Some agricultural commodity prices in the U.S. got a boost from exports over the summer, but elevated exports seemed to only keep prices for some commodities from dropping further. Low commodity prices in late 2016 have put downward pressure on farm income, credit conditions, such as repayment rates for farm loans, and farmland values. USDA forecasts in November for farm income indicated crop revenue is expected to remain unchanged from 2015, supported by high yields and a summer spike in export volumes for most commodity crops, especially soybeans. However, revenues for livestock and animal products have been forecasted to decline sharply in 2016, and despite above-average export volumes in soybeans, corn and cattle, another year of record production could continue to suppress prices for most agricultural commodities.
Financial Outlook
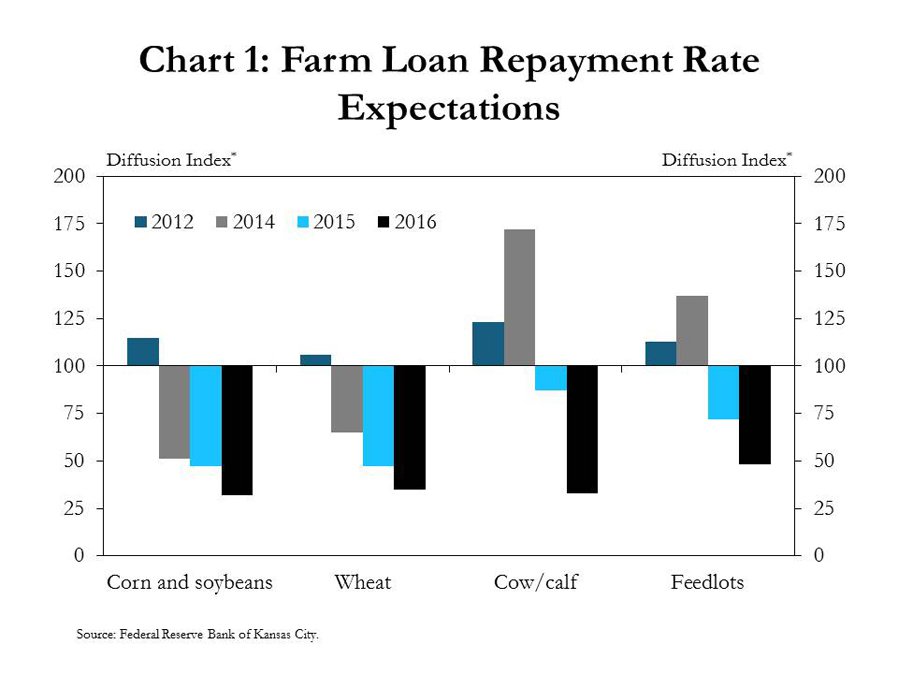
Declining repayment rates and lower farmland values have contributed to a weak financial outlook in the farm sector. In the Tenth District, the overall rate of loan repayment has declined since mid-2013. Furthermore, repayment rates on farm loans have declined in each major industry in the District’s agricultural economy. In 2012, a majority of bankers indicated they expect higher loan repayment rates for each agricultural industry, including corn, soybeans, wheat, cow/calf and feedlot operations (Chart 1). By 2014, as crop prices had receded and livestock prices were near record levels, bankers were expecting lower repayment rates for crop operations but higher repayment rates for cattle operations. However, the outlook for all industries became much more pessimistic in 2015 and 2016, and bankers’ expectations for repayment rates across all categories have weakened.
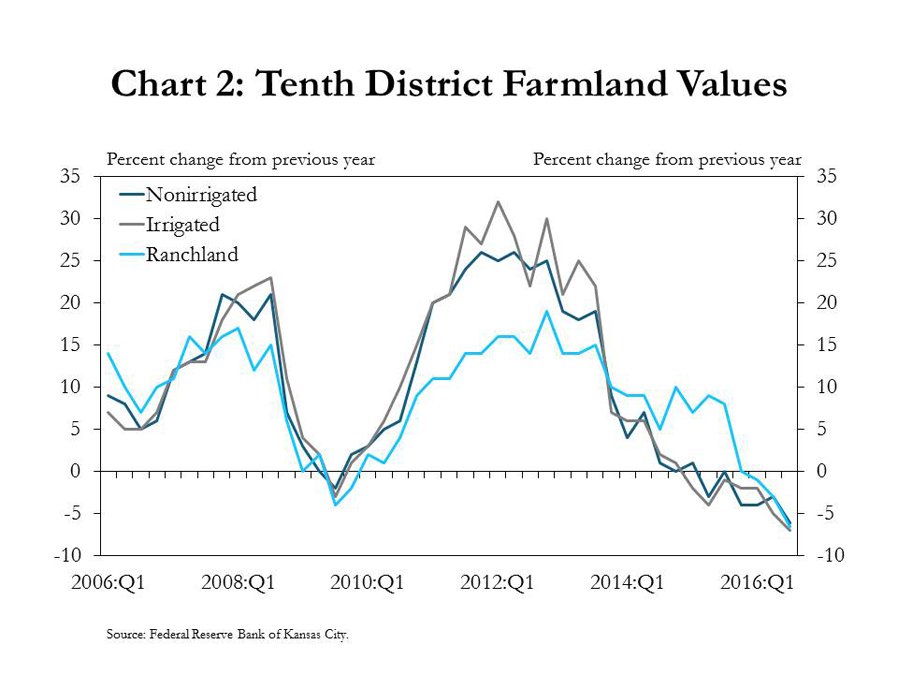
Alongside lower repayment rates, farmland values have begun to show measurable declines. After increasing at a slower rate for several quarters, values for nonirrigated cropland and irrigated cropland began to decline in 2015, and ranchland values started to fall in 2016 (Chart 2). In the third quarter, values for all types of farmland declined more than 6 percent from year-ago levels.
Soybean Outlook
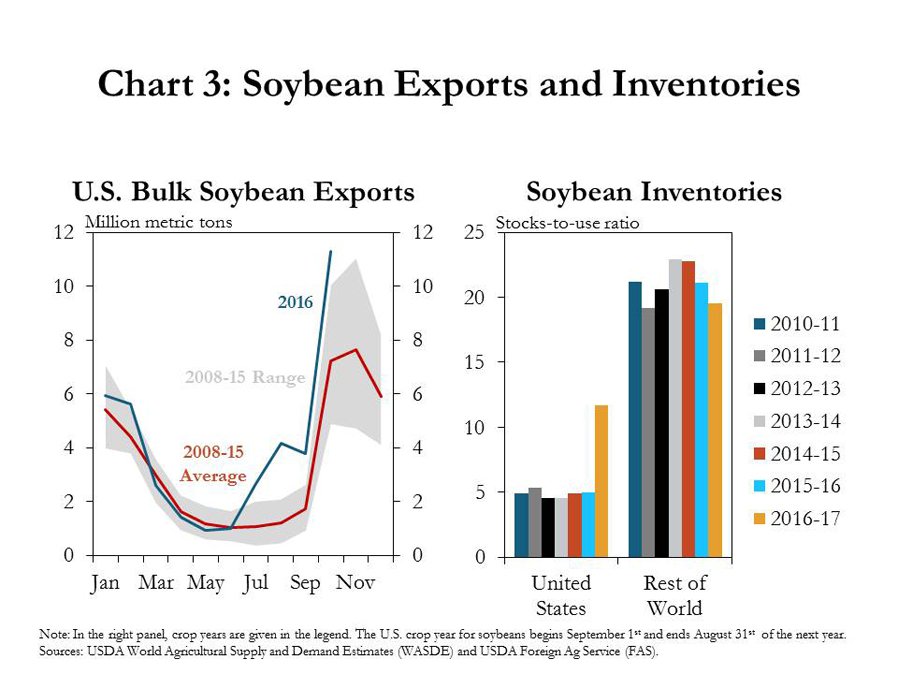
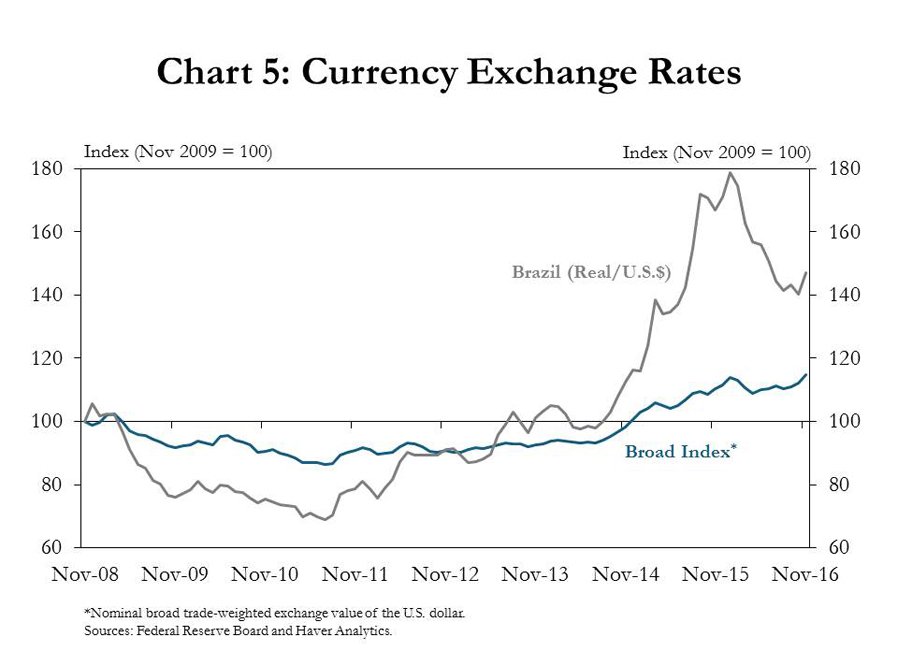
The outlook for crop and livestock commodities likely will influence the financial outlook for U.S. agriculture. For example, soybeans and other oil crops comprise about 12 percent of total cash receipts and 22 percent of crop cash receipts in the U.S. agricultural economy. Prices for soybeans are higher than a year ago and, based on current futures prices, could continue to rise if export markets strengthen further. Soybean exports over the summer are typically much smaller than exports in the fourth quarter. This year, however, exports were very strong through the summer and early fall, exceeding year-ago levels by up to 150 percent in August (Chart 3, left panel). According to the USDA, the United States and Brazil account for more than 80 percent of global soybean exports, and despite relative strength in the dollar, the United States was able to take advantage of lingering effects from adverse weather conditions during Brazil’s growing season. Soybean shipments increased 13 percent in October, and the value of soybean exports has increased 18 percent year-to-date. However, U.S. inventories for soybeans, measured as stocks-to-use ratios, are expected to increase sharply in the current crop year, as inventories in the rest of the world are expected to continue to decline slightly (Chart 3, right panel).
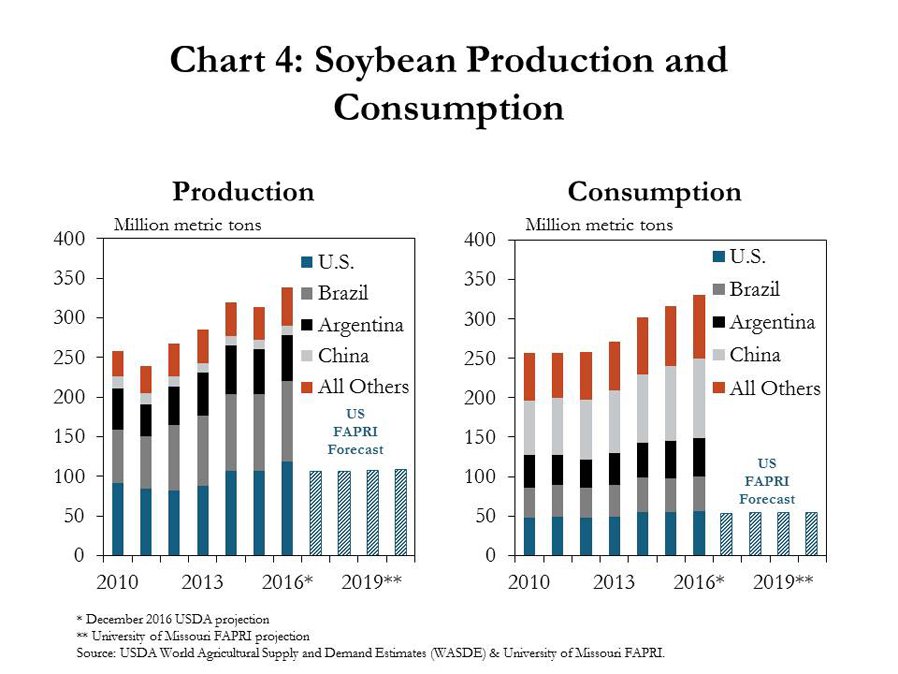
Increasing soybean inventories in the United States reflect the continued disparity between production and consumption in the U.S. and globally. As of November, the USDA projected record soybean production in the United States for the 2016 - 2017 crop year, which began in September 2016, following two years of near-record production. Farmers in the United States and Brazil produce twice as many soybeans as their respective countries can consume (Chart 4). As production continues to increase, U.S. farmers likely will become increasingly dependent on exports to countries like China that consume 10 times the amount of soybeans they produce. As populations and incomes increase in China and other developing countries, demand for livestock products and livestock feed products, such as soybean meal, are expected to increase. In fact, the USDA projects world trade of soybeans and their derivatives to increase 25 percent by 2025. However, global production is still outpacing consumption, and potential headwinds to soybean markets include increasing U.S. inventories, expanding production in the rest of the world and the strengthening dollar (Chart 5). If U.S. soybean inventories continue to increase, the dollar remains strong and weather conditions remain favorable in South America for the next crop, the outlook for soybean prices in 2017 could become less optimistic.
Corn Outlook
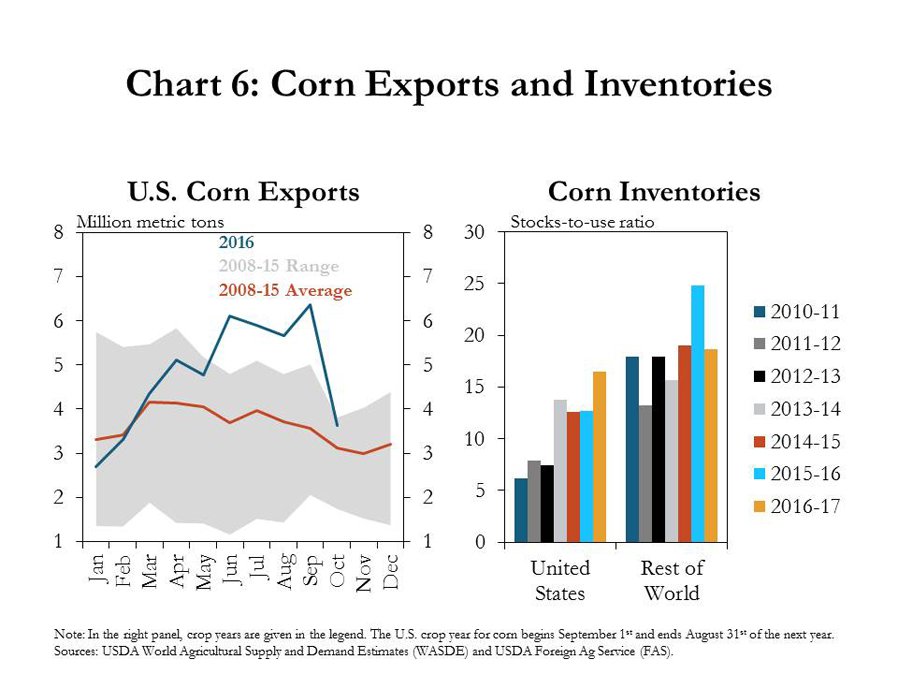
Like soybeans, corn is an important commodity in the United States. Feed crops and food grains, which include corn, are responsible for 36 percent of crop cash receipts and 20 percent of total cash receipts from agricultural commodities. Unlike soybeans, however, corn prices have been below year-ago levels for most of the year. Corn markets have received some support from exports, which were well above historical averages through mid-2016 (Chart 6, left panel). Although corn exports declined sharply in October, they remained near the high end of the historical range and 17 percent higher than the average export volumes for October from 2008 to 2015. Total exports for the 2016 – 2017 crop year are expected to be more than last year, but U.S. corn inventories are still projected to increase 30 percent, as corn inventories in the rest of the world decline 25 percent (Chart 6, right panel).
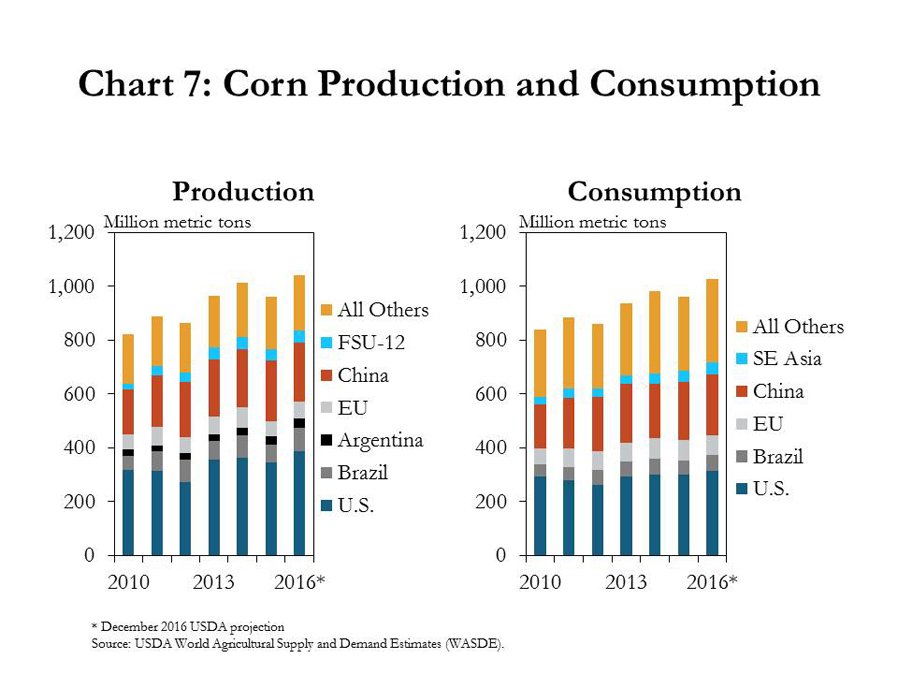
Growth in U.S. corn inventories is a concern because larger inventories have been linked to lower prices. Larger inventories are supported by higher production expectations for the 2016 – 2017 crop year. In December, the USDA’s projection for domestic corn production in 2016 was 41 million tons more than the 2015 production estimate (Chart 7, left panel). Exports and total domestic consumption are also expected to increase but not enough to offset the growth in U.S. production (Chart 7, right panel). At the same time, growth in domestic consumption and trade are expected to outpace increasing production in other corn-producing countries.
Wheat Outlook
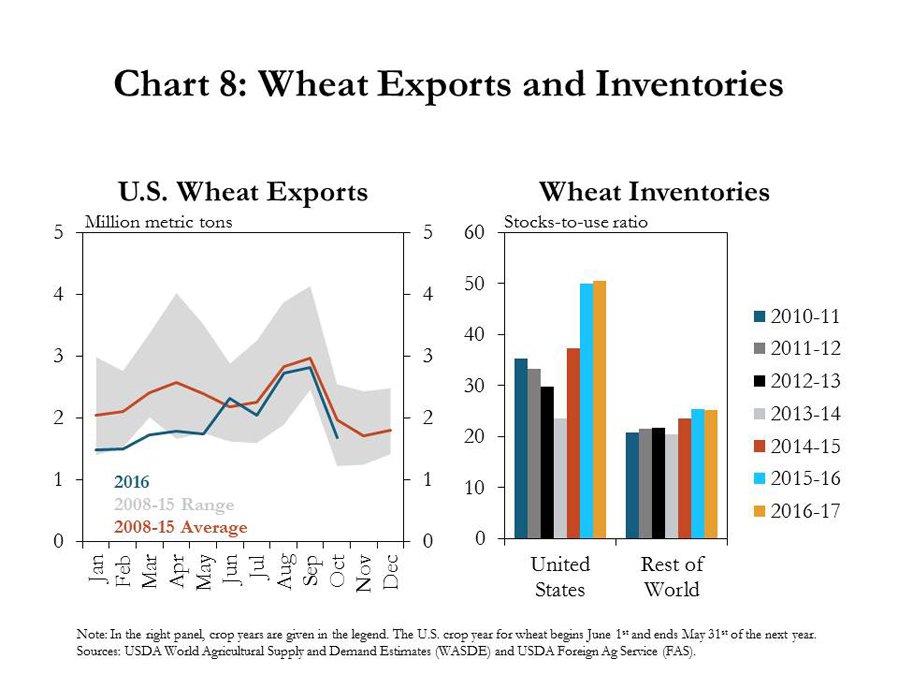
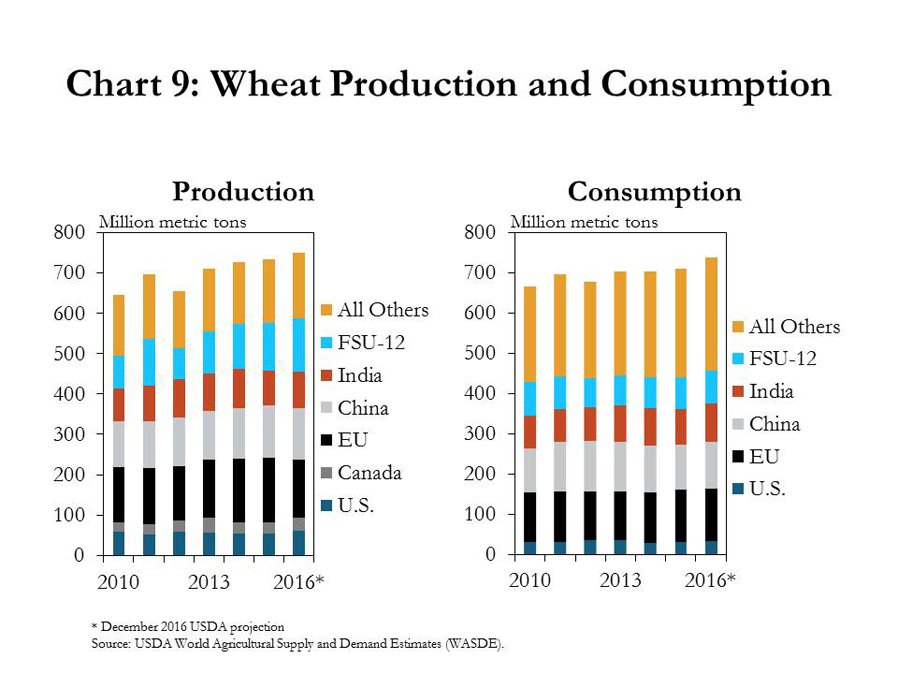
The outlook for wheat is slightly more pessimistic than for soybeans and corn. In fact, in October, the monthly average price for wheat fell to the lowest level since June 2003. Wheat, unlike other commodity crops, has not received as much of a bump in demand from exports. Wheat exports were below the previous seven-year average in 2016 in every month except June (Chart 8, left panel). In the 2016 – 2017 crop year that began in June, U.S. inventories are expected to remain at record highs, while inventories in the rest of the world decline slightly (Chart 8, right panel). In addition, the United States is a smaller player in wheat production and trade than in corn and soybeans, and U.S. supplies of wheat continue to grow faster than consumption (Chart 9). Therefore, growing inventories, especially in the United States, suggest low prices for wheat may persist into 2017 and beyond.
Cattle Outlook
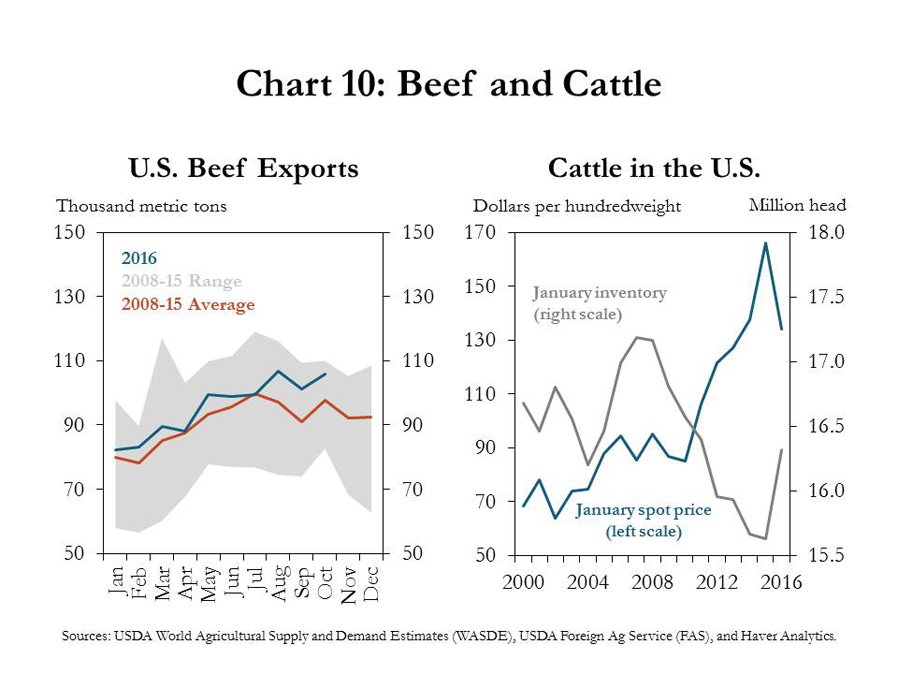
Similar to commodity crops, U.S. cattle prices have remained depressed this year due to expanding production and inventories. Although U.S. beef exports have not been above the recent range from 2008 to 2015, they have met or exceeded average levels every month in 2016 (Chart 10, left panel). However, the U.S. cattle inventory is also continuing to expand (Chart 10, right panel). Since 2000, the correlation between cattle inventories and cash prices is -71 percent, suggesting that a 1 percent increase in inventories has been accompanied by a 0.71 percent decline in prices. As the U.S. cattle herd continues to grow, cattle prices may remain suppressed, despite strength in export markets. In recent years, beef consumption in Asia has grown at a faster rate than production, and this trend is expected to continue. However, growth in U.S. beef production is not expected to slow until 2020 (Chart 11). Therefore, U.S. producers will need to continue to take greater advantage of export markets to help support domestic prices in the midst of large supplies. If not, it may be closer to 2020 before production slows enough for inventories to decline and prices to rebound.

Conclusion
Despite strong exports for most commodities in 2016, prices remained lower than year-ago levels for all major commodities except soybeans. Respondents to the Tenth District Survey of Agricultural Credit Conditions seemed to indicate there still is a lot of pessimism in the agricultural sector throughout the District. Low commodity prices are weighing on farm income, and bankers are expecting lower farmland values and lower repayment rates across all sectors. Moving forward, if production of crops and livestock continues to expand at the current pace, agricultural producers in the United States likely will become increasingly reliant on international demand and exports to support domestic prices and farm incomes.
References
USDA Farm Income Team. 2016. 2016 Farm Sector Income Forecast: Farm Sector Weakness to Continue into 2016. USDA Farm Sector Income & Finances Report, Nov. 30. Available at External Linkhttps://www.ers.usda.gov/topics/farm-economy/farm-sector-income-finances/farm-sector-income-forecast
Lee, Tani, Anh Tran, James Hansen, and Mark Ash. 2016. “Major Factors Affecting Global Soybean and Products Trade Projections.” United States Department of Agriculture Economic Research Service, Amber Waves Feature: Crops, May 2. Available at External Linkhttps://www.ers.usda.gov/amber-waves/2016/may/major-factors-affecting-global-soybean-and-products-trade-projections/.
Irwin, Scott, and Darrel Good. 2016. “The Relationship between Stocks-to-Use and Corn and Soybean Prices: An Alternative View.” farmdoc daily (6):66, Department of Agricultural and Consumer Economics, University of Illinois at Urbana-Champaign, April 6. Available atExternal Linkhttp://farmdocdaily.illinois.edu/2016/04/relationship-between-stock-to-use-and-prices.html