Credit Conditions | Fixed Interest Rates | Variable Interest Rates | Land Values
Alongside a sharp turnaround in agricultural economic conditions and lasting support from government programs related to pandemic relief, farm income and loan repayment rates both increased from a year ago‑‑at the fastest pace on record. The improvement in farm finances eased credit issues and contributed to softer demand for farm loans. With support from a strong farm economy and historically low interest rates, farm real estate values rose 10% from a year ago, which was the largest increase since 2013.
The outlook for profit opportunities in 2021 remained strong for most agricultural producers as commodity prices remained well above recent years. Conditions in the cattle industry remained somewhat weaker, however, and drought continued to hinder conditions for farmers and ranchers in some areas of the District. Nearly all banks reported that production expenses for both crop and livestock producers increased and cash rental rates in the District also increased, which could pressure margins going forward. Despite potential headwinds, bankers indicated they expected improvement in farm income and credit conditions to continue in the months ahead.
Farm Finances and Credit Conditions
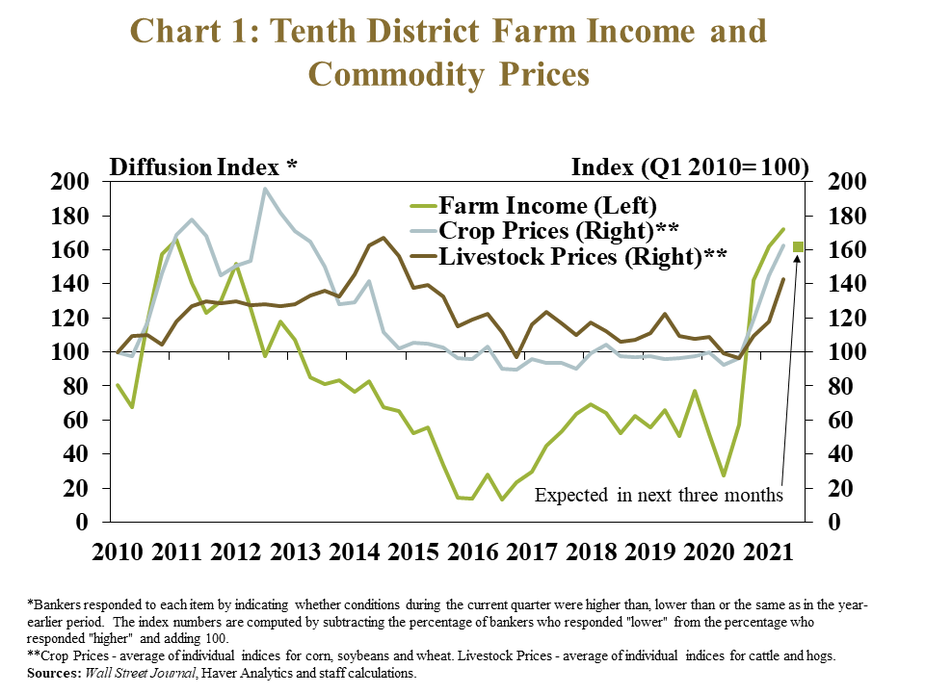
Strong prices for key agricultural commodities brought additional support to farm income in the Tenth District in the second quarter. Alongside multiyear highs in farm commodity prices, about 80% of bankers surveyed in June reported that farm income was higher than the previous year (Chart 1). Bankers’ optimism about farm income was greater than the previous quarter and corresponded with the strongest year-to-year turnaround in farm income since the survey began collecting that information in 2002.
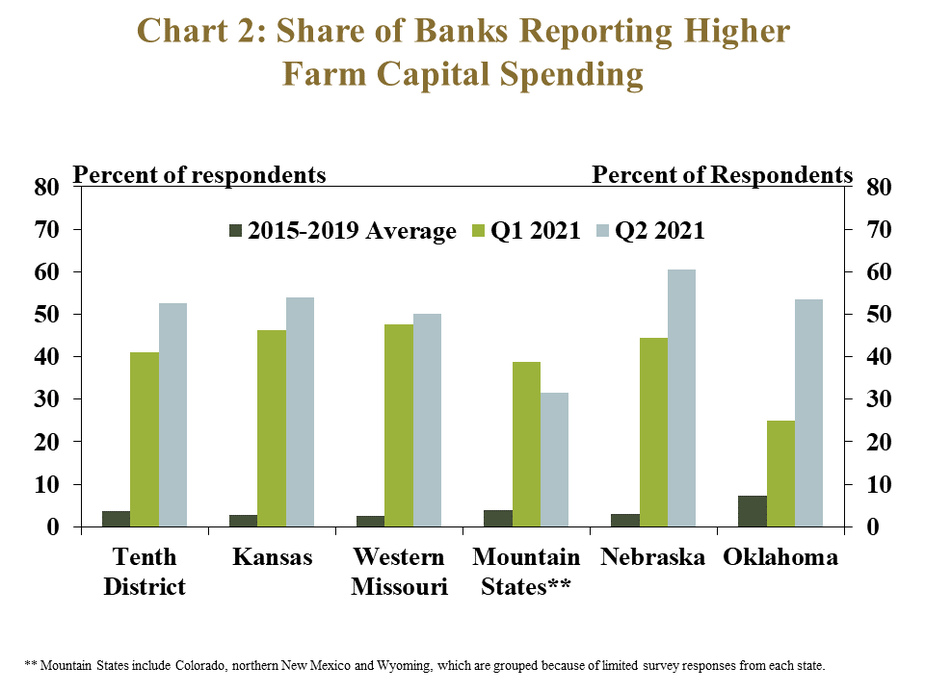
Farm capital spending also continued to increase with higher incomes. More than half of survey respondents reported capital spending was higher than a year ago among farm borrowers, matching the survey record (Chart 2). The share reporting an increase was slightly higher than the previous quarter in all states except the Mountain States of Colorado, Wyoming and New Mexico, and remained well above the average of recent years.
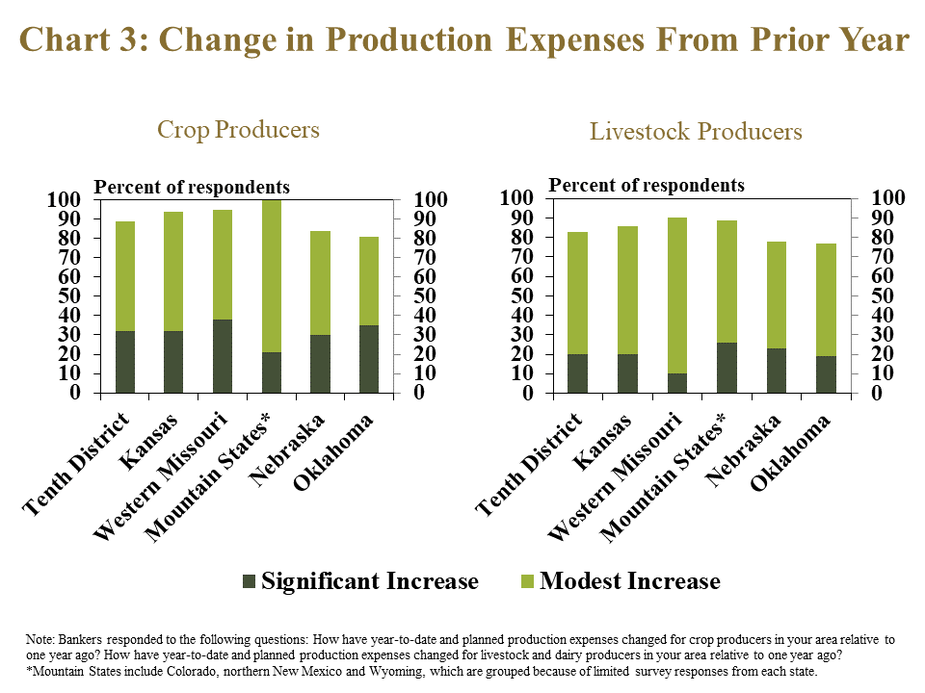
Production expenses also increased alongside higher commodity prices and increases in spending. A large majority of bankers reported that planned expenses for both crop and livestock producers increased relative to a year ago (Chart 3). Increased costs were slightly more prevalent for crop farmers in nearly all states but, on average, 80% of all lenders indicated that expenses for all producers were at least modestly higher than a year ago.
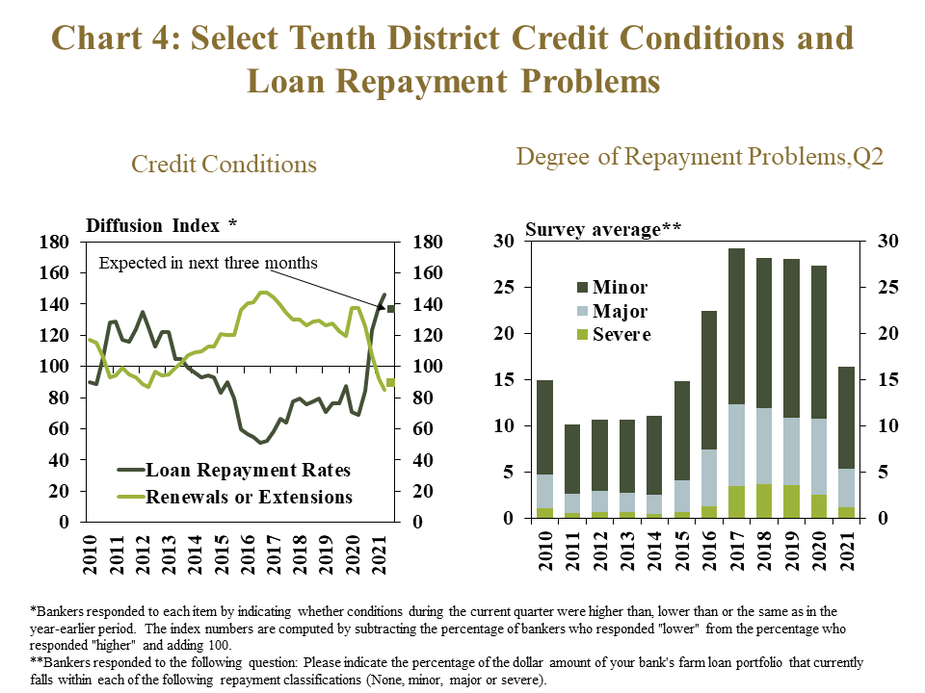
Despite the rise in expenses, opportunities for profit remained significantly improved from recent years and continued to promote easing of agricultural credit stress. Similar to farm income, loan repayment rates increased from the previous year at the fastest pace on record while renewal and extension activity continued to decline (Chart 4, left). Dropping considerably from recent years, bankers also reported that only 15% of farm loans had repayment problems, including just 5% with major or severe issues (Chart 4, right).
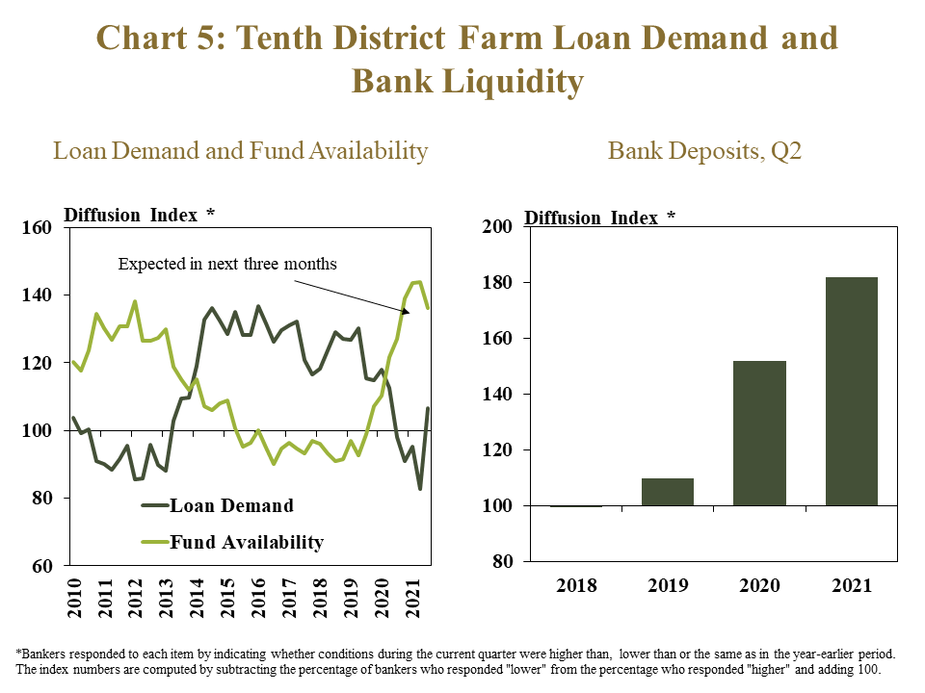
Alongside better prospects for farm finances, demand for farm loans continued to soften and bank liquidity remained ample. Throughout the District, farm loan demand declined at a quicker rate than the previous quarter while the availability of funds increased at a faster pace (Chart 5). With lower demand for agricultural lending, deposits also increased from a year ago at most banks.
Interest Rates and Bank Financial Performance
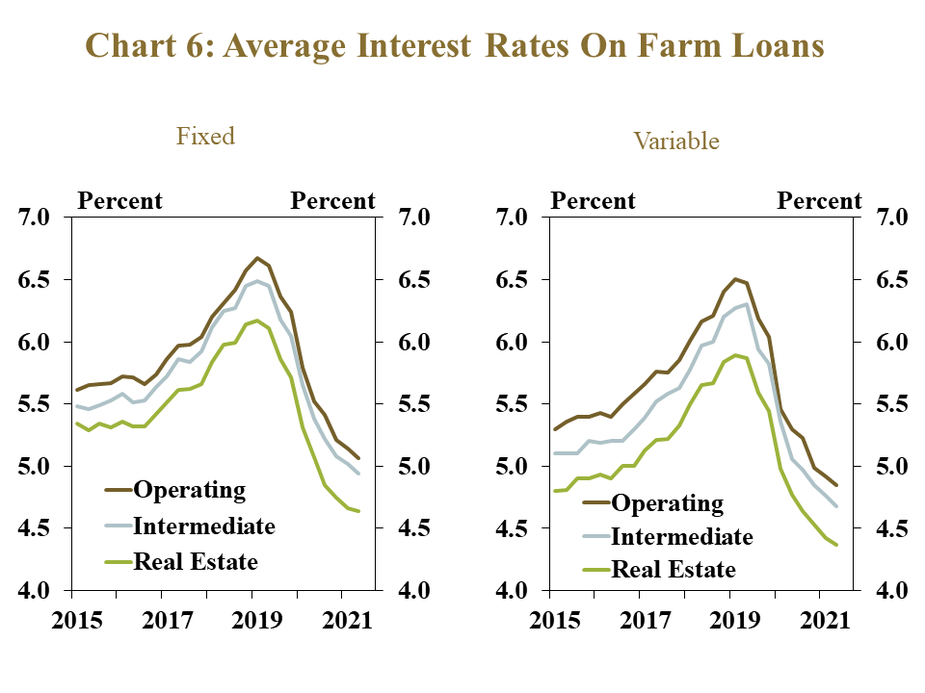
In addition to improved income and credit conditions, interest rates on farm loans declined further. Throughout the District, both fixed and variable rates on all loan types decreased slightly from the previous quarter and reached all-time lows (Chart 6). In contrast to recent increases in costs of some inputs, low interest rates have limited interest expenses for many producers.
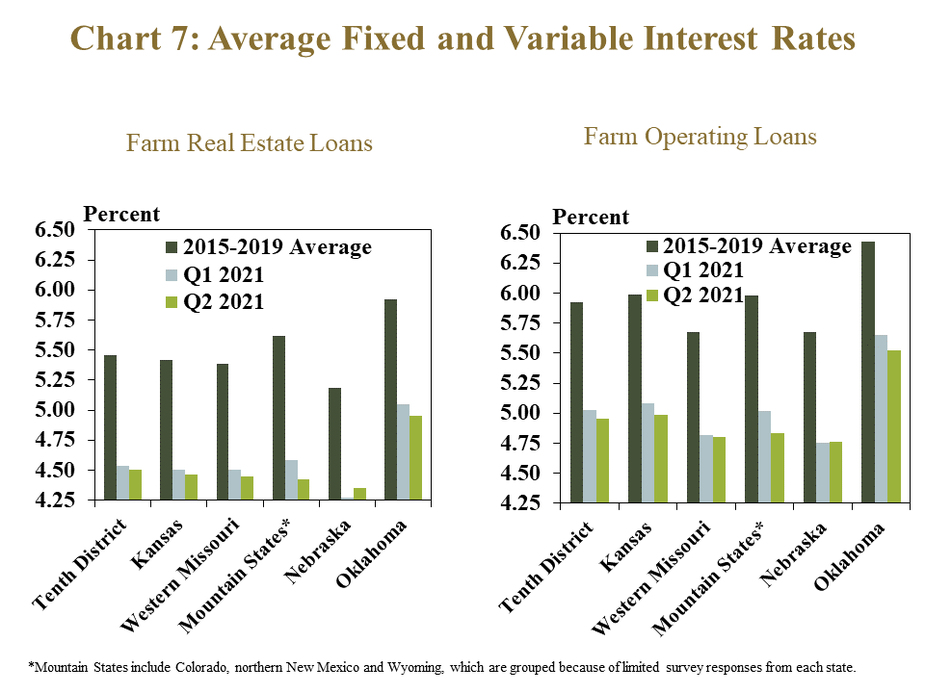
The slight decline in interest rates over the quarter was consistent across nearly all states in the District. The average fixed and variable rate on both farm real estate and operating loans was slightly less than the previous quarter in all states except Nebraska (Chart 7). The average rate for both types of loans also remained at least 80 basis points less than the average from 2015 to 2019 in all states.
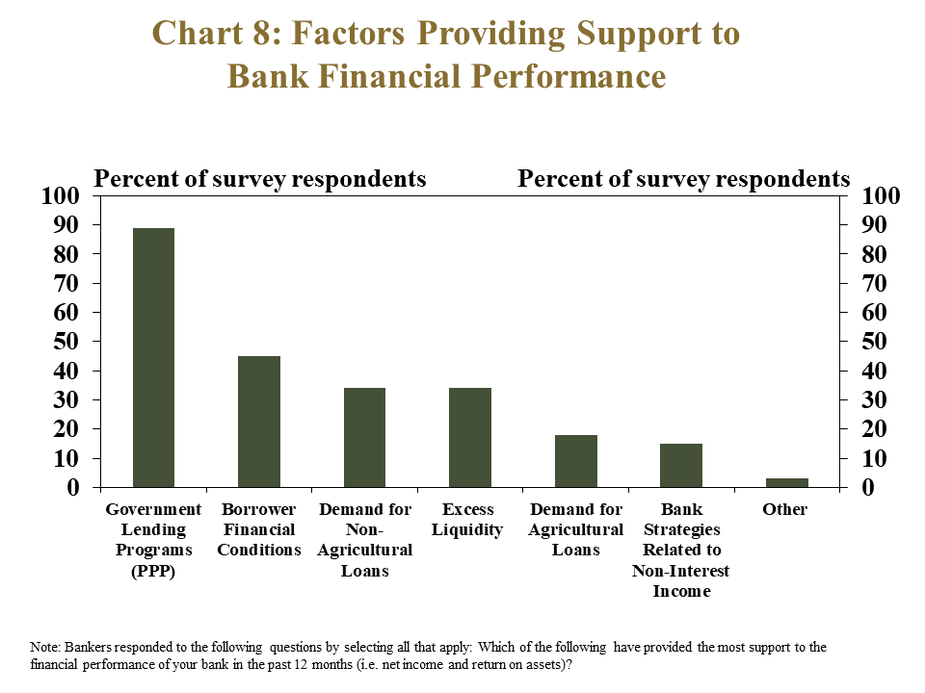
The combination of low demand for farm loans and historically low interest rates has contributed to compressed interest margins for many agricultural lenders, but several factors have provided support to banks’ financial performance. Returns for External Linkcommercial agricultural banks improved markedly from the end of 2020, and the most common source of support cited by respondents was the Small Business Administration Paycheck Protection Program (PPP) (Chart 8). Stronger financial conditions for borrowers, demand for non-agricultural loans and improved liquidity were the next most common sources of support.
Farmland Values and Cash Rents
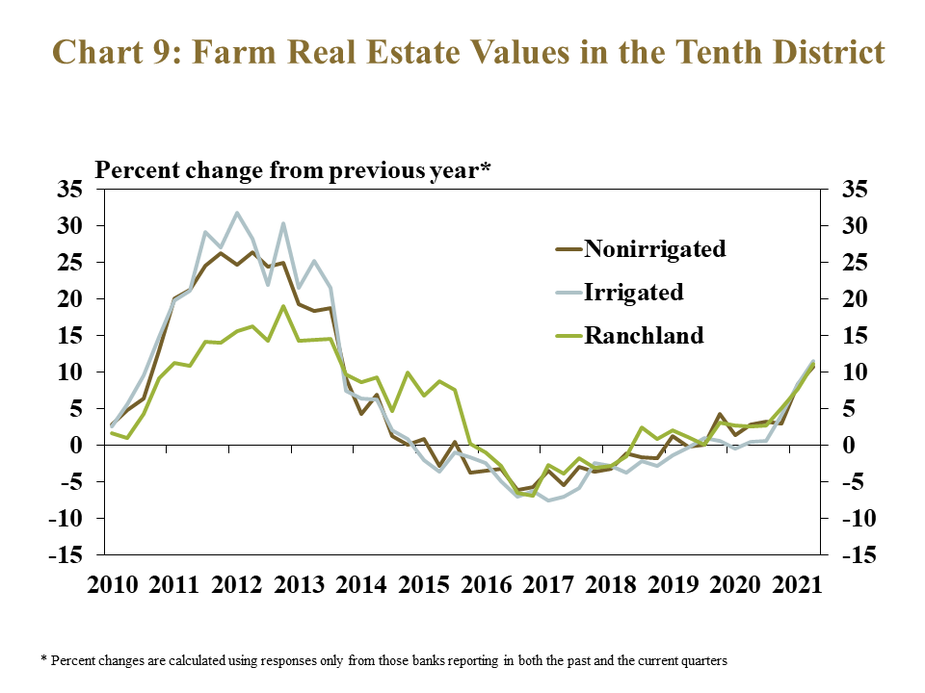
Historically low interest rates and strength in the agricultural economy continued to support farm real estate values. The value of all types of land throughout the District were about 10% higher than a year ago, the largest increase since 2013 (Chart 9). As of the second quarter, nonirrigated farmland values were about 14% higher than the beginning of 2019, offsetting the decline of about 12% from 2014 to 2018.
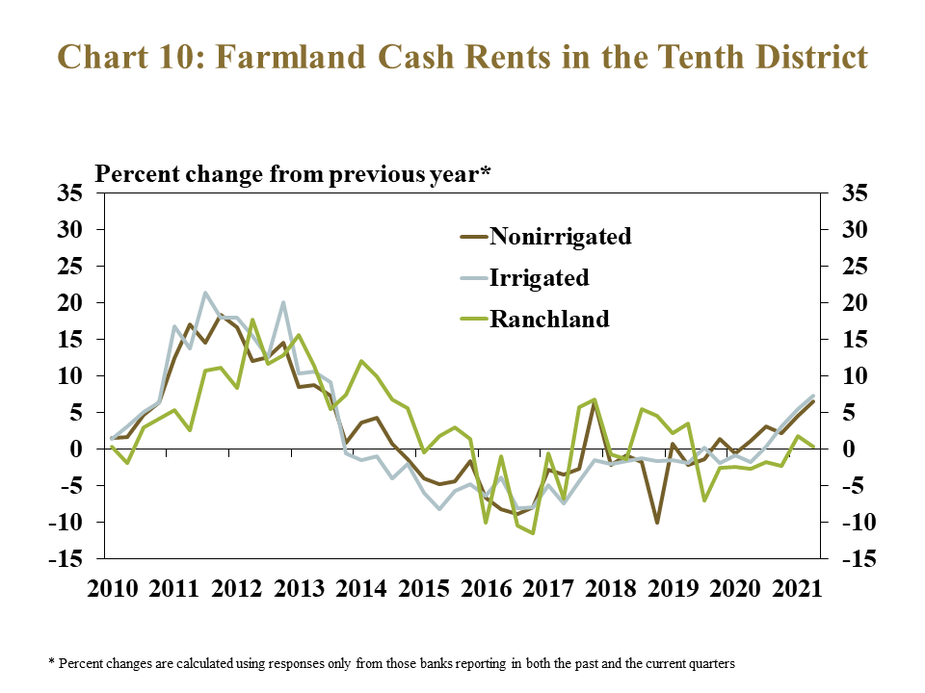
Cash rents on all types of land also increased, but at a slightly slower pace than farmland values. Cash rents on nonirrigated and irrigated cropland rose about 7% from last year, while rents for ranchland increased slightly less than 1% (Chart 10). Similar to land values, the increase in cash rents for non-irrigated and irrigated farmland was the largest since 2013.
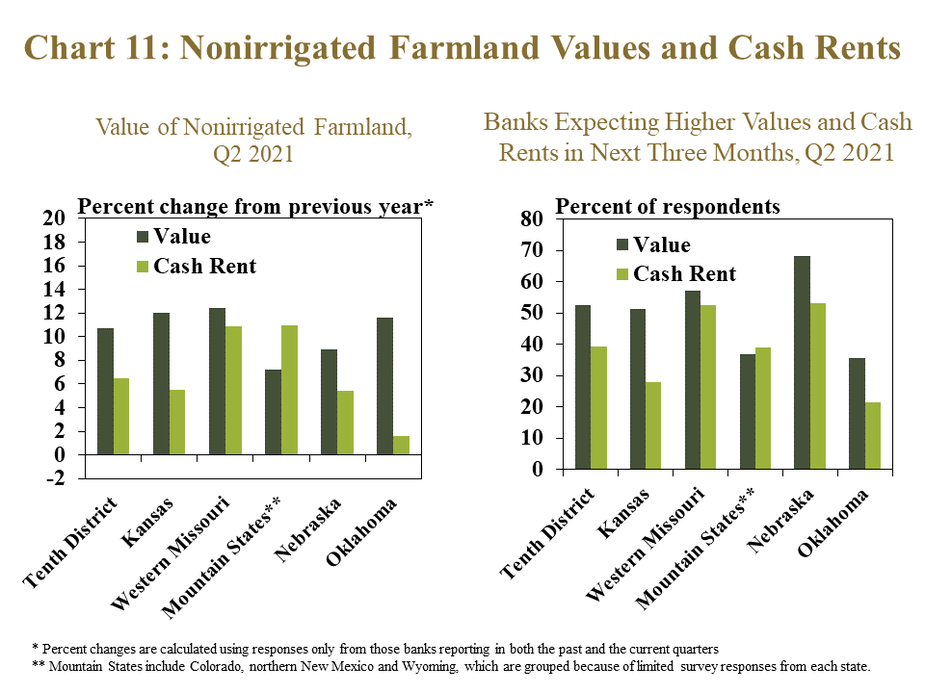
Increases in nonirrigated farmland values outpaced increases in cash rents in most states and bankers expected a similar trend in coming months. The annual percent change in the value of nonirrigated land was slightly higher than the change in cash rents in nearly all states (Chart 11). Similarly, a smaller share of banks indicated they expected increases in cash rents than land values in the next three months in most states.
Banker Comments from the Tenth District
“The drought was a big concern early in the summer.” – Southeast Colorado
“Input costs are increasing substantially and producers are seeing shortage of parts and supplies due to supply chain issues.”– Northeast Colorado
“This region will experience a tough year in agriculture due to drought conditions.”– Northern Wyoming
“PPP loans greatly enhanced farm cash flows for the past six months. Grain prices as they currently sit, will enhance farm cash flows for the remainder of 2021.”– Northern Oklahoma
“The increase in land values is making it difficult for both crop and livestock producers to afford purchasing based on the amount of return they generate from production.”– Northeast Oklahoma
“Supply constraints have pushed input expenses higher and the limited availability of equipment will slow capital spending.”– East Kansas
“Commodity prices are at profitable levels for producers and credit lines are not as far advanced as projected due to covid relief and PPP loan proceeds.”– Southwest Kansas
“Stimulus funding added to overall liquidity and greatly reduced loan demand.”– Central Missouri
“I’ve heard anecdotes of much higher cash rents being paid by specialty crop producers on some tracts of farmland in the area.”– Northwest Missouri
“PPP related fees constitute about a third of total revenue for the bank so far this year.”– Northcentral Nebraska
“Along with the rally in grain prices the first 6 months of 2021, we're seeing continued increases in crop inputs. Those that locked in 2021 inputs early will be okay in 2021, but 2022 might be a totally different story, regardless of high crop prices.”– Northeast Nebraska
A total of 154 banks responded to the Second Quarter Survey of Agricultural Credit Conditions in the Tenth Federal Reserve District—an area that includes Colorado, Kansas, Nebraska, Oklahoma, Wyoming, the northern half of New Mexico and the western third of Missouri. Please refer questions to Nathan Kauffman, economist or Ty Kreitman, assistant economist at 1-800-333-1040.
The views expressed in this article are those of the authors and do not necessarily reflect the views of the Federal Reserve Bank of Kansas City or the Federal Reserve System.
Authors

Nate Kauffman
Senior Vice President, Economist, and Omaha Branch Executive; Executive Director of the Center for Agriculture and the Economy
