Farmland values and cash rents declined moderately in the fourth quarter of 2016. Bankers across the Tenth District noted that persistent weakness in farm income continued to weigh on farmland values. Although most farmland purchases in the quarter were financed with new debt, the portion of new loans with a cash down payment decreased. The persistent and widespread deterioration in farm income has occurred alongside increasing loan demand and lower repayment rates. These trends are expected to continue in the first quarter of 2017.
Farmland Values and Cash Rents
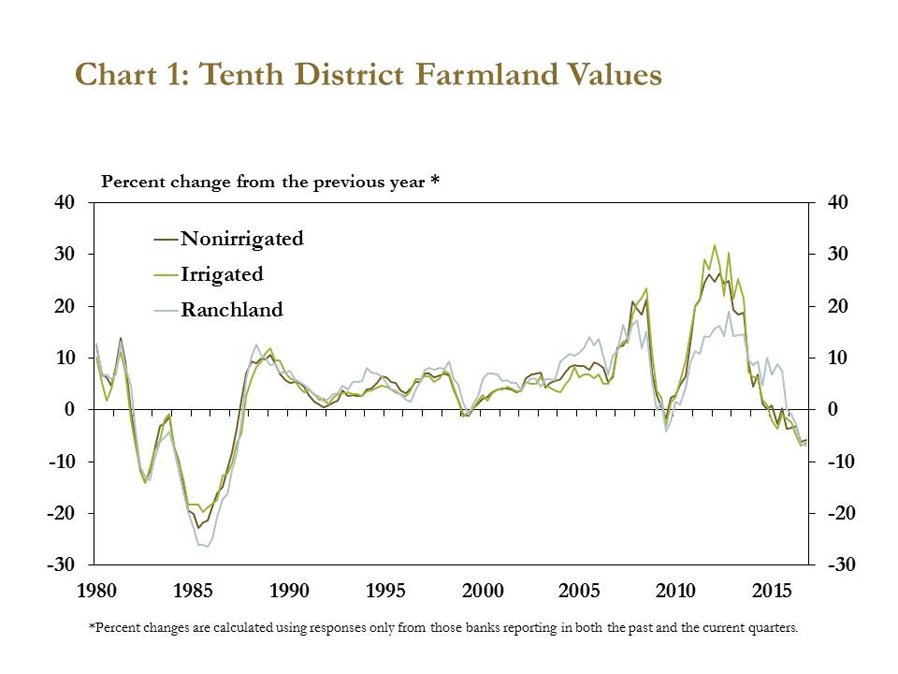
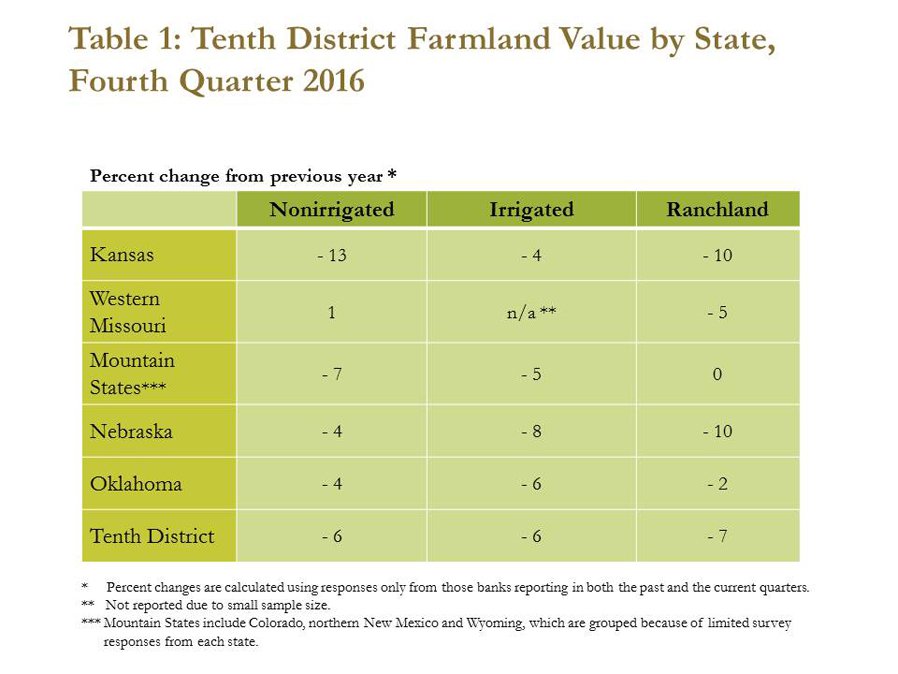
Farmland values continued to wane in the fourth quarter, according to the Tenth District Survey of Agricultural Credit Conditions. On average, nonirrigated and irrigated farmland values dropped 6 percent, and ranchland values fell 7 percent from the same period last year (Chart 1). These downgrades were the largest since the Great Recession of 2007-09 but were relatively small compared to declines in the 1980s. The largest changes in District states occurred in Kansas and Nebraska (Table 1). The value of nonirrigated farmland fell 13 percent in Kansas, and irrigated farmland in Nebraska was 8 percent lower. Decreases in ranchland values in Kansas, Nebraska and Missouri were the largest since 2002.
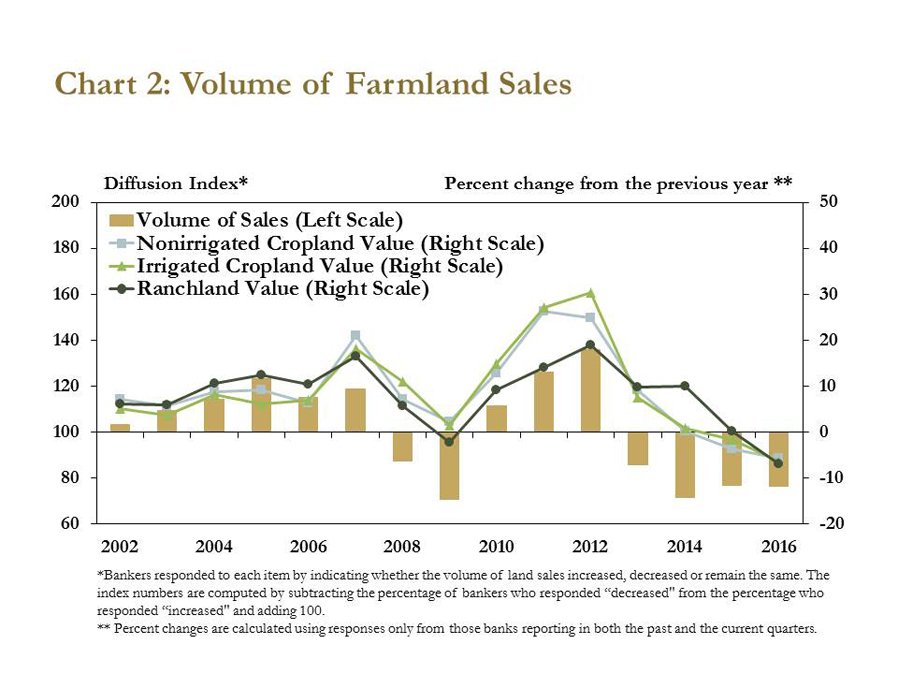
Farmland values fell alongside moderate declines in the volume of farmland sales. A majority of bankers reported that fourth-quarter farmland sales were lower than a year ago, following a similar trend that has occurred since 2013 (Chart 2).
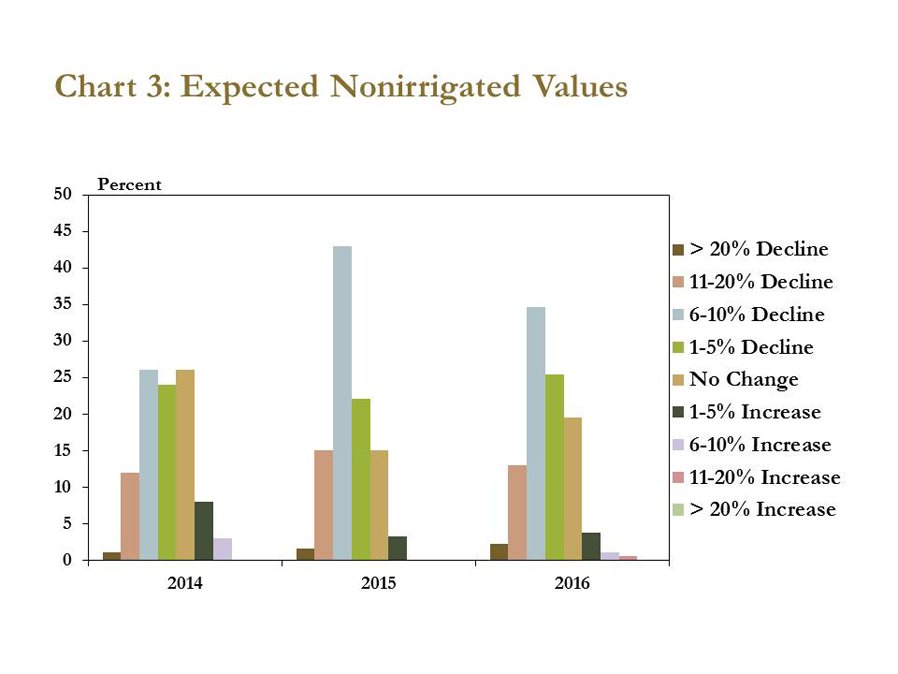
Moreover, bankers expected the downward trend in farmland values to continue. Seventy-five percent of bankers responding to the survey indicated they expect the value of nonirrigated farmland to decrease further in 2017, while only 5 percent expected an increase in nonirrigated farmland values (Chart 3). More specifically, a majority of bankers expected a decline of 6 percent to 10 percent in nonirrigated farmland values by year-end 2017.
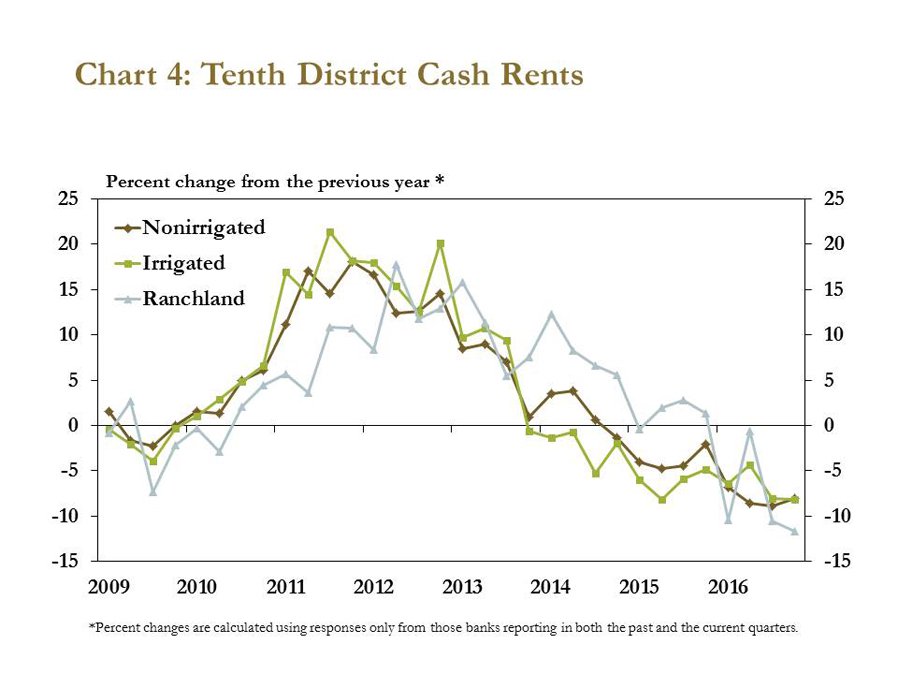
Amid the slump in farmland values, cash rents also edged down. Cash rents for nonirrigated and irrigated cropland each fell 8 percent while ranchland cash rents fell 12 percent from the fourth quarter of 2015 (Chart 4). In fact, cash rents for each type of farmland were down from 2015 in each quarter of 2016. All District bankers surveyed in the fourth quarter expected cash rents to remain unchanged or decline in the first quarter of 2017.
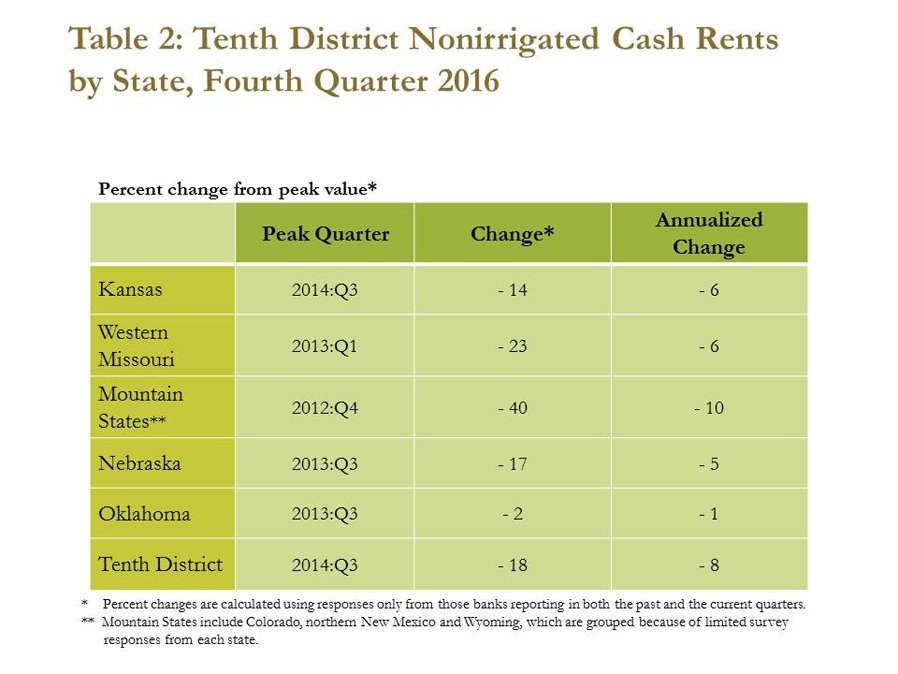
After falling steadily for several quarters, cash rents in the fourth quarter were down sharply from their peak values. In the Mountain States, for example, cash rents on nonirrigated cropland have fallen 40 percent from their peak in the fourth quarter of 2012 to the fourth quarter of 2016 (Table 2). In Oklahoma, cash rents on nonirrigated cropland have decreased 2 percent from peak values. Although total declines from peak values vary by state, annualized changes are more similar. For producers, a reduction in cash rents could help alleviate some pressure on profit margins because cash rents account for a large share of production expenses._
Farm Income
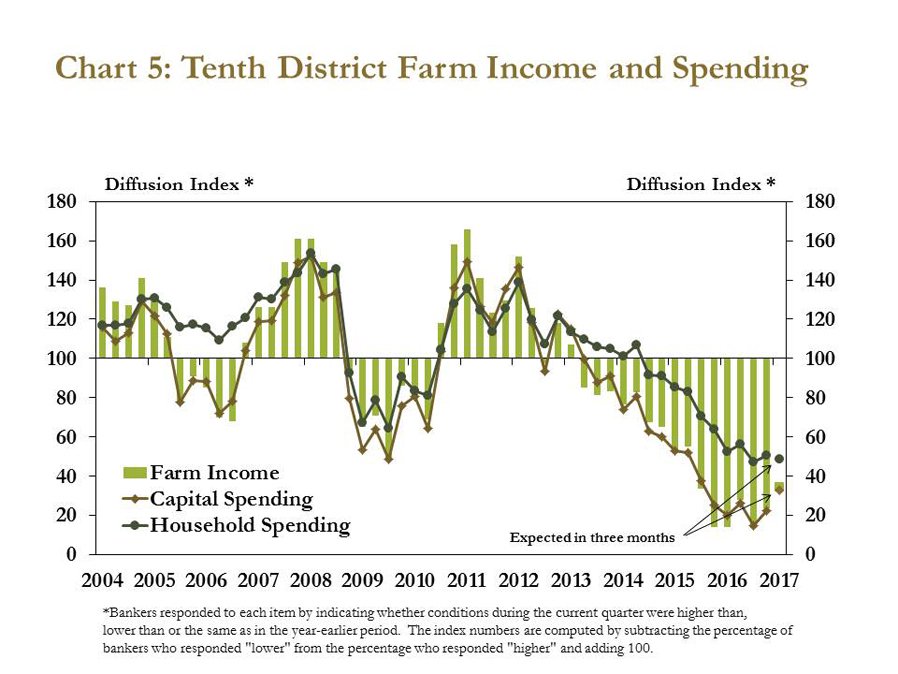
Farm income also weakened in the fourth quarter. In fact, farm income fell for the fifteenth consecutive quarter, the longest such streak in survey history (Chart 5). Moreover, 70 percent of bankers expected the downward trend to continue in the first quarter of 2017. Capital and household spending extended declines to 15 and 10 consecutive quarters, respectively. Although the pace of decline lessened somewhat for all three measures, the persistent nature of the downturn continued.
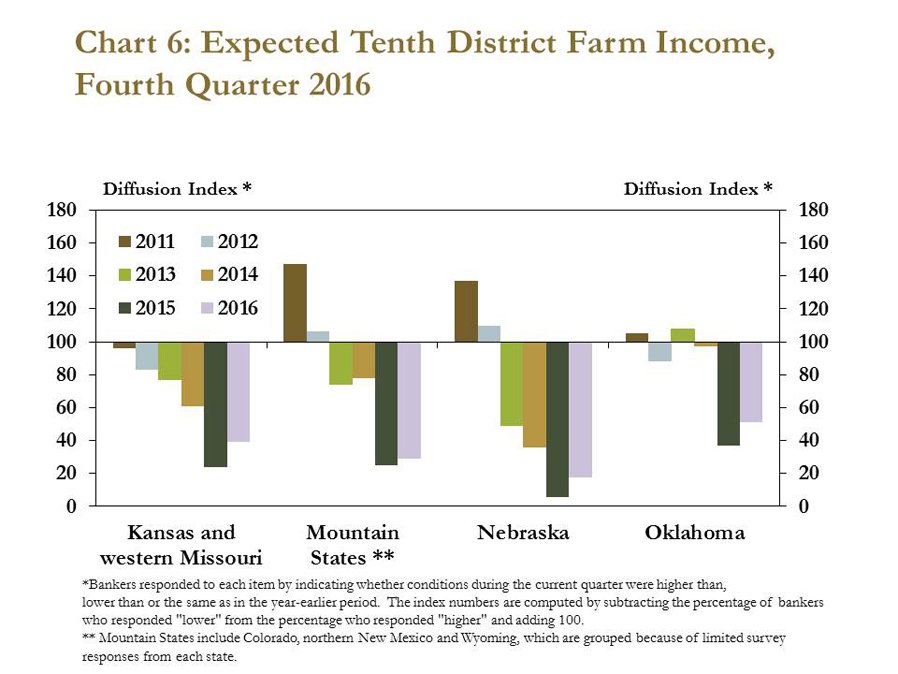
Persistently lower farm income has been felt across the Tenth District. Bankers in each District state have, on average, logged at least six consecutive quarters of declining farm income. Furthermore, at least 50 percent of bankers in each state indicated they expect farm income to decline in the first quarter of 2017 (Chart 6).
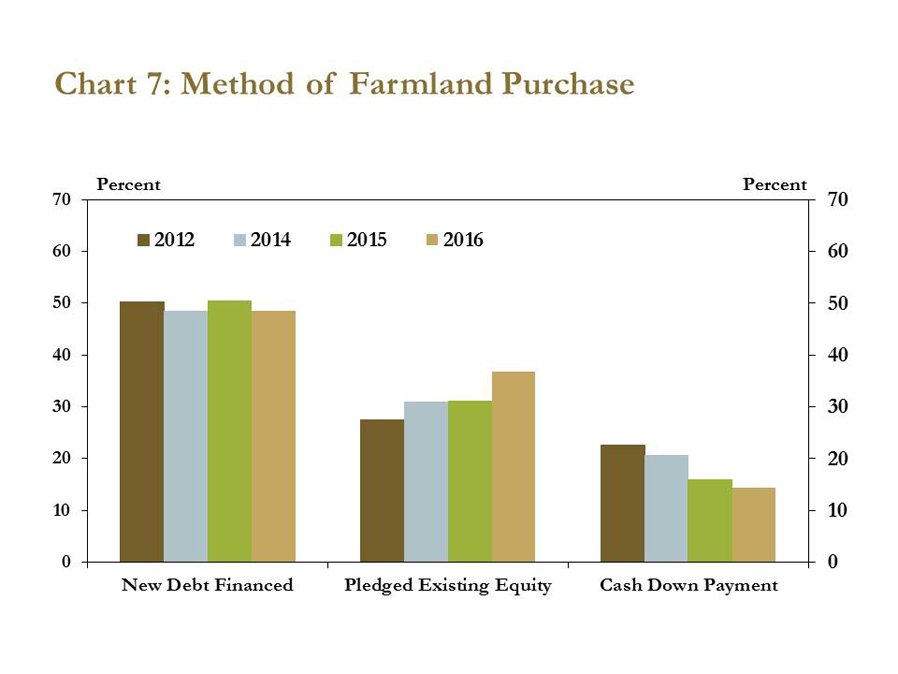
Evidence of tightening farm income is seen in the declining use of cash down payments on farmland loans. Since 2012, the share of farmland purchases that required new debt financing has remained little changed. However, the portion of farmland purchases made with cash down payments has dropped steadily from 23 percent in 2012 to 14 percent in 2016 (Chart 7). Additionally, the portion of farmland purchases with pledged existing equity has increased about 9 percent since 2012, suggesting that persistent declines in farm income have led to reduced liquidity in the farm sector.
Credit Conditions
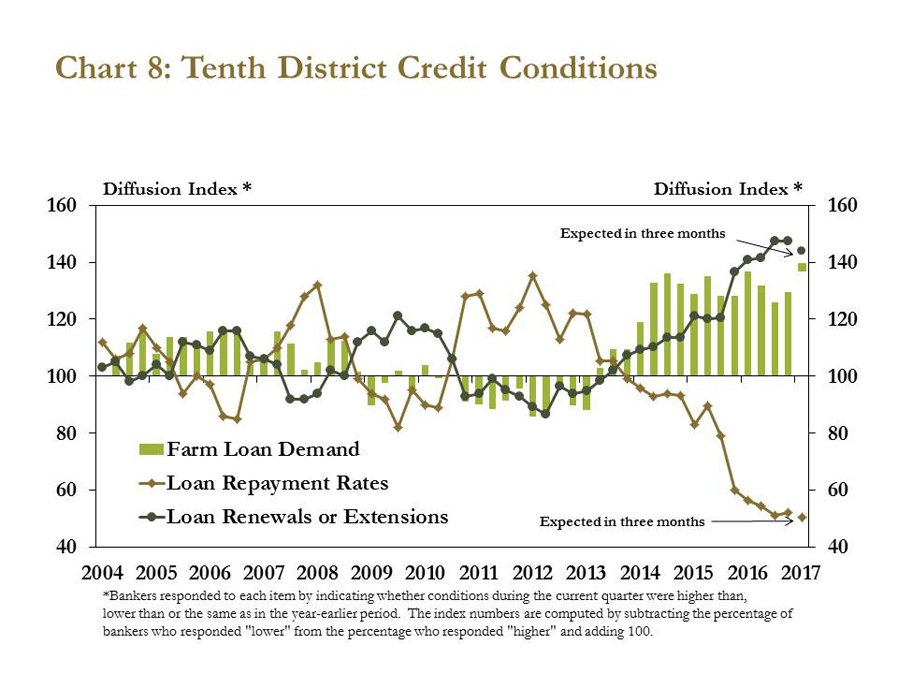
Credit conditions also weakened alongside lower farm income. Bankers again reported the growing divergence of increasing loan demand and declining repayment rates (Chart 8). In the fourth quarter, half of respondents recorded lower repayment rates and elevated demand for renewals and extensions. Additionally, more than half of respondents expected repayment rates to fall further in the first quarter of 2017, the largest share of bankers reporting a decline since 1991.
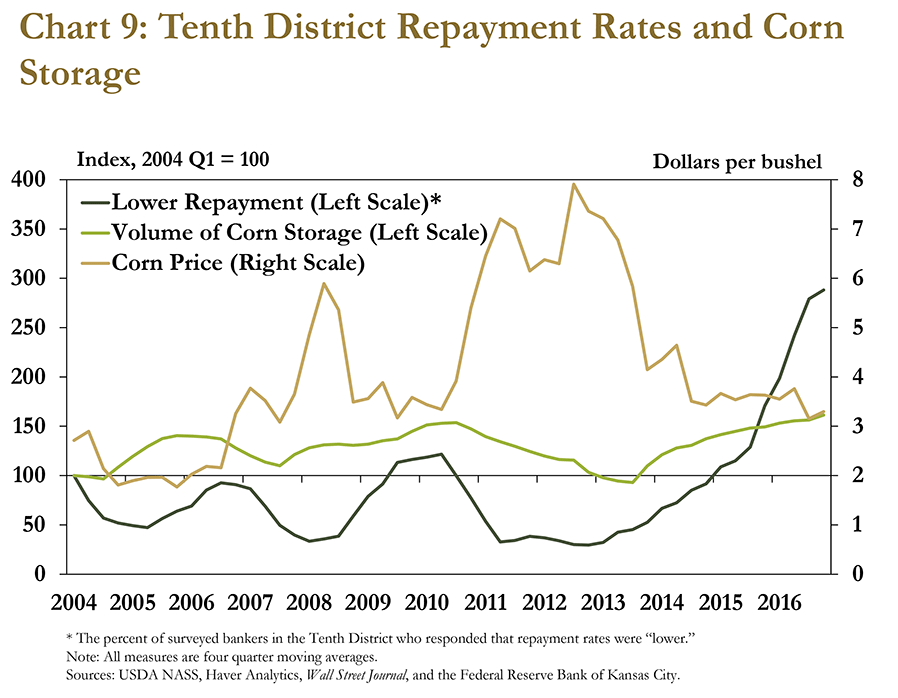
The steady declines in repayment rates, however, have not yet led to a significant increase in nonperforming loans at agricultural banks. In aggregate, producers appeared to be selling commodities only when necessary to make loan payments but otherwise storing commodities in the hope of better prices in the future. For example, the volume of corn in storage and the percent of bankers reporting lower repayment rates have been highly correlated in the Tenth District in recent years (Chart 9). The significant amount of commodities being stored may explain why farm loan delinquencies have not risen substantially, even as loan repayment rates have fallen sharply.
Agricultural Lending
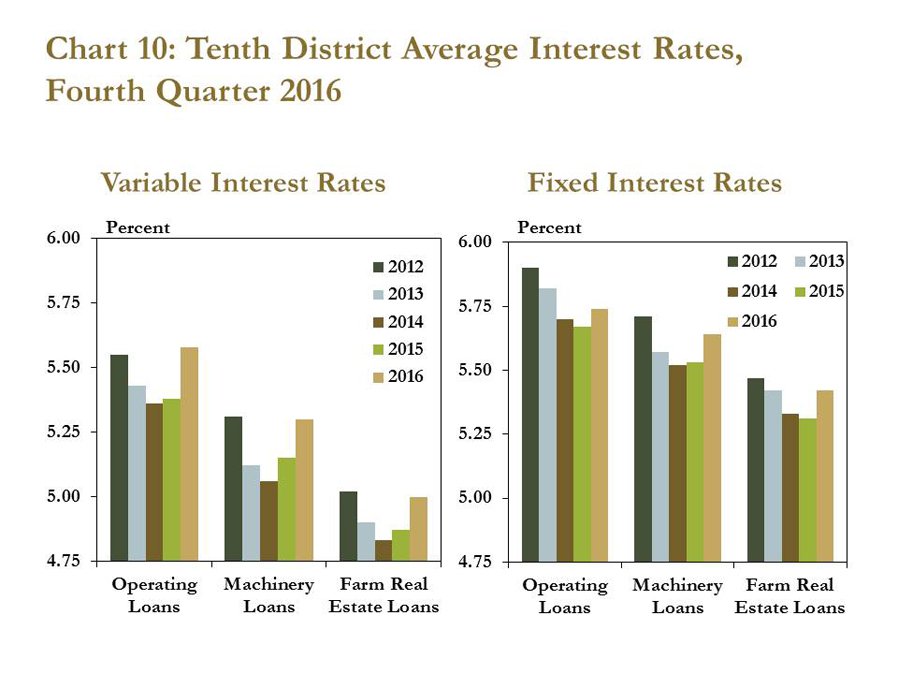
Bankers have adopted some risk prevention measures in response to downbeat credit conditions. For example, variable and fixed interest rates increased for all types of farm loans (Chart 10). Notably, the variable interest rate for operating loans increased 0.20 percentage point, reaching the highest level since the third quarter of 2012. Minor movements in the interest rate market may explain a portion of the increase, but it also is likely that bankers have sought higher returns to compensate for increased risk.
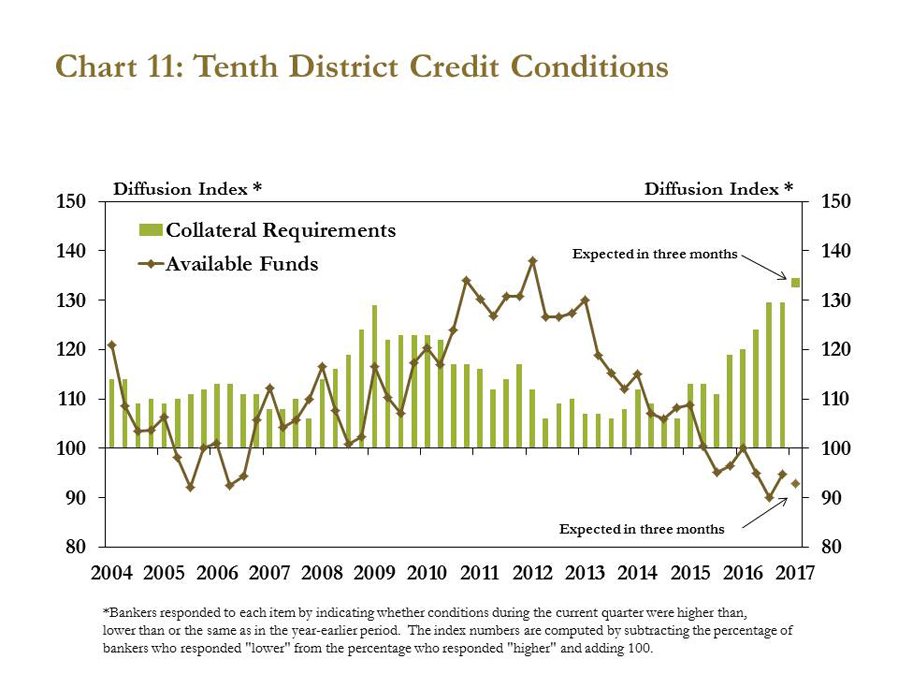
In addition to raising interest rates, bankers also reduced the amount of funds available for financing. The fourth quarter was the sixth consecutive quarter in which the availability of funds either declined or remained unchanged (Chart 11). More than 30 percent of bankers also reported an increase in collateral requirements, the largest share in survey history. Though a credit shortage currently appears unlikely, marginal producers may find it harder to obtain financing at the same pace as when farm credit conditions were stronger.
Looking Ahead
In the fourth quarter, most measures of financial stress in the farm sector ticked up. Bankers reported reduced farmland values, lower farm income and weaker credit conditions. To mitigate risk, Tenth District banks increased interest rates and collateral requirements. Although some bankers reported that record yields supported farm income in 2016, another round of above-average yields could contribute to higher stocks, which are correlated with lower commodity prices and depressed repayment rates. Looking to 2017, bankers indicated that a decline in cash rents may provide some relief, but they still expect farm income to remain subdued.
____________________
Endnotes
-
1 Data calculated from the U.S. Department of Agriculture, Economic Research Service, Commodity Costs and Returns division, “Cost-of-Production Forecasts,” available at External Linkhttps://www.ers.usda.gov/data-products/commodity-costs-and-returns/commodity-costs-and-returns/#Cost-of-Production Forecasts
The views expressed in this article are those of the authors and do not necessarily reflect the views of the Federal Reserve Bank of Kansas City or the Federal Reserve System.
Author
