Small business commercial & industrial (C&I) loan balances in the fourth quarter of 2021 decreased nearly 27 percent since the fourth quarter of 2020. The decrease reflects continuing declines in outstanding Paycheck Protection Program (PPP) loans held by the 129 survey respondents and in loans guaranteed by the Small Business Administration (SBA). New small business C&I lending increased approximately 38 percent year-over-year, comparing two quarters (the fourth quarters of 2020 and 2021) that did not include new PPP lending. On net, credit quality maintained its upward trend with loan approvals increasing across all bank sizes and loan demand remaining strong. Respondents reported tightening credit standards and loan terms.
Chart 1: Outstanding Small Business Loan Balances Decrease
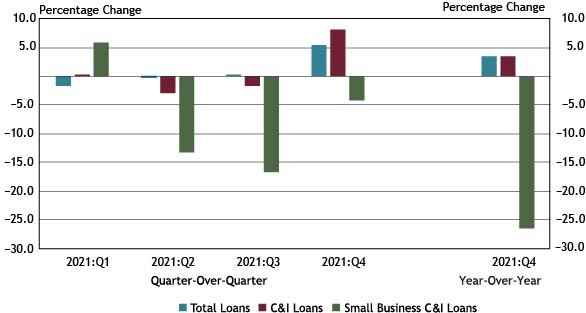
Note: Items are calculated using a subset of 88 respondents that completed the FR 2028D for the last five quarters surveyed.
Sources: Call Report, schedule RC-C Part I, items 4. Commercial and Industrial Loans and 12. Total loans and leases held for investment and held for sale; and FR 2028D, items 4.b and 5.c.
Small business C&I loan balances in the fourth quarter decreased 4.3 percent quarter-over-quarter and 26.5 percent year-over-year. The continued decline in small business loan balances is likely attributed to the expiration of the PPP and an increase in PPP loan forgiveness payments. According to the SBA, 83 percent of the total PPP loan value had been forgiven as of December 26, 2021. This was a 13 percent increase in PPP loan forgiveness compared with the third quarter of 2021. Total loans and total C&I loans increased 3.5 percent and 3.4 percent, respectively, compared with the fourth quarter of 2020.
Chart 2: Outstanding Loan Balances Guaranteed by the SBA Continue Sharp Decline
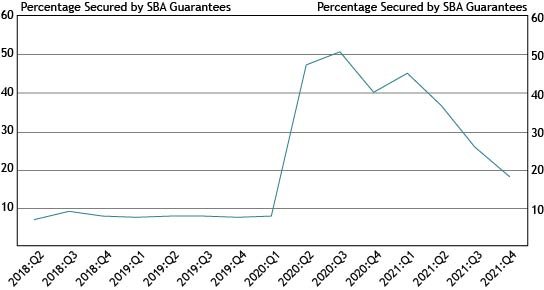
Source: FR 2028D, Special Question.
Small business loan balances guaranteed by the SBA continue to decline due to PPP loan forgiveness but remain higher than before the start of the pandemic. In the fourth quarter of 2021, small business loan balances guaranteed by the SBA declined to 18 percent, a 41 percent total decline from the previous quarter. Pre-pandemic balances guaranteed by the SBA had remained steady at approximately 8 percent since the second quarter of 2018. The two most utilized SBA lending programs cited by respondents were the PPP and the 7(a) Loan Program.
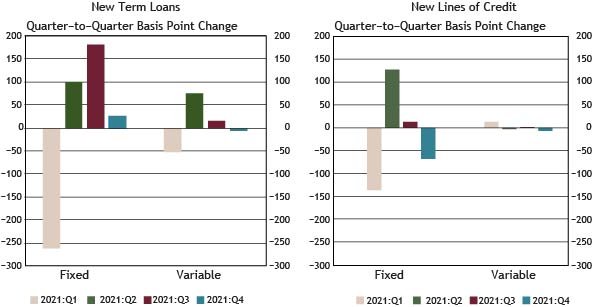
Chart 3: New Small Business Credit Line Balances Increase Quarter-Over-Quarter and Year-Over-Year
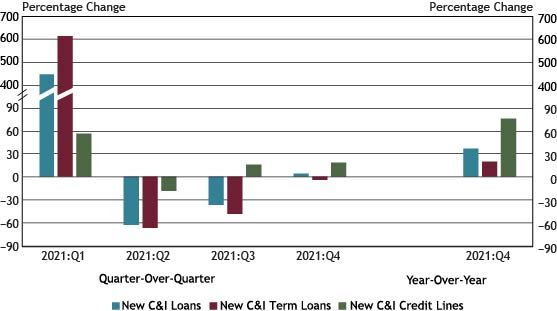
Note: Items are calculated using a subset of 88 respondents that completed the FR 2028D for the last five quarters surveyed. All loan types referenced in Chart 3 refer to small business lending.
Source: FR 2028D, items 7.b and 8.c.
New small business C&I loan balances increased approximately 38 percent year-over-year, driven by a 77 percent increase in lines of credit. The increase in new credit lines is likely still attributable to a shift in small business financing from term loans inflated by PPP-driven lending to credit lines. New term lending increased nearly 21 percent year-over-year, notably comparing the fourth quarters of 2020 and 2021, neither of which included PPP lending.
Chart 4: Credit Line Usage Remains Stable
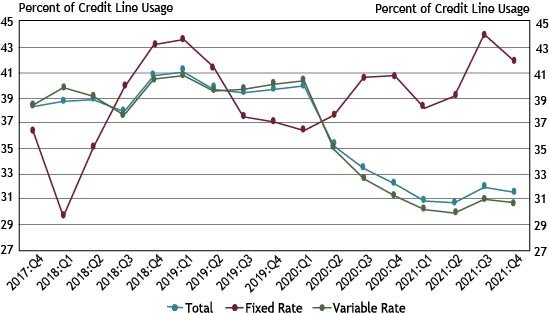
Source: FR 2028D, items 5.b and 5.c.
Total credit line usage remained stable in the fourth quarter. Use of fixed rate lines of credit decreased slightly from 44 percent in the third quarter to approximately 42 percent in the fourth quarter, but accounted for only 10 percent of total credit lines.
Chart 5: Interest Rates Mixed Across New Loan Categories
Note: Items are calculated using a subset of 88 respondents that completed the FR 2028D for the last five quarters surveyed.
Source: FR 2028D, items 7.c and 8.d.
Average fixed rates on new term loans increased in the last quarter but decreased for new lines of credit. The leveling off of new fixed rate term loans may be a result of normalizing rates following the end of the PPP lending program. Variable rates on new term loans and lines of credit remained relatively stable. The largest change, a decrease of 69 basis points, was reported for fixed rate lines of credit.
Chart 6: New Term Loan Rates Higher Than New Lines of Credit
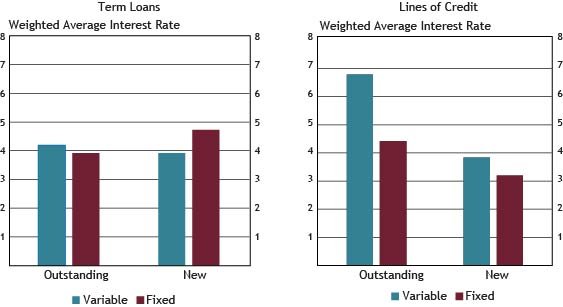
Note: Average interest rates are weighted by the dollar volume of new small business C&I loans.
Source: FR 2028D, items 4.c, 5.d, 7.c and 8.d.
Average rates on all small business lending ranged from 3.19 to 6.78 percent. The highest rate of 6.78 was reported for outstanding variable rate lines of credit, and the lowest was 3.19 for new fixed rate lines of credit. Since the first quarter of 2021, the average interest rates on fixed rate term loans have continually increased, consistent with the paydowns and forgiveness of PPP loans originated at an interest rate of 1 percent.
Chart 7: New Loans with Interest Rate (IR) Floors Increase Slightly
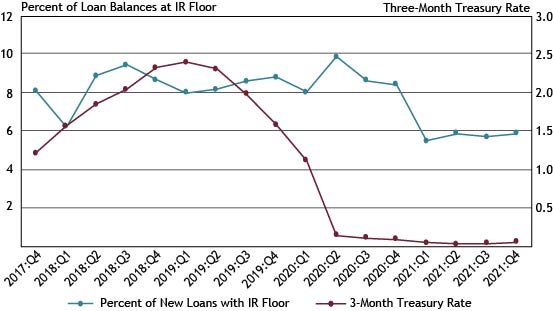
Source: FR 2028D, items 7.a, 7.f, 8.a, 8.e and Federal Reserve Bank of St. Louis, 3-Month Treasury Constant Maturity Rate.
The percentage of variable-rate loans with interest rate floors has remained relatively stable throughout 2021 but increased slightly from 5.7 to 5.9 percent in the fourth quarter.
Chart 8: Respondents Report Mixed Credit Line Usage
Notes: Chart 8 shows diffusion indexes for credit line usage. The diffusion indexes show the difference between the percent of banks reporting decreased credit line usage and those reporting increased credit line usage. Net percent refers to the percent of banks that reported having decreased (“decreased somewhat” or “decreased substantially”) minus the percent of banks that reported having increased (“increased somewhat” or “increased substantially”).**
Source: FR 2028D, items 11 and 12.
**Small banks have total assets of $1 billion or less, midsized banks have total assets between $1 billion and $10 billion and large banks have total assets greater than $10 billion.
In the fourth quarter, about 23 percent of respondents reported a change in credit line usage, a decline from 32 percent in the third quarter. Responses were split nearly evenly between increases and decreases. On net, about 2.5 percent of large banks and 1.5 percent of midsized banks reported an increase, while about 2.5 percent of small banks reported a decrease. Of the banks reporting a change, 43 percent cited changes in national or local economic conditions as a very important reason for a change while 30 percent cited changes in borrower’s business revenue or other business specific conditions.
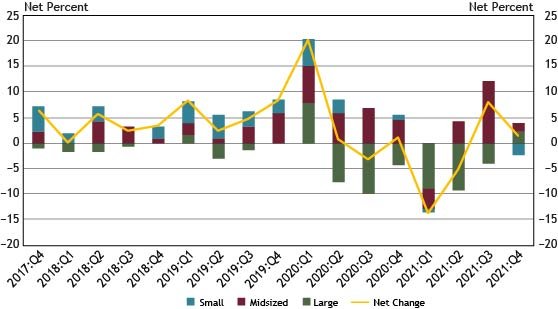
Chart 9: Respondents Continue to Report Stronger Loan Demand
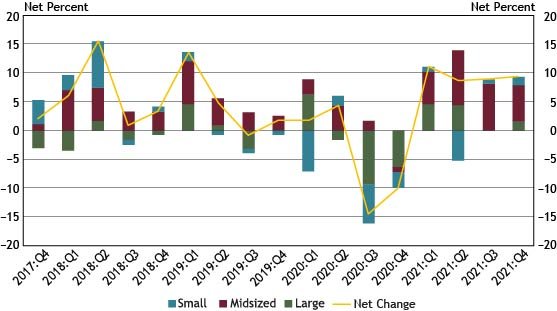
Notes: Chart 9 shows diffusion indexes for loan demand. The diffusion indexes show the difference between the percent of banks reporting weakened loan demand and those reporting stronger loan demand. Net percent refers to the percent of banks that reported having weakened (“moderately weaker” or “substantially weaker”) minus the percent of banks that reported having stronger loan demand (“moderately stronger” or “substantially stronger”).
Source: FR 2028D, item 13.
In the fourth quarter, about 31 percent of respondents reported a change in loan demand. On net, about 6 percent of midsized banks and about 1.5 percent of small and large banks, respectively, indicated stronger loan demand. The percent of respondents indicating stronger loan demand on net has remained stable at about 9 percent throughout 2021.
Chart 10: Loan Approval Rates Increase Across All Bank Sizes
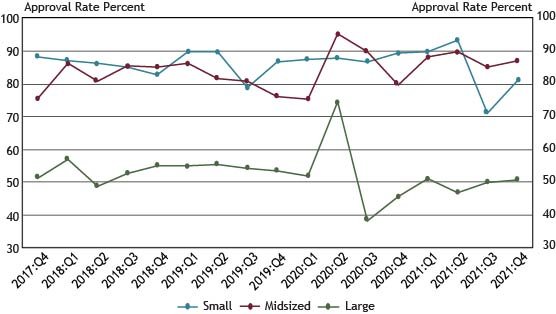
Source: FR 2028D, items 14.a and 15.
Application approval rates for small banks increased from 71 percent in the third quarter to 81 percent in the fourth quarter of 2021. Approval rates for midsized and large banks remained stable. The two most cited reasons for denying a loan were borrower financials and credit history.
Chart 11: Credit Quality Continues Upward Trend
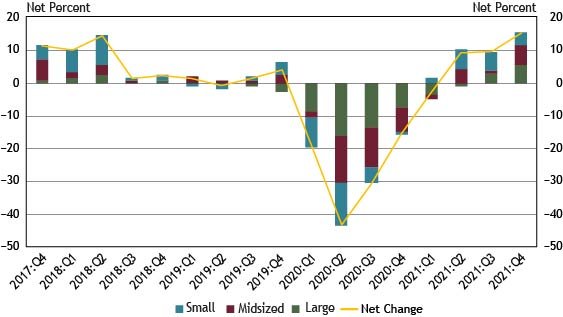
Notes: Chart 11 shows diffusion indexes for credit quality of applicants. The diffusion indexes show the difference between the percent of banks reporting a decline in credit quality and those reporting improvement in credit quality. Net percent refers to the percent of banks that reported declining credit quality (“declined somewhat” or “declined substantially”) minus the percent of banks that reported improving credit quality (“improved somewhat” or “improved substantially”).
Source: FR 2028D, items 20 and 21.
About 16 percent of banks, on net, reported an increase in applicant credit quality. All three bank sizes reported a net increase, with large and midsized banks reporting increases of 5 and 6 percent, respectively. Of respondents reporting a change in credit quality, whether an increase or decrease, 50 percent cited the debt-to-income level of commercial borrowers as a very important reason for change. Other commonly cited reasons for a change were the liquidity positions of borrowers and personal wealth of business owners.
Chart 12: Banks Tighten Credit Standards and Most Loan Terms
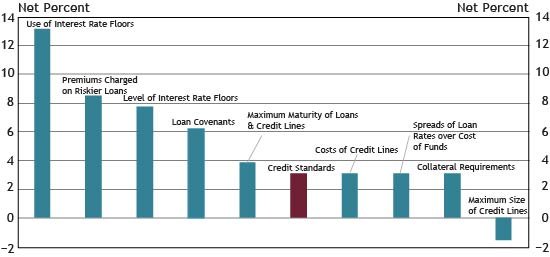
Note: Chart 12 shows diffusion indexes for credit standards (red bar) and various loan terms. The diffusion indexes show the difference between the percent of banks reporting tightening terms and those reporting easing terms. Net percent refers to the percent of banks that reported having tightened (“tightened somewhat” or “tightened considerably”) minus the percent of banks that reported having eased (“eased somewhat” or “eased considerably”).
Source: FR 2028D, items 16, 17, 18 and 19.
About 12 percent of respondents reported a change in credit standards in the fourth quarter of 2021, up about 1 percent from the third quarter. Of banks indicating a change in credit standards, 3.1 percent, on net, reported tightening credit standards, compared with the 1.6 percent of respondents who reported easing credit standards in the prior quarter.
On net, respondents indicated that most loan terms tightened with the use of interest rate floors, premiums charged on riskier loans and level of interest rate floors. Respondents who reported tightening credit standards or loan terms in the fourth quarter cited a less favorable or more uncertain economic outlook, worsening of industry-specific problems and reduced tolerance for risk. Respondents who reported easing credit standards or loan terms in the fourth quarter cited more aggressive competition from non-bank lenders and other banks as well as a less uncertain economic outlook.
* Other contributors to the release include Nicholas Bloom, Dan Harbour, Alli Jakubek, Stefan Jacewitz, Emily Robinson, Trudy Vandever and Tony Walker.
The views expressed are those of the authors and do not necessarily reflect the positions of the Federal Reserve Bank of Kansas City or the Federal Reserve System.
Author