Small business commercial and industrial (C&I) lending_ increased marginally in the fourth quarter 2022, when compared with the previous quarter. Outstanding loan balances increased slightly for the first time in six quarters, while new small business loan balances rose by 3.1 percent from third quarter 2022. When compared to the fourth quarter 2021, the steep declines in small business lending aligned with the tightening credit standards reported for the fifth consecutive quarter. The 134 respondents to the survey also noted rising interest rates, and declining loan demand and credit quality. The impact of supply chain disruptions on small business lending declined in the fourth quarter when compared to previous quarters.
Chart 1: Small Business Loan Balances Decreased Year-Over-Year
Skip to data visualization tableNote: Items are calculated using a subset of 94 respondents that completed the FR 2028D for the last five quarters surveyed.
Sources: Call Report, Schedule RC-C Part I, items 4. Commercial and Industrial Loans and 12. Total Loans and Leases Held for Investment and Held for Sale, Small Business Administration, and FR 2028D, items 4.b and 5.c.
| Quarter-Over-Quarter | Total Loans | C&I Loans | Small Business C&I Loans |
|---|---|---|---|
| 2022:Q1 | 1.46 | 4.61 | -7.95 |
| 2022:Q2 | 4.84 | 5.82 | -6.31 |
| 2022:Q3 | 1.54 | 2.67 | -4.19 |
| 2022:Q4 | 1 | 1.89 | 0.24 |
| Year-Over-Year 2022:Q4 | 9.1 | 15.8 | -17.17 |
In the fourth quarter, small business loans (dark teal bars) increased by just 0.2 percent, following six consecutive quarters of declining balances. Year-over-year, these small business loan balances decreased by 17.2 percent. The decline is consistent with rising interest rates and weaker loan demand reported, on net, by survey respondents. It is also partially attributable to the decline in outstanding Paycheck Protection Program (PPP) loans over the same time period. According to the most recent data from the Small Business Administration, 96 percent of PPP loan balances had been forgiven as of October 23, 2022. This is a 13 percent increase in loan forgiveness from December 2021. Despite the large year-over-year decrease in small business loans, total loans and total C&I loans increased 9.1 percent and 15.8 percent, respectively.
Chart 2: New Small Business Lending Declines Year-Over-Year
Skip to data visualization tableNote: Items are calculated using a subset of 94 respondents that completed the FR 2028D for the last five quarters surveyed. All loan types referenced in Chart 2 refer to small business lending.
Source: FR 2028D, items 7.b and 8.c.
| Quarter-Over-Quarter | Total New C&I Loans | New C&I Term Loans | New C&I Credit Lines |
|---|---|---|---|
| 2022:Q1 | -7.21 | -10.38 | -2.11 |
| 2022:Q2 | -2.76 | 3.72 | -12.28 |
| 2022:Q3 | -13.19 | -10.44 | -17.98 |
| 2022:Q4 | 3.06 | -3.62 | 15.75 |
| Year-Over-Year 2022:Q4 | -19.27 | -19.76 | -18.48 |
Compared to fourth quarter 2021, total new small business balances (purple bars) decreased 19.3 percent, driven by a 19.8 percent decrease in new term loans (blue bars) and an 18.5 percent decrease in new lines of credit (dark teal bars). The year-over-year decline in new small business lending is consistent with a rising rate environment and the weaker loan demand reported, on net, by survey respondents. Quarter-over-quarter, total new small business loans increased 3.1 percent due to a 15.8 percent increase in balances on new lines of credit driven primarily by large bank lending, offset by a 3.6 percent decrease in new term loans.
Chart 3: Credit Line Usage Remains Stable
Skip to data visualization tableSource: FR 2028D, items 5.b and 5.c.
| Quarter | Total | Fixed Rate | Variable Rate |
|---|---|---|---|
| 2017:Q4 | 38.28 | 36.33 | 38.44 |
| 2018:Q1 | 38.79 | 29.62 | 39.87 |
| 2018:Q2 | 38.84 | 35.07 | 39.2 |
| 2018:Q3 | 37.91 | 39.85 | 37.71 |
| 2018:Q4 | 40.76 | 43.25 | 40.49 |
| 2019:Q1 | 41.05 | 43.66 | 40.77 |
| 2019:Q2 | 39.71 | 41.38 | 39.53 |
| 2019:Q3 | 39.43 | 37.56 | 39.66 |
| 2019: Q4 | 39.73 | 37.15 | 40.04 |
| 2020:Q1 | 39.98 | 36.42 | 40.34 |
| 2020:Q2 | 35.26 | 37.69 | 34.99 |
| 2020:Q3 | 33.46 | 40.64 | 32.66 |
| 2020:Q4 | 32.2 | 40.72 | 31.33 |
| 2021:Q1 | 30.83 | 38.2 | 30.16 |
| 2021:Q2 | 30.77 | 39.17 | 29.97 |
| 2021:Q3 | 32 | 44.04 | 30.94 |
| 2021:Q4 | 31.56 | 41.86 | 30.71 |
| 2022:Q1 | 31.79 | 41.35 | 31 |
| 2022:Q2 | 32.08 | 36.64 | 31.63 |
| 2022:Q3 | 31.7 | 37.28 | 31.11 |
| 2022:Q4 | 32.49 | 39.8 | 31.63 |
Usage of small business credit lines remained stable in the fourth quarter at 32 percent, despite a slight increase in the utilization of fixed rate credit lines. As of fourth quarter 2022, respondents indicated variable rate lines make up about 90 percent of total credit line usage.
Chart 4: Rates Increase on New Term Loans
Skip to data visualization tableNote: Items are calculated using a subset of 94 respondents that completed the FR 2028D for the last five quarters surveyed.
Source: FR 2028D, item 7.c.
| Quarter | Fixed New Term Loans | Variable New Term Loans |
|---|---|---|
| 2021:Q4 | 4.08 | 4.02 |
| 2022:Q1 | 4.25 | 4.39 |
| 2022:Q2 | 4.78 | 5.25 |
| 2022:Q3 | 5.56 | 6.25 |
| 2022:Q4 | 6.44 | 7.44 |
Median interest rates increased for new small business term loans in fourth quarter 2022. The variable and fixed median rates were reported as 7.44 percent and 6.44 percent, respectively. Since fourth quarter 2021, the median interest rates on fixed and variable rate term loans have increased by about 236 basis points and 342 basis points, respectively. The rate increases are directionally consistent with 425 basis point increase in the Federal Funds Rate since the fourth quarter 2021.
Chart 5: Rates Increase on New Lines of Credit
Skip to data visualization tableNote: Items are calculated using a subset of 94 respondents that completed the FR 2028D for the last five quarters surveyed.
Source: FR 2028D, item 8.d.
| Quarter | Fixed New LOC | Variable New LOC |
|---|---|---|
| 2021:Q4 | 3.86 | 4.21 |
| 2022:Q1 | 4.13 | 4.47 |
| 2022:Q2 | 4.46 | 5.52 |
| 2022:Q3 | 5.33 | 6.79 |
| 2022:Q4 | 6.22 | 8.13 |
Median interest rates on new small business lines of credit increased in fourth quarter 2022. The median interest rates for variable and fixed rate lines of credit were reported as 8.13 percent and 6.22 percent, respectively. This was a 134 basis point increase for variable lines and 89 basis point increase for fixed rate lines since the third quarter of 2022. The rate increases are consistent with the overall rising rate environment.
Chart 6: New Loans with Interest Rate (IR) Floors Remain Stable
Skip to data visualization tableSources: FR 2028D, items 7.a, 7.f, 8.a, 8.e and Federal Reserve Bank of St. Louis, 3-Month Treasury Constant Maturity Rate.
| Quarter | Percent of Loan Balances with IR Floor | Three-Month Treasury Rate |
|---|---|---|
| 2017:Q4 | 8.07 | 1.21 |
| 2018:Q1 | 6.22 | 1.56 |
| 2018:Q2 | 8.86 | 1.84 |
| 2018:Q3 | 9.43 | 2.04 |
| 2018:Q4 | 8.64 | 2.32 |
| 2019:Q1 | 7.98 | 2.39 |
| 2019:Q2 | 8.15 | 2.3 |
| 2019:Q3 | 8.58 | 1.98 |
| 2019:Q4 | 8.80 | 1.58 |
| 2020:Q1 | 8.00 | 1.11 |
| 2020:Q2 | 9.82 | 0.14 |
| 2020:Q3 | 8.60 | 0.11 |
| 2020:Q4 | 8.39 | 0.09 |
| 2021:Q1 | 5.47 | 0.05 |
| 2021:Q2 | 5.85 | 0.03 |
| 2021:Q3 | 5.67 | 0.04 |
| 2021:Q4 | 5.85 | 0.06 |
| 2022:Q1 | 5.01 | 0.52 |
| 2022:Q2 | 4.87 | 1.72 |
| 2022:Q3 | 5.03 | 3.33 |
| 2022:Q4 | 5.13 | 4.42 |
While the three-month Treasury Rate increased 109 basis points in fourth quarter 2022, the percentage of new variable-rate loans with interest rate floors remained relatively stable for the seventh consecutive quarter.
Chart 7: Respondents Report Increase in Credit Line Usage
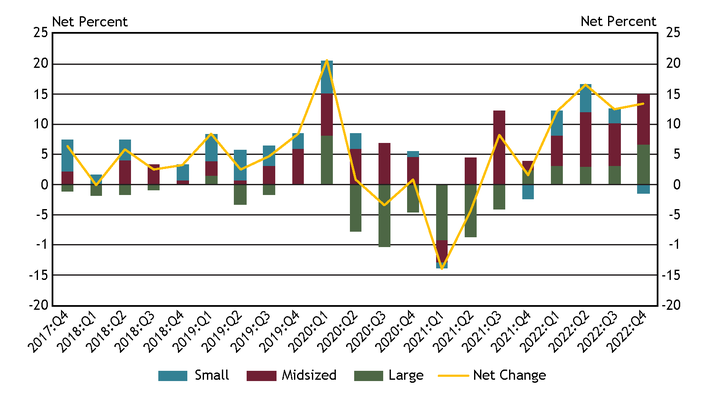
Note: Chart 7 shows diffusion indexes for credit line usage. The diffusion indexes show the difference between the percent of banks reporting decreased credit line usage and those reporting increased credit line usage. Net percent refers to the percent of banks that reported having decreased (“decreased somewhat” or “decreased substantially”) minus the percent of banks that reported having increased (“increased somewhat” or “increased substantially”)._
Source: FR 2028D, items 11 and 12.
In the fourth quarter, 37 percent of respondents reported a change in credit line usage, with 13 percent of respondents, on net, indicating that credit line usage increased. On net, about 7 percent of large banks and 8 percent of midsized banks reported an increase, while about 2 percent of small banks reported a decrease. Of the banks reporting an increase, 44 percent cited changes in national or local economic conditions and 24 percent cited changes in borrowers’ business revenue or other business-specific conditions as very important reasons. Of the banks reporting a decrease, 81 percent cited changes in pricing (rates, fees, etc.) as a very important reason, while 38 percent cited changes in national or local economic conditions. The net reported increase in credit line usage is consistent with a shift to increased debt financing observed in other key indicators such as higher consumer credit card debt. _
Chart 8: Respondents Report Declines in Loan Demand for Third Consecutive Quarter
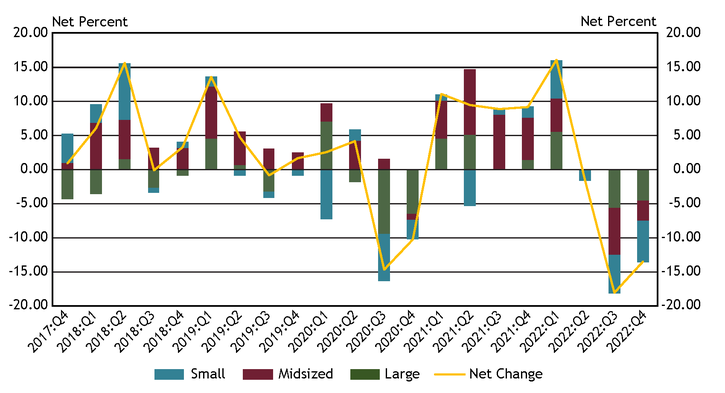
Note: Chart 8 shows diffusion indexes for loan demand. The diffusion indexes show the difference between the percent of banks reporting weakened loan demand and those reporting stronger loan demand. Net percent refers to the percent of banks that reported having weakened (“moderately weaker” or “substantially weaker”) minus the percent of banks that reported having stronger loan demand (“moderately stronger” or “substantially stronger”).
Source: FR 2028D, item 13.
About 39 percent of respondents reported a change in small business loan demand in fourth quarter 2022, a decrease of six percent from the third quarter. On net, about 13 percent of respondents indicated weaker loan demand across all bank sizes for the second consecutive quarter. About 6 percent of small banks, on net, reported softening loan demand, with about 4 and 3 percent of large and midsized banks, respectively, reporting the same. The softening loan demand aligns with the January 2023 Federal Reserve Senior Loan Officer Opinion Survey (SLOOS)_, where 50 percent of respondents reported weaker C&I loan demand from small firms (annual sales of less than $50 million) over the prior three months.
Chart 9: Impact of Supply Chain Disruptions on Loan Demand Eases
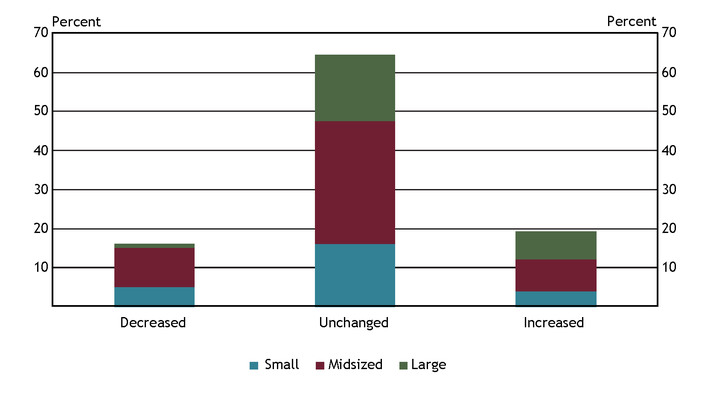
Source: FR 2028D, Special Question.
The impact of supply chain disruptions on small businesses eased in fourth quarter, the final quarter for the supply chain special survey question, with only 35 percent of survey respondents attributing a change in small business loan demand to the disruptions, a 10 percent decrease compared to third quarter 2022. About 19 percent of survey respondents reported the disruptions increased loan demand for small businesses while 16 percent indicated loan demand decreased. The most cited reasons for an increase in demand were related to the need for small businesses to carry more inventory due to future supply chain concerns and the need for additional capital due to increasing prices. The most cited reason for a decrease in demand was related to small businesses being less likely to start new projects due to increased costs from constrained inventories or supplier delays.
Chart 10: Credit Quality Decreases
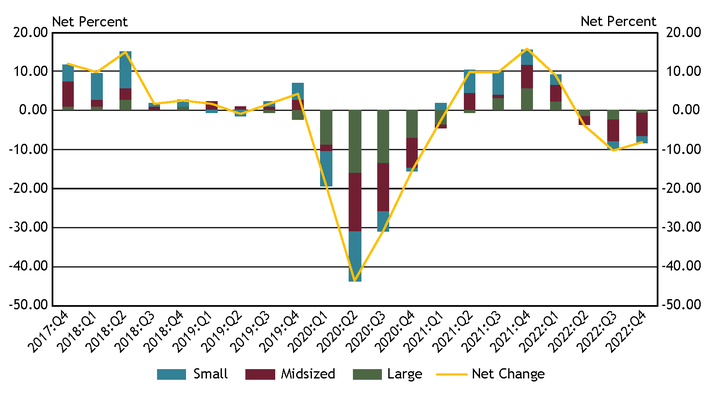
Note: Chart 10 shows diffusion indexes for credit quality of applicants. The diffusion indexes show the difference between the percent of banks reporting a decline in credit quality and those reporting improvement in credit quality. Net percent refers to the percent of banks that reported declining credit quality (“declined somewhat” or “declined substantially”) minus the percent of banks that reported improving credit quality (“improved somewhat” or “improved substantially”).
Source: FR 2028D, items 20 and 21.
About 8 percent of survey respondents, on net, reported a decrease in applicant credit quality. Small and large bank respondents reported a net decrease of about 1 percent during the period, while midsized banks indicated a net decrease of about 6 percent. Of respondents reporting a change in credit quality, whether an increase or decrease, 60 percent cited the debt-to-income level of commercial borrowers and liquidity position of borrowers as a very important reason for the change. Another commonly cited reason for a change was the quality of business collateral.
Chart 11: Application Approval Rates Decline for Midsized Banks
Skip to data visualization tableSource: FR 2028D, items 14.a and 15.
| Quarter | Small | Midsized | Large |
|---|---|---|---|
| 2017:Q4 | 88.14 | 75.33 | 51.07 |
| 2018:Q1 | 87 | 86.15 | 56.78 |
| 2018:Q2 | 86.32 | 80.9 | 48.71 |
| 2018:Q3 | 85.07 | 85.5 | 52.83 |
| 2018:Q4 | 82.91 | 85.18 | 55.04 |
| 2019:Q1 | 89.81 | 86.15 | 55.12 |
| 2019:Q2 | 89.68 | 81.5 | 55.45 |
| 2019:Q3 | 79 | 80.93 | 54.01 |
| 2019:Q4 | 86.87 | 76.18 | 53.58 |
| 2020:Q1 | 87.44 | 75.45 | 51.93 |
| 2020:Q2 | 87.98 | 95.12 | 74.54 |
| 2020:Q3 | 86.52 | 89.81 | 38.33 |
| 2020:Q4 | 89.52 | 79.64 | 45.56 |
| 2021:Q1 | 89.73 | 88.23 | 51.24 |
| 2021:Q2 | 93.5 | 89.83 | 46.85 |
| 2021:Q3 | 71.2 | 85.2 | 49.78 |
| 2021:Q4 | 81 | 87.23 | 50.5 |
| 2022:Q1 | 83.15 | 77.35 | 51.31 |
| 2022:Q2 | 83.25 | 80.43 | 51.83 |
| 2022:Q3 | 86.77 | 86.5 | 48.34 |
| 2022:Q4 | 86.27 | 68.93 | 47.82 |
Application approval rates declined by 18 percent in the fourth quarter for midsized banks, reversing two straight quarters of increases, while approval rates for small and large banks remained flat. The overall decrease in application approval rates was consistent with three quarters of diminishing credit quality, on net, reported by survey respondents (Chart 10). The most cited reason for denying a loan was borrower financials (67 percent). Other commonly cited reasons were credit history and collateral.
Chart 12: Respondents Reported Tightening Credit Standards for the Fifth Consecutive Quarter
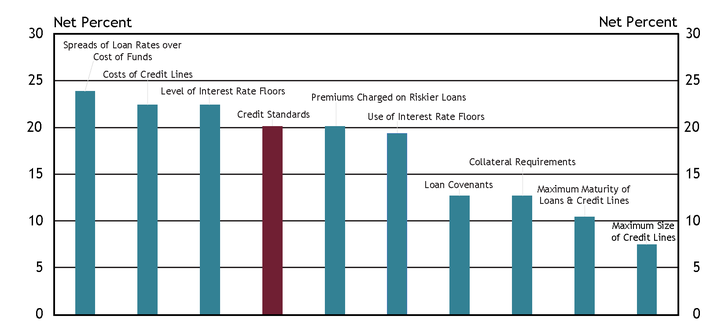
Note: Chart 12 shows diffusion indexes for credit standards (red bar) and various loan terms. The diffusion indexes show the difference between the percent of banks reporting tightening terms and those reporting easing terms. Net percent refers to the percent of banks that reported having tightened (“tightened somewhat” or “tightened considerably”) minus the percent of banks that reported having eased (“eased somewhat” or “eased considerably”).
Source: FR 2028D, items 16, 17, 18 and 19.
About 23 percent of respondents reported a change in credit standards in fourth quarter 2022, down about 2 percent from third quarter 2022. Of those indicating a change in credit standards, 20.2 percent, on net, reported tightening credit standards (red bar). This is the fifth consecutive quarter respondents reported tightening credit standards.
On net, respondents indicated that all loan terms tightened with the spreads of loan rates over cost of funds, cost of credit lines and level of interest rate floors tightening the most. Respondents cited less favorable or more uncertain economic outlook, worsening industry-specific problems and reduced tolerance for risk as the primary drivers.
Other contributors to the release include Lauren Bennett, Nicholas Bloom, Thomas Hobson, Alli Jakubek, Emily Robinson, Karen Thompson, and Tony Walker.
Endnotes
-
1 Small business lending refers to small business Commercial & Industrial lending unless explicitly noted otherwise.
-
2 Small banks have total assets of $1 billion or less, midsized banks have total assets between $1 billion and $10 billion and large banks have total assets greater than $10 billion.
-
3 Source: FRED, Consumer Loans: Credit Cards and Other Revolving Plans.
-
4
The views expressed are those of the authors and do not necessarily reflect the positions of the Federal Reserve Bank of Kansas City or the Federal Reserve System.
Authors

Dustyn DeSpain, Assistant Vice President
Assistant Vice President