Balances on small business commercial and industrial (C&I) loans declined in the second quarter of 2021, coinciding with the May 31 sunset of the Paycheck Protection Program (PPP) and increased PPP loan forgiveness payments. Outstanding small business C&I loan balances decreased by 13.4 percent compared with the second quarter of 2020, while new small business C&I loans decreased by 81.7 percent over the same period. Predictably, loans guaranteed by the Small Business Administration (SBA) continued to decline. On net, responses from the 116 survey participants indicated increasing credit quality and loan demand, despite loan application approval rates for large institutions declining in the second quarter. Respondents also reported that credit standards tightened along with most loan terms.
Chart 1: Small Business C&I Loan Balances Decrease
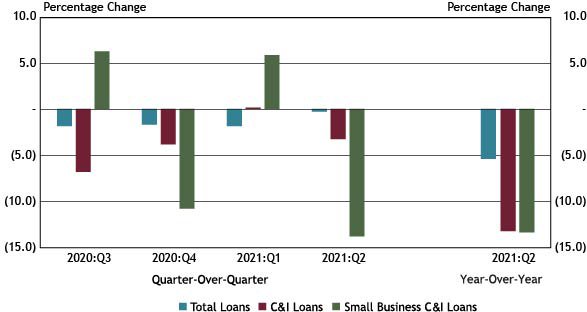
Note: Items are calculated using a subset of 88 respondents that completed the FR 2028D for the last five quarters surveyed.
Sources: Call Report, schedule RC-C Part I, items 4. Commercial and Industrial Loans and 12. Total loans and leases held for investment and held for sale; and FR 2028D, items 4.b and 5.c.
Outstanding small business C&I loan balances decreased 13.8 percent quarter-over-quarter and 13.4 percent year-over-year, reversing seven consecutive quarters of year-over-year increases. The decline in small business C&I loan activity is likely attributed to the expiration of the PPP on May 31 and the increase in PPP loan forgiveness payments that stood at over 50 percent of total PPP loan values as of June 30, according to SBA data. Along with the reduction in balances associated with the PPP, other SBA sponsored programs such as the Economic Injury Disaster Loan program, directly funded by the SBA, may have contributed to the decline in outstanding loan balances. Total loans and total C&I loans declined by 5.4 percent and 13.2 percent, respectively, when compared with the second quarter of 2020.
Chart 2: Outstanding Loans Guaranteed by the SBA Decline
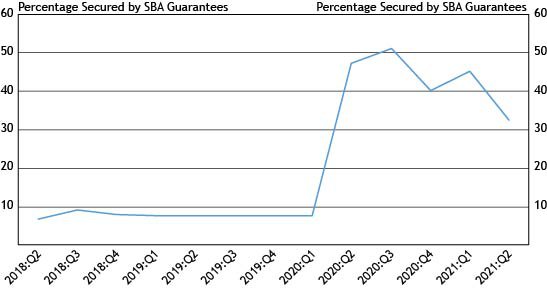
Source: FR 2028D, Special Question.
Outstanding small business C&I loan balances guaranteed by the SBA declined from 45 percent of total outstanding small business C&I loan balances to 32 percent in the second quarter of 2021, coinciding with PPP loan forgiveness and the end of the PPP program on May 31. The decline in the percentage of loans guaranteed by the SBA mirrors a similar decline in the fourth quarter of 2020, which was attributed to the expiration of the second round of PPP lending in August 2020, coupled with increased PPP loan forgiveness and paydowns. Before the pandemic, the percent of balances guaranteed by the SBA had remained steady, ranging from 7 percent to 9 percent.
Chart 3: New Small Business C&I Term Loan Balances Decrease
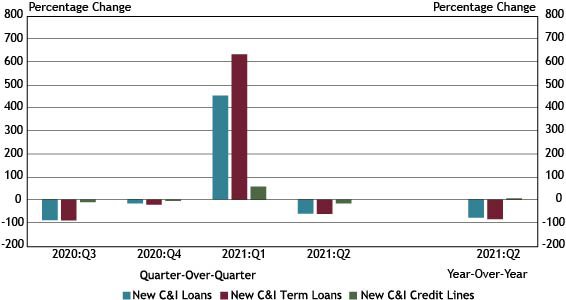
Note: Items are calculated using a subset of 88 respondents that completed the FR 2028D for the last five quarters surveyed. All loan types referenced in Chart 3 refer to small business lending.
Source: FR 2028D, items 7.b and 8.c.
Balances on new small business C&I loans decreased 62.1 percent in the second quarter compared with the previous quarter, driven by a 66.3 percent decrease in new term lending. Year-over-year, new small business lending decreased by 81.7 percent compared to the second quarter of 2020, also driven by reductions in term lending. The decrease in new small business loans is consistent with the decrease observed in the third quarter of 2020, again coinciding with the end of PPP lending and an influx of PPP forgiveness payments.
Chart 4: Credit Line Usage Remains Stable
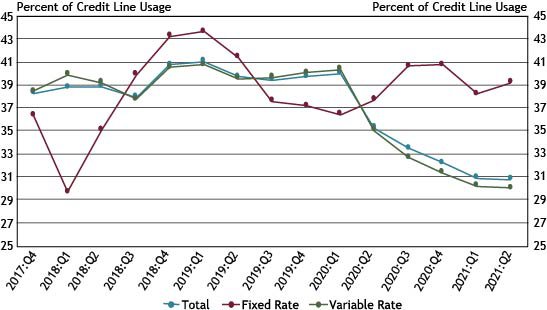
Source: FR 2028D, items 5.b and 5.c.
While total small business C&I credit line usage remained stable at 30.8 percent in the second quarter, banks observed a leveling off in the pronounced paydown trend that coincided with the start of the pandemic in the second quarter of 2020. Use of fixed-rate small business C&I lines of credit increased from 38.2 percent in the first quarter to 39.2 percent in the second quarter of 2021, but was offset by variable-rate small business C&I credit line usage, which decreased from 30.2 percent to 30.0 percent quarter-over-quarter.
Chart 5: Interest Rates Increase Across All New Loan Types
Note: Items are calculated using a subset of 88 respondents that completed the FR 2028D for the last five quarters surveyed.
Source: FR 2028D, items 7.c and 8.d
Weighted average interest rates increased across all new small business loan types, with the largest increase of 146 basis points reported for fixed-rate lines of credit. The increase in the weighted average interest rates for new term loans primarily can be attributed to banks originating fewer PPP loans at a 1 percent interest rate with the May 31, 2021 close of the SBA program.
Chart 6: Interest Rates on Term Loans Lower than Most Interest Rates on Lines of Credit
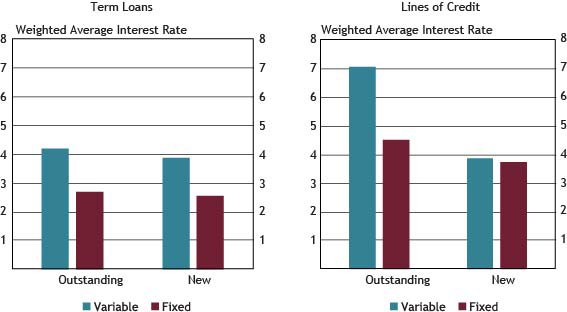
Note: Average interest rates are weighted by the dollar volume of new small business C&I loans.
Source: FR 2028D, items 4.c, 5.d, 7.c and 8.d.
Weighted average interest rates on variable and fixed-rate new and outstanding small business C&I term loans and lines of credit ranged from 2.54 to 7.02 percent. The weighted average interest rates on outstanding variable-rate lines of credit were the highest, at 7.02 percent, while weighted average interest rates on outstanding and new fixed-rate term loans were the lowest, at 2.69 and 2.54 percent, respectively.
Chart 7: New Small Business C&I Loans with Interest Rate Floors Increase Slightly
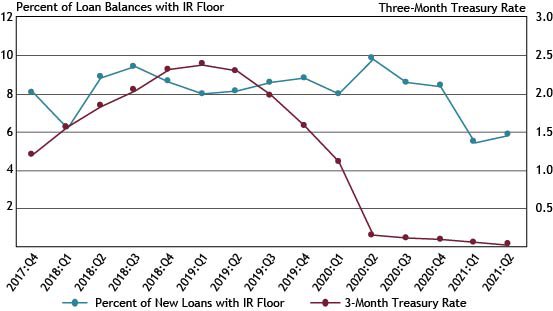
Source: FR 2028D, items 7.a, 7.f, 8.a and 8.e, Federal Reserve Bank of St. Louis, 3-Month Treasury Constant Maturity Rate
The percentage of new variable-rate small business C&I loans with interest rate floors increased marginally, from 5.5 to 5.9 percent in the second quarter, while the Three-Month U.S. Treasury Rate declined to 0.03 percent during the same period.
Chart 8: Respondents Report Mixed Credit Line Usage
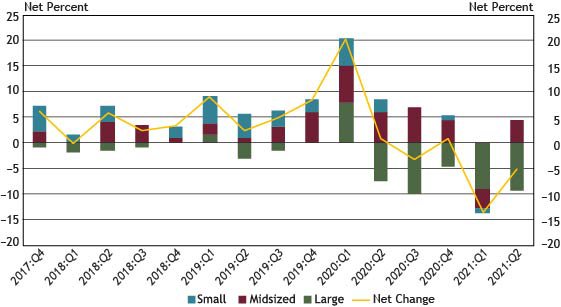
Notes: Chart 8 shows diffusion indexes for credit line usage. The diffusion indexes show the difference between the percent of banks reporting decreased credit line usage and those reporting increased credit line usage. Net percent refers to the percent of banks that reported having decreased (“decreased somewhat” or “decreased substantially”) minus the percent of banks that reported having increased (“increased somewhat” or “increased substantially”).*
Source: FR 2028D, items 11 and 12.
Respondents indicating a change in credit line usage, whether an increase or decrease, remained at 38 percent in the second quarter of 2021. On net, about 5 percent reported a decrease in credit line usage, primarily driven by large banks. Of banks reporting a change in credit line usage, 52 percent cited change in local or national economic conditions and 46 percent cited change in a borrower’s business revenue or other business specific conditions as very important reasons for a change. As referenced in Chart 4, aggregate credit line balances have consistently declined since the beginning of the pandemic in the second quarter of 2020.
Chart 9: Most Respondents Report Stronger Loan Demand
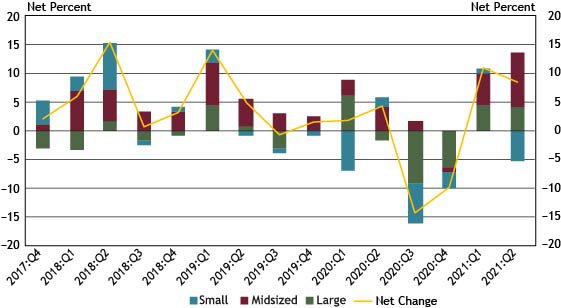
Notes: Chart 9 shows diffusion indexes for loan demand. The diffusion indexes show the difference between the percent of banks reporting weakened loan demand and those reporting stronger loan demand. Net percent refers to the percent of banks that reported having weakened (“moderately weaker” or “substantially weaker”) minus the percent of banks that reported having stronger loan demand (“moderately stronger” or “substantially stronger”).
Source: FR 2028D, item 13.
In the second quarter, about 38 percent of banks reported a change in loan demand. On net, about 9 percent of midsized banks indicated stronger loan demand, compared with about 4 percent of large banks. In contrast, about 5 percent of small banks reported weaker loan demand. Overall, about 9 percent of respondents indicated stronger loan demand in the second quarter.
Chart 10: Application Approval Rates Decrease for Large Banks
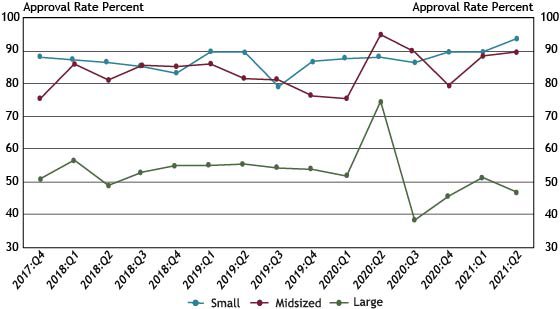
Source: FR 2028D, items 14.a and 15.
Approval rates for small business lending at large banks decreased from 51 percent in the first quarter to 47 percent in the second quarter of 2021. The three most commonly cited reasons for denying a loan for all bank sizes were borrower financials, credit history, and collateral. Approval rates for midsized banks increased from 88 percent to 90 percent during the same period, while approval rates at small banks increased from 90 percent to 94 percent.
Chart 11: Credit Quality Increases on Net
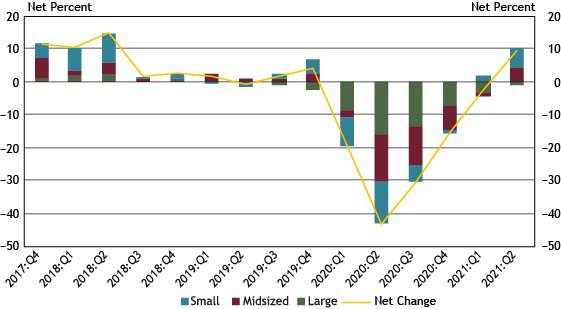
Notes: Chart 11 shows diffusion indexes for credit quality of applicants. The diffusion indexes show the difference between the percent of banks reporting a decline in credit quality and those reporting improvement in credit quality. Net percent refers to the percent of banks that reported declining credit quality (“declined somewhat” or “declined substantially”) minus the percent of banks that reported improving credit quality (“improved somewhat” or “improved substantially”).
Source: FR 2028D, items 20 and 21.
In the second quarter, about 9 percent of banks, on net, reported an increase in credit quality of applicants. This is the first period since the fourth quarter of 2019 – pre-pandemic – in which a net increase in the credit quality of applicants was reported, and the fourth consecutive quarter of respondents reporting a favorable trend. Small banks and midsized banks reported a net increase of 6 percent and 4 percent, respectively. The net increase reported by midsized banks reversed a five-quarter decline. Of respondents reporting a change in credit quality, whether an increase or decrease, 39 percent cited the debt-to-income level of commercial borrowers and recent business income growth as very important reasons for change. Another commonly cited reason for a change was the liquidity position of borrowers.
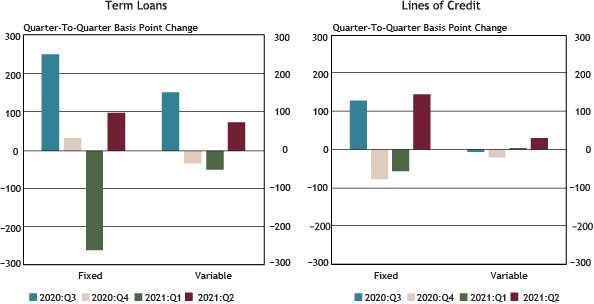
Chart 12: Banks Tighten Credit Standards and Most Loan Terms
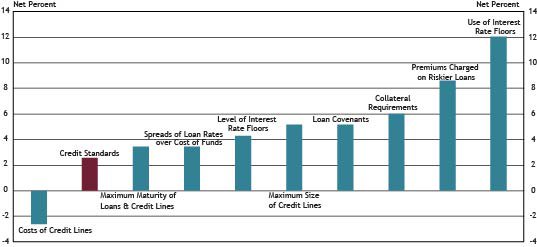
Note: Chart 12 shows diffusion indexes for credit standards (red bar) and various loan terms. The diffusion indexes show the difference between the percent of banks reporting tightening terms and those reporting easing terms. Net percent refers to the percent of banks that reported having tightened (“tightened somewhat” or “tightened considerably”) minus the percent of banks that reported having eased (“eased somewhat” or “eased considerably”).
Source: FR 2028D, items 16, 17, 18 and 19.
About 9 percent of respondents reported a change in credit standards in the second quarter of 2021, down about 11 percent from the first quarter of 2021. Of banks indicating a change in credit standards, 2.6 percent on net reported tightening credit standards (Chart 12), a decline of about 9 percent from the previous quarter.
On net, respondents indicated that all loan terms, except the cost of credit lines, tightened, with use of interest rate floors and premiums charged on riskier loans tightening the most. The reported easing of cost of credit lines was consistent with data reported in item 2c. of the Federal Reserve’s July 2021 Senior Loan Officer Opinion Survey (SLOOS). Respondents reporting tightening credit standards or loan terms in the second quarter cited a less favorable or more uncertain economic outlook, worsening industry specific problems, and reduced tolerance for risk.
Other contributors to the release include Rosine Boni, Dan Harbour, Thomas Hobson, Alli Jakubek, Stefan Jacewitz and Tony Walker.
*Small banks have total assets of $1 billion or less, midsized banks have total assets between $1 billion and $10 billion and large banks have total assets greater than $10 billion.
The views expressed are those of the authors and do not necessarily reflect the positions of the Federal Reserve Bank of Kansas City or the Federal Reserve System.
Author