In the first quarter, new small business lending_ decreased when compared to the previous quarter, while outstanding loan balances increased slightly. Interest rates for term loans moved closer to parity for urban and rural banks, while most rates on lines of credit increased.
With over $75 billion in small business loans reported, the 163 survey respondents reported credit standards tightened for the fourteenth consecutive quarter and credit quality declined for the twelfth consecutive quarter. Loan demand and application approval rates increased for midsized and large banks but decreased for small banks._ Despite this variance, most respondents indicated that the performance of existing small business loans will not impact credit standards for new loans.
Chart 1: Outstanding Small Business (SB) Loans Increase
Skip to data visualization tableNote: Items are calculated using a subset of 120 respondents that completed the FR 2028D for the last five quarters surveyed. As of 2024:Q4, the instructions were updated for Call Report, Schedule RC-C Part I, item 4. Commercial and Industrial Loans.
Sources: Call Report, Schedule RC-C Part I, items 4. Commercial and Industrial Loans and 12. Total Loans and Leases Held for Investment and Held for Sale, and FR 2028D, items 5.b and 6.c.
| Quarter-Over-Quarter | Total Loans | C&I Loans | SB Loans |
|---|---|---|---|
| 2024:Q2 | 0.6 | 0.2 | 0.4 |
| 2024:Q3 | -0.2 | -0.6 | -0.6 |
| 2024:Q4 | 0.5 | -3.0 | 0.5 |
| 2025:Q1 | 0.2 | -0.4 | 0.7 |
| Year-Over-Year 2025:Q1 | 1.2 | -3.8 | 1.0 |
When compared to first quarter 2024, outstanding small business loans increased by 1.0 percent and total loans increased by 1.2 percent. The year-over-year increase in small business loans was driven by increases at small and midsized banks. Quarter-over-quarter, small business loans increased by 0.7 percent and total loans increased by 0.2 percent.
Chart 2: New Small Business Loans Decrease Quarter-Over-Quarter
Skip to data visualization tableNote: Items are calculated using a subset of 120 respondents that completed the FR 2028D for the last five quarters surveyed. All loan types referenced in Chart 2 refer to small business lending.
Source: FR 2028D, items 7.b and 8.c.
| Quarter-Over-Quarter | Total New SB Loans | New SB Term Loans | New SB Credit Lines |
|---|---|---|---|
| 2024:Q2 | 0.3 | 2.9 | -4.7 |
| 2024:Q3 | 4.2 | -0.8 | 14.7 |
| 2024:Q4 | 1.6 | 3.1 | -1.2 |
| 2025:Q1 | -5.2 | -1.5 | -12.2 |
| Year-Over-Year 2025:Q1 | 0.7 | 3.7 | -5.3 |
Quarter-over-quarter, total new loan balances decreased by 5.2 percent, with a 1.5 percent decrease in new term loans and a 12.2 percent decrease in new credit lines. When compared to first quarter 2024, total new loan balances increased by 0.7 percent, with a 3.7 percent increase in new term loans and a 5.3 percent decrease in new credit lines. The year-over-year increase in new loans was primarily attributed to midsized bank activity.
Chart 3: Credit Line Usage Increases Slightly
Skip to data visualization tableNote: Usage refers to the proportion of the outstanding balance relative to the total committed amount (i.e. credit used vs credit available).
Source: FR 2028D, items 6.b and 6.c.
| Quarter | Fixed | Variable | Total |
|---|---|---|---|
| 2020:Q2 | 47.91 | 40.83 | 40.83 |
| 2020:Q3 | 47.09 | 37.33 | 38.09 |
| 2020:Q4 | 48.03 | 35.46 | 36.44 |
| 2021:Q1 | 44.09 | 33.74 | 35.38 |
| 2021:Q2 | 49.63 | 32.00 | 35.67 |
| 2021:Q3 | 47.83 | 36.33 | 37.55 |
| 2021:Q4 | 46.48 | 35.68 | 36.76 |
| 2022:Q1 | 47.91 | 35.62 | 36.22 |
| 2022:Q2 | 47.92 | 36.83 | 37.56 |
| 2022:Q3 | 50.07 | 36.67 | 37.90 |
| 2022:Q4 | 49.57 | 35.15 | 36.29 |
| 2023:Q1 | 50.88 | 34.44 | 36.43 |
| 2023:Q2 | 51.06 | 34.55 | 38.00 |
| 2023:Q3 | 48.28 | 34.83 | 38.17 |
| 2023:Q4 | 50.13 | 36.54 | 37.79 |
| 2024:Q1 | 51.65 | 36.47 | 38.28 |
| 2024:Q2 | 52.06 | 38.05 | 39.63 |
| 2024:Q3 | 52.05 | 38.15 | 39.62 |
| 2024:Q4 | 48.08 | 37.28 | 40.60 |
| 2025:Q1 | 50.25 | 38.81 | 41.88 |
Median usage of fixed rate lines of credit was 50.3 percent compared to 38.8 percent of variable rate lines of credit. Quarter-over-quarter, total credit line usage reflected a slight increase, from 40.6 percent to 41.9 percent. This data suggests businesses are maintaining a steady reliance on credit.
Variable rate lines constituted a larger portion of credit lines issued by banks, with respondents indicating that they made up about 89 percent of total credit line usage.
Chart 4: Urban and Rural Rates for New Term Loans Move Closer to Parity
Skip to data visualization tableNote: Items are calculated using a subset of 120 respondents that completed the FR 2028D for the last five quarters surveyed. Urban banks make up about 89 percent of the subset of respondents.
Source: FR 2028D, item 7.c.
| Quarter | Rural Fixed New Term Loans | Rural Variable New Term Loans | Urban Fixed New Term Loans | Urban Variable New Term Loans |
|---|---|---|---|---|
| 2024:Q1 | 8.37 | 8.50 | 7.93 | 8.75 |
| 2024:Q2 | 8.18 | 8.57 | 7.88 | 8.89 |
| 2024:Q3 | 7.99 | 8.21 | 7.70 | 8.51 |
| 2024:Q4 | 7.82 | 7.73 | 7.42 | 7.93 |
| 2025:Q1 | 7.47 | 7.90 | 7.33 | 7.99 |
Median interest rates increased for new variable rate term loans in first quarter 2025, while fixed rates decreased, bringing interest rates offered at urban banks closer to parity with their rural counterparts. The highest reported rates were for variable rate loans offered at urban banks, which were reported as 8.0 percent. The lowest were fixed rates offered at urban banks, which were reported as 7.3 percent. The largest change quarter-over-quarter was a 35-basis point decrease in fixed rates offered at rural banks._
Chart 5: Most Rates on New Lines of Credit (LOC) Increase
Skip to data visualization tableNote: Items are calculated using a subset of 120 respondents that completed the FR 2028D for the last five quarters surveyed. Urban banks make up about 89 percent of the subset of respondents.
Source: FR 2028D, item 8.d.
| Quarter | Rural Fixed New LOC | Rural Variable New LOC | Urban Fixed New LOC | Urban Variable New LOC |
|---|---|---|---|---|
| 2024:Q1 | 8.54 | 8.99 | 7.52 | 9.33 |
| 2024:Q2 | 8.13 | 9.14 | 7.50 | 9.09 |
| 2024:Q3 | 8.28 | 8.36 | 7.50 | 8.64 |
| 2024:Q4 | 7.33 | 7.72 | 7.33 | 8.02 |
| 2025:Q1 | 7.76 | 8.17 | 7.25 | 8.15 |
Median interest rates offered for new variable rate lines of credit increased in first quarter 2025. Variable rates offered at urban and rural banks both increased to 8.2 percent. Fixed rates offered at urban banks decreased to 7.3 percent, while rural rates increased to 7.8 percent. The largest quarter-over-quarter change was a 45-basis point increase for variable rate lines of credit offered at rural banks.
Chart 6: Interest Rate Floor Spreads Decrease Year-Over-Year
Skip to data visualization tableNote: Spread refers to the distance between the weighted average nominal interest rate and the weighted average interest rate floor.
Sources: FR 2028D, items 5.c, 5.h, 6.d, 6.g
| Quarter | Median Term Loan Spread | Median LOC Spread |
|---|---|---|
| 2024:Q1 | 265 | 416.5 |
| 2024:Q2 | 291 | 388.1 |
| 2024:Q3 | 278.5 | 360.3 |
| 2024:Q4 | 255.0 | 312.9 |
| 2025:Q1 | 263.1 | 311 |
Median interest rate floor spreads for lines of credit decreased by 105-basis points when compared to first quarter 2024, while term loans remained relatively stable. As interest rate floor spreads continue to tighten, banks may experience an increase in refinancing activity from borrowers seeking more competitive terms.
Chart 7: All Bank Sizes Report Increases in Credit Line Usage for the Sixth Consecutive Quarter
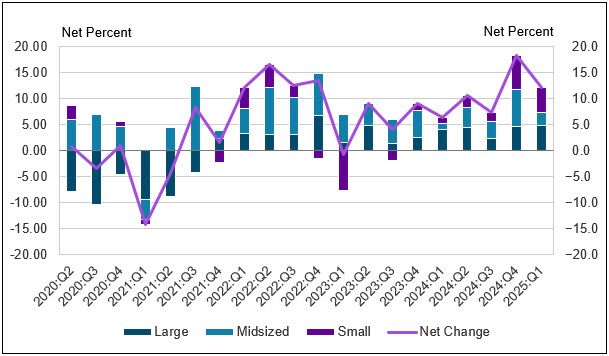
Note: Chart 7 shows diffusion indexes for credit line usage. The diffusion indexes show the difference between the percent of banks reporting decreased credit line usage and those reporting increased credit line usage. Net percent refers to the percent of banks that reported having increased usage (“increased somewhat” or “increased substantially”) minus the percent of banks that reported having decreased usage (“decreased somewhat” or “decreased substantially”).
Source: FR 2028D, items 9 and 10.
In first quarter 2025, 28 percent of respondents reported a change in credit line usage. About 12 percent of respondents, on net, indicated that credit line usage increased, down from 18 percent last quarter.
On net, all bank sizes reported an increase in credit line usage for the sixth straight quarter. Of banks reporting an increase, 94 percent cited changes in local or national economic conditions and 88 percent cited changes in borrower's business revenue or other business specific conditions as somewhat or very important reasons.
The reported increase in credit line usage is consistent with a shift to increased debt financing observed in other key indicators such as elevated consumer credit card debt. _ Total household credit card debt continues to increase each quarter._
Chart 8: Respondents Report Increases in Loan Demand
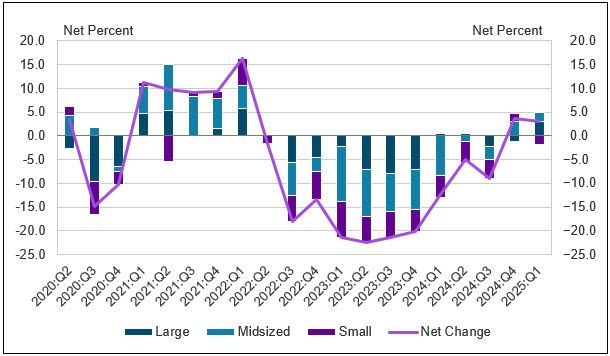
Note: Chart 8 shows diffusion indexes for loan demand. The diffusion indexes show the difference between the percent of banks reporting weakened loan demand and those reporting stronger loan demand. Net percent refers to the percent of banks that reported having stronger loan demand (“moderately stronger” or “substantially stronger”) minus the percent of banks that reported having weakened loan demand (“moderately weaker” or “substantially weaker”).
Source: FR 2028D, item 11.
About 34 percent of respondents reported a change in small business loan demand in first quarter 2025. On net, about 3 percent of respondents indicated stronger loan demand. Small banks were the only bank size to report a net decrease in loan demand.
The reported stronger loan demand is consistent with the increased credit line usage reported in Chart 7, but is in contrast to the External LinkApril 2025 Federal Reserve Senior Loan Officer Opinion Survey (SLOOS) where weaker C&I loan demand from small firms (annual sales of less than $50 million) was reported.
Chart 9: Overall Credit Quality Declines for the Twelfth Consecutive Quarter
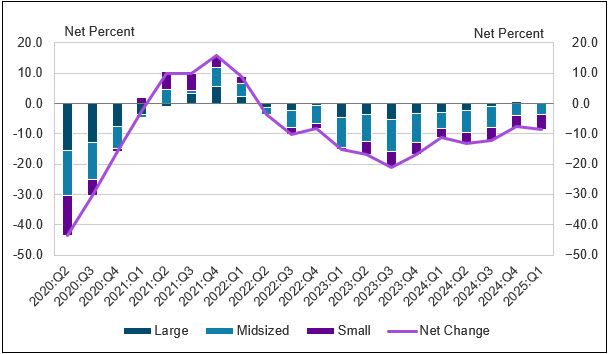
Note: Chart 9 shows diffusion indexes for credit quality of applicants. The diffusion indexes show the difference between the percent of banks reporting a decline in credit quality and those reporting improvement in credit quality. Net percent refers to the percent of banks that reported improving credit quality (“improved somewhat” or “improved substantially”) minus the percent of banks that reported declining credit quality (“declined somewhat” or “declined substantially”).
Source: FR 2028D, items 18 and 19.
About 9 percent of survey respondents, on net, reported a decrease in applicant credit quality. This is the twelfth consecutive period in which respondents, on net, reported a decrease.
Of the respondents reporting a change in credit quality, whether an increase or decrease, 47 percent cited the debt-to-income level of business owners as a very important reason. Other commonly cited reasons include liquidity position of business owners and recent business income growth.
The decrease in applicant credit quality reported by firms is consistent with the negative outlook of loan availability reported by small businesses in the External LinkApril 2025 NFIB Small Business Economic Trends Survey.
Chart 10: Most Respondents Indicate Performance of Existing Small Business Loans Will Not Affect Credit Standards for New Loans
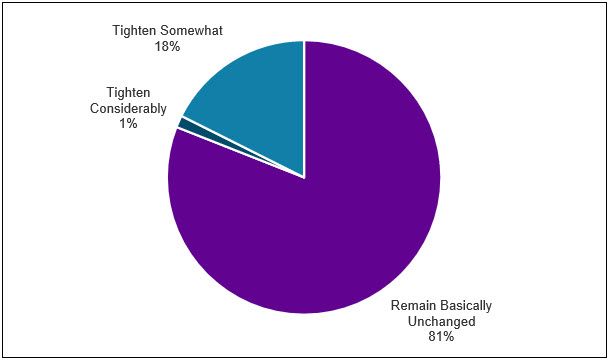
Source: FR 2028D, Special Question.
When asked how they expect the performance of existing C&I loans to small businesses to affect the credit standards for new loans over the next 12 months, about 81 percent of respondents said credit standards would remain basically unchanged, while about 19 percent said credit standards would tighten somewhat or tighten considerably.
Even as credit quality continues to decline, respondents predominantly do not expect to change their underwriting standards. However, when compared to the previous period, there is an increase in the percentage of respondents expecting to tighten standards.
Chart 11: Loan Approval Rates Increase for Midsized and Large Banks
Skip to data visualization tableSource: FR 2028D, items 12.a and 13.
| Quarter | Small | Midsized | Large |
|---|---|---|---|
| 2020:Q2 | 88 | 95 | 75 |
| 2020:Q3 | 87 | 90 | 38 |
| 2020:Q4 | 90 | 80 | 46 |
| 2021:Q1 | 90 | 88 | 51 |
| 2021:Q2 | 94 | 90 | 47 |
| 2021:Q3 | 71 | 85 | 50 |
| 2021:Q4 | 81 | 87 | 51 |
| 2022:Q1 | 83 | 77 | 51 |
| 2022:Q2 | 83 | 80 | 52 |
| 2022:Q3 | 87 | 87 | 48 |
| 2022:Q4 | 86 | 69 | 48 |
| 2023:Q1 | 87 | 68 | 50 |
| 2023:Q2 | 84 | 67 | 48 |
| 2023:Q3 | 88 | 68 | 52 |
| 2023:Q4 | 89 | 66 | 49 |
| 2024:Q1 | 93 | 73 | 49 |
| 2024:Q2 | 85 | 71 | 46 |
| 2024:Q3 | 92 | 70 | 45 |
| 2024:Q4 | 90 | 69 | 44 |
| 2025:Q1 | 87 | 76 | 45 |
Application approval rates increased by 7 percent for midsized banks and 1 percent for large banks but decreased for small banks quarter-over-quarter. About 68 percent of respondents indicated borrower financials as the most common reason for denying a loan. Other commonly cited reasons were borrower credit history and collateral.
Chart 12: Respondents Report Tightening Credit Standards for the Fourteenth Consecutive Quarter
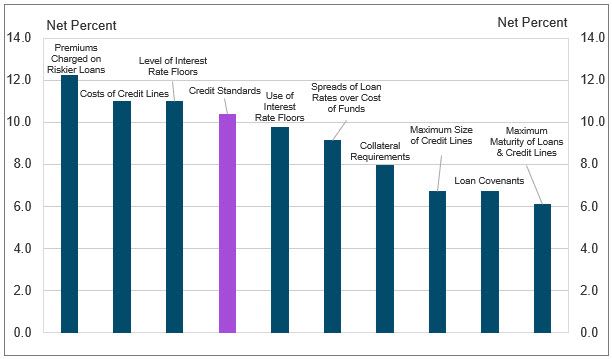
Note: Chart 12 shows diffusion indexes for credit standards (red bar) and various loan terms. The diffusion indexes show the difference between the percent of banks reporting tightening terms and those reporting easing terms. Net percent refers to the percent of banks that reported having tightened (“tightened somewhat” or “tightened considerably”) minus the percent of banks that reported having eased (“eased somewhat” or “eased considerably”).
Source: FR 2028D, items 14, 15, 16 and 17.
About 10 percent of respondents, on net, reported tightening credit standards (purple bar) in first quarter 2025. This is the fourteenth consecutive quarter that respondents have reported tightening credit standards and is consistent with the tightening credit standards reported in the External LinkApril 2025 Federal Reserve Senior Loan Officer Opinion Survey (SLOOS).
On net, respondents indicated that all loan terms tightened. About 83 percent of respondents cited less favorable or more uncertain economic outlook as a somewhat important or very important reason for the tightening. Other commonly cited reasons were worsening of industry-specific problems and reduced tolerance for risk.
Other contributors to the release include Alli Baranski, Lauren Bennett, Nicholas Courtney, Stefan Jacewitz, Connor Jamison, Josie Kennedy, Christina Louie, and Jordan Pandolfo.
Endnotes
-
1 Small business lending refers to commercial and industrial lending to organizations generally defined as having less than $5 million in gross annual revenue, unless otherwise noted.
-
2 Small banks have total assets of $1 billion or less, midsized banks have total assets between $1 billion and $10 billion and large banks have total assets greater than $10 billion.
-
3 Urban and rural classification is determined exclusively by the bank’s head office location and External LinkUS Census Population data.
-
4 Source: FRED, Consumer Loans: Credit Cards and Other Revolving Plans
-
5 Source: FRBNY Consumer Credit Panel/Equifax
The views expressed are those of the authors and do not necessarily reflect the positions of the Federal Reserve Bank of Kansas City or the Federal Reserve System.
Authors

Daniel Harbour
Assistant Vice President