Fourth quarter energy survey results showed that Tenth District energy activity fell sharply, with further contraction expected in the next six months. Firms reported that oil prices needed to be on average $61 per barrel for drilling to be profitable, and $75 per barrel for a substantial increase in drilling to occur. Natural gas prices needed to be $3.80 per million Btu for drilling to be profitable on average, and $4.89 per million Btu for drilling to increase substantially.
Summary of Quarterly Indicators
Tenth District energy activity fell sharply in the fourth quarter of 2025, as indicated by firms contacted between Dec. 15, 2025, and Dec. 31, 2025 (Tables 1 & 2). The quarter-over-quarter drilling and business activity index was -39 in Q4, down from -16 in Q3 and from -17 in Q2 (Chart 1). Revenues and profits fell further from their lowest levels in two years, now at -33 and -42 respectively. However, employment levels only contracted modestly at -3.
Drilling activity also decreased from this time last year, with the year-over-year drilling/business activity index falling from -24 to -50 in Q4. Revenues and profits fell further, and accordingly, capital expenditures fell from -18 to -39. Employment levels stayed steady from last year, but the employee hours index remained in negative territory at -14.
Firms anticipated further declines in drilling activity, revenues, profits, employment, and capital expenditures in the next six months. The expected drilling activity index fell from 0 to -19 and expected revenues decreased from 3 to -22, the lowest readings in over two years.
Chart 1. Drilling/Business Activity Indexes
Skip to data visualization table| Quarter | Vs. a Quarter Ago | Vs. a Year Ago |
|---|---|---|
| Q4 21 | 32 | 74 |
| Q1 22 | 29 | 52 |
| Q2 22 | 57 | 77 |
| Q3 22 | 44 | 78 |
| Q4 22 | 6 | 56 |
| Q1 23 | -13 | 17 |
| Q2 23 | -19 | -16 |
| Q3 23 | -13 | -23 |
| Q4 23 | -33 | -33 |
| Q1 24 | -13 | -26 |
| Q2 24 | -14 | -25 |
| Q3 24 | -13 | -29 |
| Q4 24 | -13 | -16 |
| Q1 25 | 6 | -18 |
| Q2 25 | -17 | -17 |
| Q3 25 | -16 | -24 |
| Q4 25 | -39 | -50 |
Summary of Special Questions
Firms were asked what oil and natural gas prices were needed on average for drilling to be profitable across the fields in which they are active. The average oil price needed was $61 per barrel (Chart 2), while the average natural gas price needed was $3.80 per million Btu (Chart 3). Firms were also asked what prices were needed for a substantial increase in drilling to occur across the fields in which they are active. The average oil price needed was $75 per barrel (Chart 2), and the average natural gas price needed was $4.89 per million Btu (Chart 3).
Firms reported what they expected oil and natural gas prices to be in six months, one year, two years, and five years. The average expected WTI prices were $57, $62, $69, and $73 per barrel, respectively. The average expected Henry Hub natural gas prices were $3.69, $4.05, $4.35, and $4.93 per million Btu, respectively.
Firms were asked their expectations for capital spending and employment levels for 2026 compared to 2025 (Chart 4). Expectations for capital expenditures were mixed, with 9% expecting a significant increase, 29% a slight increase, 34% expecting similar levels to 2025, 17% expecting a slight decrease, and 11% expecting a significant decrease. A majority of firms (60%) expect employment to remain close to 2025 levels, while 3% expect a significant increase, 9% expect a slight increase, 25% expect a slight decrease, and another 3% expect a significant decrease.
Contacts were also asked how they expect rising U.S. power demand to affect natural gas demand, prices, and drilling activity relevant to their firm over the next five years. A majority of firms (62%) expect it will modestly increase demand and support somewhat higher prices and drilling activity, and another 29% expect it will materially increase demand and support substantially higher prices and drilling activity. Only 9% expect little effect on demand, prices, or drilling activity.
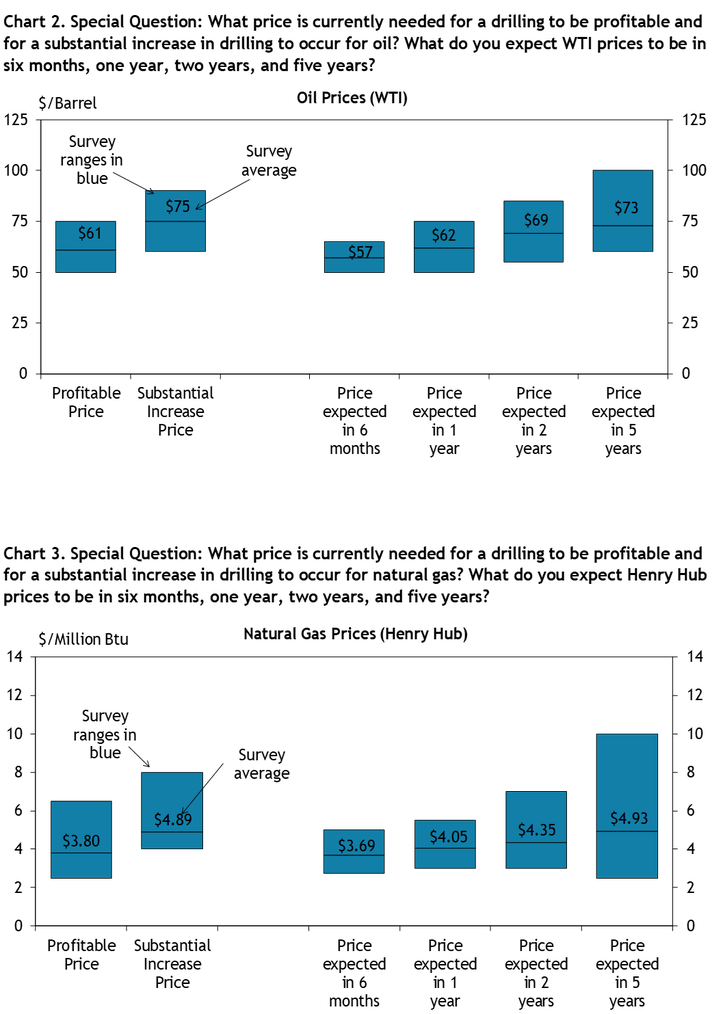
Chart 4. Special Question: What are your expectations for your firm's capital spending and employment levels next year compared to this year?
Skip to data visualization table| Category | Capital Spending | Employment |
|---|---|---|
| Increase significantly | 9 | 3 |
| Increase slightly | 29 | 9 |
| Remain close to 2025 levels | 34 | 60 |
| Decrease slightly | 17 | 26 |
| Decrease significantly | 11 | 3 |
Chart 5. Special Question: Over the next five years, how do you expect rising U.S. power demand (including from data centers and other electricity-intensive uses) to affect natural gas demand, prices, and drilling relevant to your firm?
Skip to data visualization table| Category | Percent |
|---|---|
| Materially increase demand and support substantially higher prices and drilling | 29 |
| Modestly increase demand and somewhat support higher prices and drilling | 62 |
| Little effect on demand, prices, or drilling activity | 9 |
| Reduce natural gas demand and put downward pressure on price and drilling | 0 |
Selected Energy Comments
“Our company is not making money at current oil prices. We do not see that current reserve development is warranted.”
“We need help in prices.”
“Lots of uncertainty but better long-term prospects.”
“High OPEC production pushing down global oil price.”
“I am hopeful if oil prices fall below $55, that Permian producers will cut back and that will lower supply and we can see a rebound late 2026.”
“It looks like demand should build slowly.”
“Low capital investment will eventually lead to tighter supply. Inflation drivers will push price up.”
“The sweet spot for oil prices where companies make acceptable profits, but it's not too high to impact economic activity is $70-$80/barrel.”
“AI energy requirements will create more demand for natural gas.”
“Adequate supply to meet forecasted demand.”
“The shoulder months with lower demand have weak pricing, and I think we keep seeing that until data center and LNG demand is large enough to compete with injections.”
“A lot of new demand with LNG and electric generation, but gas is plentiful and fairly quick to bring online. Infrastructure seems to be catching up.”
Additional Resources
Current Release
Download Historical Data
About the Energy Survey
The views expressed are those of the authors and do not necessarily reflect the positions of the Federal Reserve Bank of Kansas City or the Federal Reserve System.
Authors

Cortney Cowley
Assistant Vice President and Oklahoma City Branch Executive