Summary of Quarterly Indicators
Tenth District energy activity continued to decline in the second quarter of 2024, as indicated by firms contacted between June 14th, 2024, and June 28th, 2024 (Tables 1 & 2). The quarter-over-quarter drilling and business activity index ticked down from -13 to -14 (Chart 1). Revenues and profits declined moderately, while employment levels stayed steady for the first time in over a year.
Chart 1. Drilling/Business Activity Indexes
Skip to data visualization table| Quarter | Vs. a Quarter Ago | Vs. a Year Ago |
|---|---|---|
| Q2 20 | -62 | -70 |
| Q3 20 | 4 | -71 |
| Q4 20 | 40 | -60 |
| Q1 21 | 35 | 12 |
| Q2 21 | 33 | 59 |
| Q3 21 | 43 | 68 |
| Q4 21 | 32 | 74 |
| Q1 22 | 29 | 52 |
| Q2 22 | 57 | 77 |
| Q3 22 | 44 | 78 |
| Q4 22 | 6 | 56 |
| Q1 23 | -13 | 17 |
| Q2 23 | -19 | -16 |
| Q3 23 | -13 | -23 |
| Q4 23 | -33 | -33 |
| Q1 24 | -13 | -26 |
| Q2 24 | -14 | -25 |
Drilling activity also declined at a steady pace from this time last year, with the drilling and business activity index ticking up from -26 to -25. Employment grew further on a year-over-year basis even as revenues and profits decreased. Capital expenditures continued to fall moderately, but access to credit increased further from this time last year.
Despite the declines, firms expect activity to rebound in the next six months along with natural gas prices, as the drilling activity, revenues, profits, and employment expectations indexes all posted readings above 20. In fact, all expectations indexes were positive this quarter except for supplier delivery time at -4.
Summary of Special Questions
Firms were asked what oil and natural gas prices were needed on average for drilling to be profitable across the fields in which they are active. The average oil price needed was $64 per barrel (Chart 2), while the average natural gas price needed was $3.47 per million Btu (Chart 3). Firms were also asked what prices were needed for a substantial increase in drilling to occur across the fields in which they are active. The average oil price needed was $91 per barrel (Chart 2), and the average natural gas price needed was $4.68 per million Btu (Chart 3).
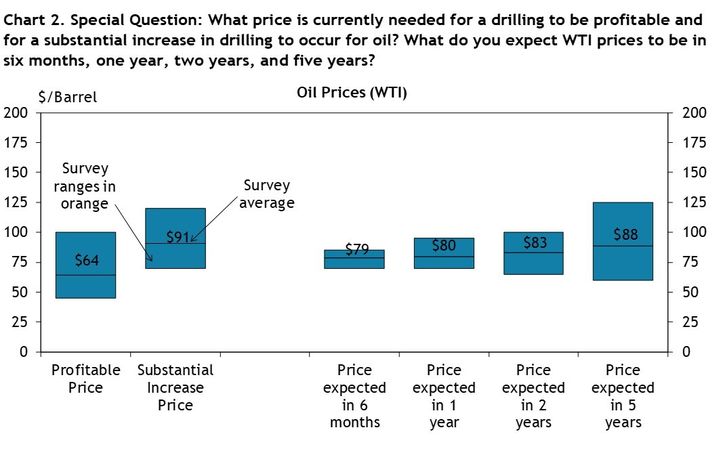
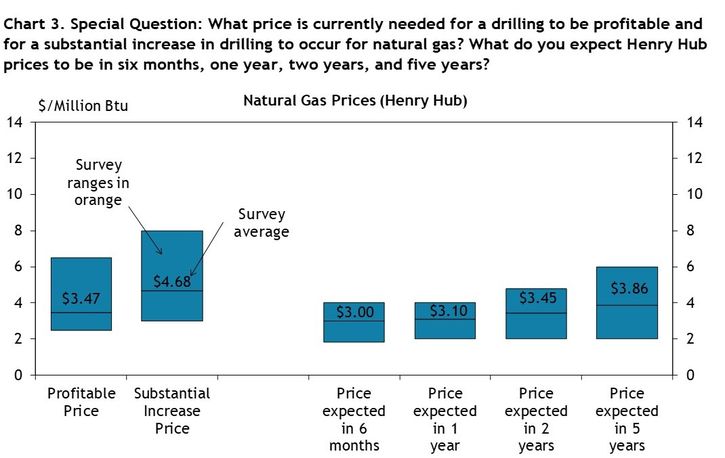
Firms reported what they expected oil and natural gas prices to be in six months, one year, two years, and five years. The average expected WTI prices were $79, $80, $83, and $88 per barrel, respectively. The average expected Henry Hub natural gas prices were $3.00, $3.10, $3.45, and $3.86 per million Btu, respectively.
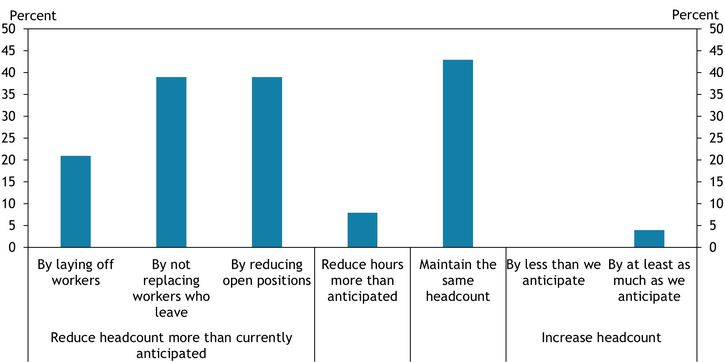
Firms were asked how they would respond if oil prices fell 20% over the next six months (Chart 4). 21% of firms reported they would reduce headcount more than currently anticipated by selectively laying off workers, while 39% each reported they would reduce headcount more than anticipated by not replacing workers who leave or by reducing the number of open positions. Another 8% claimed they would reduce their employees’ hours more than anticipated, 43% said they would maintain headcount, and 4% would increase headcount by at least as much as they currently anticipate.
Chart 4. Special Question: Hypothetically, how would your firm respond if oil prices fell 20% over the next 6 months? Please select all that apply.
Contacts were also asked what the two greatest risks for their business over the next year are (Chart 5). 43% of firms ranked increased regulation as their greatest risk, while another 29% ranked slowing economic activity as their greatest risk. Additionally, 25% ranked OPEC production decisions as the top risk and 4% said supply chain issues. 21% of firms said increased regulation is their second-greatest risk, while 47% ranked slowing economic activity second, 11% ranked financial capital availability second, and 7% each ranked OPEC production decisions or labor constraints as second.
Chart 5. Special Question: Which of the following pose the greatest risk for your business over the next year? Please rank the top two.
Skip to data visualization table| Category | Rank 1 | Rank 2 |
|---|---|---|
| Increased regulation | 43 | 21 |
| Slowing economic activity | 29 | 46 |
| OPEC production decisions | 25 | 7 |
| Supply chain issues | 4 | 0 |
| Labor constraints | 0 | 7 |
| Financial capital availability | 0 | 11 |


Selected Energy Comments
“Projects in these areas are too high priced with any return based on receiving federal credits. More profitable to drill or purchase existing properties.”
“Geothermal drilling is promising; we are doing some now.”
“Producer return of capital to investors will restrain production and global demand will rise.”
“LNG export capacity will increase as new plants are commissioned. This should stabilize the market price swings to a degree.”
“Appalachia and the Permian can fully supply the USA needs for natural gas.”
“We are maintaining cadence and offsetting inflationary pressures with improved efficiency and innovation.”
“Gas prices in the Rockies are so low, we are shutting in production.”
“We are now fully staffed and can get all workover rigs running. This allows us to attack the easier and smaller projects that bear low hanging fruit.”
“The MidCon is less distressed than any time in the past six years. We are seeing more competition move here from the Permian.”
“Natural gas is a small part of our business, but even so we are going to reduce production due to historically low prices. Oil prices seem to have a bottom and reside at a comfortable level.”
Additional Resources
The views expressed are those of the authors and do not necessarily reflect the positions of the Federal Reserve Bank of Kansas City or the Federal Reserve System.
Authors

Chad Wilkerson
Senior Vice President and Oklahoma City Branch Executive