Summary of Quarterly Indicators
Tenth District energy activity declined in the fourth quarter of 2018, as indicated by firms contacted between December 17th and January 4th (Tables 1 & 2). The drilling and business activity index fell from 45 to -13, the first quarterly decline in nearly three years (Chart 1). Indexes for total revenues, profits, and access to credit decreased considerably. Meanwhile, most employment-related indexes declined but remained above zero, indicating expansion, though at a slower pace than in 2018.
Chart 1.
Drilling/Business Activity Index vs. a Quarter Ago
Skip to data visualization table| Date | Drilling/Business Activity |
|---|---|
| 2015Q4 | -56 |
| 2016Q1 | -72 |
| 2016Q2 | 0 |
| 2016Q3 | 26 |
| 2016Q4 | 64 |
| 2017Q1 | 55 |
| 2017Q2 | 43 |
| 2017Q3 | 7 |
| 2017Q4 | 13 |
| 2018Q1 | 37 |
| 2018Q2 | 26 |
| 2018Q3 | 45 |
| 2018Q4 | -13 |
Year-over-year indexes also moved lower, but remained positive. The year-over-year drilling and business activity index decreased from 57 to 17, the lowest level in two years. The capital expenditures index also dropped significantly. Year-over-year total revenues, profits, supplier delivery time, employment, wages and benefits, and access to credit indexes saw modest declines. The year-over-year employment index was unchanged at 27.
Expectation indexes turned negative. The future drilling and business activity index dropped from 57 to -19, the first negative posting since early 2016. The future total revenues, capital expenditures, and total profits indexes all decreased considerably, moving below zero. The future employment, employee hours, and access to credit indexes also declined, but remained positive overall. Conversely, the future supplier delivery time index bounced back into positive territory, and the future wages and benefits index expanded modestly. The oil price expectations index declined moderately, from 48 to 29, and the natural gas price expectations index also fell, turning negative for the first time since 2015.
Summary of Special Questions
This quarter firms were asked what oil and natural gas prices were needed for a substantial increase in drilling to occur (in alternate quarters they are asked what price they need to be profitable). The average oil price needed was $63 per barrel, with a range of $50 to $80 (Chart 2). This average was down from $69 in the second quarter of 2018, but similar to the $62 average reported in the fourth quarter of 2017. The average natural gas price needed was $3.48 per million Btu, with responses ranging from $1.25 to $5.00.
Chart 2. Special Question - What price is currently needed for a substantial increase in drilling to occur for oil and natural gas, and what do you expect the WTI and Henry Hub prices to be in six months, one year, two years, and five years?
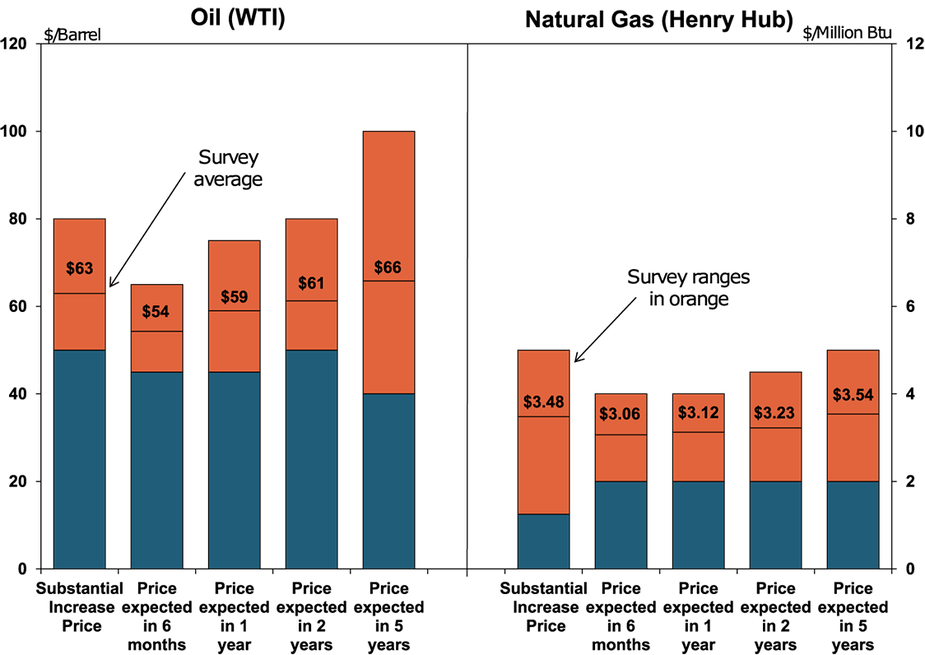
Source: Federal Reserve Bank of Kansas City
Firms were again asked what they expected oil and natural gas prices to be in six months, one year, two years, and five years. Expected oil prices declined since the last quarter, but were higher than recent spot prices. The average expected WTI prices were $54, $59, $61, and $66 per barrel, respectively. However, natural gas price expectations increased. The average expected Henry Hub natural gas prices were $3.06, $3.12, $3.23, and $3.54 per million Btu, respectively.
Firms were also asked about their capital spending plans. Nearly 36 percent of energy contacts indicated they expect capital spending in 2019 to increase either slightly or significantly over the next year, while more than 40 percent of firms expect capital expenditures to decrease from their 2018 levels (Chart 3). A number of firms reported the recent drop in oil prices resulted in them reducing their capital spending plans for 2019 (Chart 4).
Chart 3.
Special Question - What are your expectations for your firm capital spending in 2019 versus 2018?
Skip to data visualization table| Spending | Percent |
|---|---|
| Increase significantly | 14.28571 |
| Increase slightly | 21.42857 |
| Remain close to 2018 levels | 17.85714 |
| Decrease slightly | 17.85714 |
| Decrease significantly | 21.42857 |
| No opinion or do not know | 7.142857 |
Chart 4.
Special Question - Has the recent drop in oil prices caused you to lower expectations for your firm capital spending in 2019?
Skip to data visualization table| Expectation | Percent |
|---|---|
| Yes significantly lower | 25 |
| Yes slightly lower | 32.14286 |
| No | 25 |
| Too soon to make a decision | 10.71429 |
| No opinion or do not know | 7.142857 |
Finally, firms were asked if they were experiencing any labor shortages. While 21 percent of respondents reported they were having difficulties finding workers, this was down from the second quarter of 2018 when 31 percent of firms were reporting labor shortages. Most firms experiencing labor shortages reported trouble finding field level personnel or certified truck drivers.
Table 1 - Summary of Tenth District Energy Conditions, Quarter 4, 2018

Source: Federal Reserve Bank of Kansas City
Table 2 - Historical Energy Survey Indexes

Source: Federal Reserve Bank of Kansas City
Selected Comments
“Commodity prices are driving everything. With lower oil prices, our cash flow is down significantly. We are hunkering down and weathering the storm.”
“We’ve hedged the majority of our 2019 production so that keeps us somewhat insulated from price drops. We also have a number of projects that need to be executed in 2019 or we may lose the right to participate in these projects in future years.”
“Uncertainty is driving our plans for next year, the ebb and flow of pricing is a deal killer for many of the operators we work for.”
“Commodity prices will control spending (over the next six months). Continued low prices will dampen new hires and future spending.”
“The price of oil and gas is the key factor driving our business plans over the next six months. If oil stays above $50 then drilling will continue.
“Too much shale production combined with lower worldwide demand are driving oil price expectations lower. The US is a harvester of oil & gas rather than an explorer, it’s a lateral/horizontal industry going forward thus low pricing will become the norm.”
“OPEC and Russia production cuts have affected our price forecast.”
“I see a substantial amount of gas production coming online if prices rise modestly, which in turn will keep prices relatively flat. Export capacity is increasing but still minor.”
“Access to credit could hinder our FY 2019 drilling budget.”
Additional Resources
The views expressed are those of the authors and do not necessarily reflect the positions of the Federal Reserve Bank of Kansas City or the Federal Reserve System.
Author