As consumers have shifted more of their economic activities online, their use of payment cards has also shifted from a “card-present” (in-person) to a “card-not-present” (remote) environment. As a result, addressing the risk of card-not-present fraud has become increasingly important. Many countries experienced a significant increase in card-not-present fraud immediately after migrating to EMV chip-card technology, which makes card-present transactions more secure. However, more recently, some of these countries have reduced the card-not-present fraud rate by adopting advanced mitigation tools. As the United States was a comparatively late adopter of EMV technology, whether the U.S. card-not-present fraud rate has followed the same trend as other countries has not been assessed. In this Payments System Research Briefing, I examine how the card-not-present fraud rate has changed in the United States for non-prepaid debit card transactions. I also discuss how card-not-present fraud losses have been allocated across issuers, merchants, and cardholders.
The surge of card-not-present transactions
Over the past decade, both the number and value of card-not-present transactions have increased significantly in the United States, especially for non-prepaid debit cards. Each non-prepaid debit card transaction is processed on either a dual-message or single-message network. Dual-message networks (Visa, Mastercard, and Discover) use the same infrastructure as credit card networks and thus process the transaction using two separate messages—one for transaction authorization and one for payment clearing. Single-message networks (such as STAR, NYCE, and PULSE) traditionally authenticate cardholders through a PIN and use a single message for both transaction authorization and payment clearing (Hayashi, Sullivan, and Weiner 2003). As Chart 1 shows, the value of card-not-present transactions processed on dual-message networks (blue line) increased more than fivefold, from $360 billion in 2011 to $1.8 trillion in 2021._ The value of card-not-present transactions processed on single-message networks (purple line) increased more than threefold, from $26 billion in 2011 to $85 billion in 2021._
Chart 1: Value of card-not-present transactions for non-prepaid debit cards has increased, especially for dual-message networks
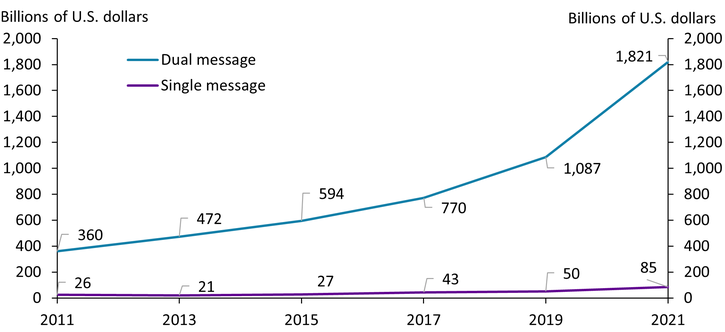
Source: Board of Governors of the Federal Reserve System.
The value of card-not present transactions has been smaller for single-message networks than dual-message networks for two main reasons. First, many single-message networks did not have the capability to process card-not-present transactions until the mid or late 2010s. Second, many debit card issuers limited the ability of single-message networks to process card-not-present transactions on their cards until they were specifically prohibited from doing so by an amendment to Regulation II in 2022 (Federal Reserve Board 2022).
Card-not-present fraud rate in the United States
The card-not-present fraud rate significantly increased in many countries during the 2000s immediately after the migration to EMV chip-card technology (Sullivan 2013; Markiewicz and Sullivan 2017). EMV technology was intended to mitigate card-present fraud from counterfeit cards, and in many countries, committing card-present fraud indeed became much more difficult after EMV migration. As a result, fraudsters shifted their targets to card-not-present transactions. Card-not-present transactions are inherently more prone to fraud than card-present transactions because the card and cardholder are not physically present for verification. Several countries (such as Australia and France) have reduced the card-not-present fraud rate more recently by adopting mitigation measures for these transactions, including strong customer authentication, tokenizing card account numbers, fraud risk modeling with machine learning, and real-time transaction monitoring (Hayashi 2020).
In the United States, EMV migration started in 2015. The Federal Reserve Board (2018) provides estimates of U.S. card-not-present (or remote) fraud rates for credit, non-prepaid debit, and prepaid debit card transactions in 2012, 2015, and 2016, but these are the most recent years for which these fraud rates have been estimated.
To examine how the card-not-present fraud rate has changed after EMV migration in the United States, I calculate the card-not-present fraud rate using data included in the Federal Reserve Board’s biennial reports on debit cards._ Similar to Hayashi (2025), I calculate card-not-present fraud rates for non-prepaid debit card transactions processed by dual-message networks and single-message networks separately. I define the card-not-present fraud rate as the value of card-not-present fraud divided by the value of card-not-present transactions (including both fraudulent and non-fraudulent transactions)._
In contrast to other countries, the card-not-present fraud rate of non-prepaid debit cards in the United States did not significantly increase immediately after EMV migration. Chart 2 shows that for dual-message networks (blue line), the card-not-present fraud rate increased by more than 2 basis points immediately before the EMV migration (from 14.3 basis points in 2013 to 16.9 basis points in 2015) but the rate increase was smaller immediately after the EMV migration: by less than 2 basis points from 2015 to 2017 and by slightly more than 2 basis points from 2017 to 2019. Similarly, for single-message networks (purple line), the card-not-present fraud rate increased by more than 6 basis points immediately before the EMV migration (from 2.1 basis points in 2013 to 8.5 basis points in 2015), but by less than 3 basis points from 2015 to 2017; from 2017 to 2019 the rate actually declined.
Chart 2: Card-not-present fraud rates of non-prepaid debit cards did not significantly increase after EMV migration in 2015
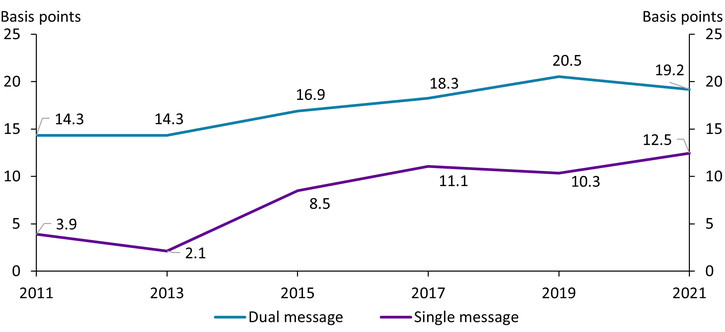
Sources: Board of Governors of the Federal Reserve System and author’s calculations.
The insignificant increase in the card-not-present fraud rate immediately after EMV migration in the United States may partly reflect fraudsters’ limited incentives to shift their target to card-not-present transactions. As Hayashi (2025) shows, even after EMV migration, the card-present fraud rate has increased for dual-message networks. Fraudsters can still commit counterfeit fraud through card-skimming and by making card-present transactions with a magnetic stripe on the cards, and they can commit lost-or-stolen fraud relatively easily due to the lack of a PIN requirement.
The insignificant increase in the U.S. card-not-present fraud rate may also reflect that the U.S. payment industry had adopted relatively advanced mitigation tools for card-not-present fraud by the time EMV migration began. In many countries, EMV migration began in the early 2000s, and at that time, the volume of card-not-present transactions may not have been sufficiently large to encourage the development of tools to mitigate card-not-present fraud. In contrast, in the United States, the volume of card-not-present transactions was sufficiently large by the time EMV migration began in the mid-2010s that U.S. card networks, issuers, and merchants had already adopted several tools to mitigate card-not-present fraud. Indeed, the U.S. card-not-present fraud rate was lower than that of Australia and France until very recently. Although the card-not-present fraud rate of credit and debit cards has been trending down since the mid-2010s in Australia and France, the rate was higher than 20 basis points until 2019 and 2020, respectively (Hayashi 2020)._
Although the United States did not see a surge of card-not-present fraud rate immediately after EMV migration, the rate was gradually trending up during the 2011–21 period. Although more recent data on the card-not-present fraud rate are not yet available, one industry study suggests an upward trend. The Pulse debit issuer study, an annual study on debit card performance from issuers’ perspectives, publishes an average card-not-present fraud rate of debit cards in its 2020 and 2024 reports: the average rate increased from 26.1 basis points in 2019 to 41.6 basis points in 2023. It is important to note that unlike the transaction-weighted, card-not-present fraud rate I calculate for Chart 2, the Pulse debit issuer study calculates the simple average of each debit card issuer’s card-not-present fraud rate from those issuers who participated in the study. The study does not consider the differences across debit card issuers in their transaction numbers and values, and thus, the average fraud rate reported in the study is skewed toward issuers with smaller transaction numbers and values.
Card-not-present fraud loss allocation across issuers, merchants, and cardholders
To examine how the fraud loss rates of three parties—issuers, merchants, and cardholders—have changed for card-not-present fraud, I calculate each party’s fraud loss rates for non-prepaid debit card transactions for both dual- and single-message networks based on data reported in the Federal Reserve Board’s biennial reports on debit cards. The sum of these three parties’ fraud loss rates should be the same as (or very close to) the card-not-present fraud rates shown in Chart 2.
The left side of Chart 3 shows historical fraud loss rates from card-not-present fraud for each of the three parties on dual-message networks. Despite the gradual increase in the card-not-present fraud rate for dual-message networks, the card-not-present fraud loss rate for issuers has been stable at around 4 basis points from 2011 to 2021. The same fraud loss rate for merchants, on the other hand, increased from 10.0 basis points in 2011 to 15.0 basis points in 2019, though the rate declined slightly to 13.4 basis points in 2021. These different trends of fraud loss rates for issuers and merchants can be explained by the dual-message networks’ card-not-present fraud liability allocation. Merchants are generally liable for card-not-present fraud in the United States, but the fraud liability shifts from the merchant to the issuer when the fraudulent transaction is authenticated through 3D Secure. 3D Secure is a security protocol that authenticates online card transactions by adding an extra layer of verification to confirm a cardholder’s identity through methods such as a one-time password, PIN, or biometric. While 3D Secure has been widely adopted in Australia, the United Kingdom, and countries in the European Union, it has been more narrowly adopted in the United States (Hayashi 2020). In contrast to fraud loss rates for issuers and merchants, the fraud loss rate for cardholders has been low, though it increased gradually from 0.4 basis points in 2011 to 1.8 basis points in 2019.
Chart 3: Card-not-present fraud loss rates for non-prepaid debit cards did not increase for issuers on dual-message networks from 2011 to 2021
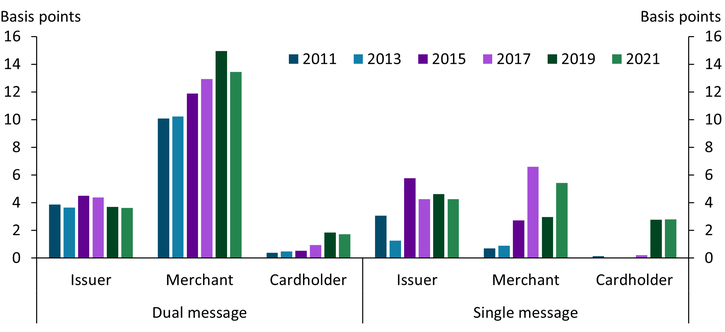
Sources: Board of Governors of the Federal Reserve System and author’s calculations.
The right side of Chart 3 shows that card-not-present fraud loss rates on single-message networks increased from 2013 to 2015 for both issuers and merchants. However, which of the two parties has a higher fraud loss rate since 2015 does not show a clear pattern: Issuers had a higher fraud loss rate in 2015 and 2019, while merchants had a higher fraud loss rate in 2017 and 2021. In the mid-2010s, card-not-present transactions on single-message networks may have expanded to e-commerce. Single-message networks have adopted virtual PIN pad technology, a secure, on-screen keypad that allows debit card users to enter their PIN during an online transaction. Some online transactions, however, have been “PIN-less” and used other verification methods, such as the cardholder’s billing address and the card’s three-digit card verification number. If a card-not-present fraud transaction is authenticated with a PIN, the issuer is more likely to bear the fraud liability; otherwise, the merchant is more likely to bear the liability.
Cardholders have had the lowest fraud loss rate among the three parties, but their fraud loss rate jumped up from 0.2 basis points in 2017 to 2.8 basis points in 2019. The increase in cardholders’ card-not-present fraud loss rate is on both types of networks. Moreover, the rise of cardholders’ fraud loss rate is not just for card-not-present transactions but also for card-present transactions. As Hayashi (2025) discusses, no changes were made in consumer protections against fraud losses through regulation or networks’ rules during the 2011–21 period. Potentially, issuers may have tightened requirements for cardholders to receive the full reimbursement of their fraud losses, or cardholders may have been more negligent in protecting against or reporting fraud (for example, by delaying notification to issuers about unauthorized use of their cards). However, the true causes of the increase in cardholders’ card-not-present fraud loss rate are still unknown.
Conclusion
Unlike many other countries, the United States did not see a surge in the card-not-present fraud rate for non-prepaid debit cards immediately after EMV migration began. Instead, the card-not-present fraud rate gradually increased during the 2011–21 period, and data from one industry study suggest that the card-not-present fraud rate of debit cards has been trending up from 2019 to 2023. For dual-message networks, issuers’ card-not-present fraud loss rate has been stable, while merchants’ fraud loss rate has increased. In contrast, for single-message networks, both issuers’ and merchants’ card-not-present fraud loss rates increased from 2013 to 2015, but one party’s fraud loss rate has not been consistently higher than the others’. While cardholders’ card-not-present fraud loss rate has been the lowest among the three parties, the rate has been increasing for both types of networks. Understanding why cardholders’ card-not-present fraud loss rates have increased and assessing whether card-not-present fraud rates keep trending up will require further research.
Endnotes
-
1 The share of card-not-present transactions in non-prepaid debit card transactions by value for dual-message networks also increased significantly—from 33 percent in 2011 to 61 percent in 2021.
-
2 The share of card-not-present transactions in non-prepaid debit card transactions by value for single-message networks increased only slightly—from 4 percent in 2011 to 7 percent in 2021.
-
3 In these reports, fraud information was provided by debit card issuers subject to Regulation II’s interchange fee cap (covered issuers), and more than two-thirds of non-prepaid debit card transactions in value have been made with the covered issuers’ cards. The most recent report provides data for 2021 (Federal Reserve Board 2023).
-
4 In the Federal Reserve Board’s biennial reports, data on how covered issuers’ transactions in value are distributed between card-present and card-not-present transactions are not available. I assume that their distribution for a given type of networks is identical to the industry-wide distribution (including both non-prepaid and prepaid debit card transactions made with both covered and exempt issuers’ cards) for that type of network, which is available in the reports.
-
5 Author’s calculations based on fraud data reported in Banque de France (2021) for the card-not-present fraud rate in France in 2020.
References
Banque de France. 2021. “External LinkObservatoire De La Sécurité Des Moyens De Paiement Rapport Annuel 2020.” October 18.
Federal Reserve Board (Board of Governors of the Federal Reserve System). 2023. “External Link2021 Interchange Fee Revenue, Covered Issuer Costs, and Covered Issuer and Merchant Fraud Losses Related to Debit Card Transactions.” October.
———. 2022. “External LinkDebit Card Interchange Fees and Routing.” Federal Register, vol. 87, no. 195, October 11.
———. 2018. “External LinkChanges in U.S. Payments Fraud from 2012 to 2016: Evidence from the Federal Reserve Payments Study.” October.
Hayashi, Fumiko. 2025. “External LinkDid Card-Present Fraud Rates Decline in the United States After the Migration to Chip Cards?” Federal Reserve Bank of Kansas City, Payments System Research Briefing, February 12.
———. 2020. “External LinkRemote Card Payment Fraud: Trends and Measures Taken in Australia, France, and the United Kingdom.” Federal Reserve Bank of Kansas City, Payments System Research Briefing, November 25.
Hayashi, Fumiko, Richard J. Sullivan, and Stuart E. Weiner. 2003. External LinkA Guide to the ATM and Debit Card Industry. Federal Reserve Bank of Kansas City.
Markiewicz, Zach, and Richard J. Sullivan. 2017. “External LinkManaging Fraud in Remote Payments.” Federal Reserve Bank of Kansas City, Payments System Research Briefing, May.
Pulse. 2024. “External Link2024 Debit Issuer Study.” August 8.
———. 2020. “External Link2020 Debit Issuer Study.” August 10.
Sullivan, Richard J. 2013. “External LinkThe U.S. Adoption of Computer-Chip Payment Cards: Implications for Payment Fraud.” Federal Reserve Bank of Kansas City Economic Review, vol. 98, no. 1, pp. 59–87.
Fumiko Hayashi is a vice president at the Federal Reserve Bank of Kansas City. The views expressed are those of the author and do not necessarily reflect the positions of the Federal Reserve Bank of Kansas City or the Federal Reserve System.
Author