Why do bank assets grow over time? While credit demand should increase as the real economy grows, other economic forces can also affect bank growth. For example, inflation increases nominal bank asset sizes when average loan volumes rise with price levels, while bank mergers and acquisitions mechanically increase the size of the acquiring bank. Monetary and fiscal policy can also affect bank balance sheets through changes in aggregate demand and the creation or retirement of loans, deposits, and reserves. In addition, regulation and supervision can influence banks’ decision-making in ways that affect asset growth.
W. Blake Marsh and Joshua Jacobs examine the degree to which organic growth, inflation, mergers and acquisitions, and monetary and fiscal policy influenced asset growth over the post-global financial crisis period as well as how these factors were influenced by regulatory thresholds implemented by the Dodd-Frank Act. They find that asset growth at individual banks was driven primarily by merger activity prior to the COVID-19 pandemic, but inflation has played a greater role in cumulative bank asset growth since. They also find that while some banks a key regulatory threshold exhibited slower growth, some reported faster, long-term nominal growth, on average, predominately by merging with existing banks.
Article Citation
Marsh, W. Blake, and Joshua Jacobs. 2026. “What Explains Bank Asset Growth Since the Global Financial Crisis?” Federal Reserve Bank of Kansas City, Economic Review, vol. 111, no. 3. Available at External Linkhttps://doi.org/10.18651/ER/v111n3MarshJacobs
Introduction
Banks play a pivotal role in economic growth by providing capital to firms and households. Bank financing enables firms to expand their productive capacity and continue operations during volatile earnings periods. Similarly, access to bank lending enables households to smooth consumption using revolving credit or build wealth by financing investment opportunities, such as home purchases. By deciding whether and when to extend these financing opportunities, banks can increase or decrease volatility in the business cycle.
Given banks’ prominent role in the smooth functioning of the economy, it is important to understand how banks adjust credit supply and respond to changes in demand for credit. That is, why do bank assets grow larger at the institutional level over time? The answer to this question may seem obvious: Credit demand should increase commensurately with expansion of the real economy as the population grows and productive capacity rises. However, other economic forces can also affect bank asset growth. Inflation, for instance, can increase nominal bank asset sizes because average loan volumes rise with price levels. Consequently, even modest though persistent inflationary pressures can increase the size of bank balance sheets over long time horizons through a compounding effect. Additionally, mergers and acquisitions among banks mechanically increase the size of the acquiring bank, although aggregate U.S. bank assets are unchanged. Monetary and fiscal policy choices can also affect bank balance sheets through changes in aggregate demand as well as the creation or retirement of loans, deposits, and reserves.
In addition to these first-order drivers of asset growth, the intensity of regulation and supervision can influence banks’ decision-making in ways that affect asset growth. The Dodd-Frank Act, for example, introduced new supervisory and regulatory thresholds that mandated additional oversight for larger banks. The threat of more stringent requirements, and the associated increase in regulatory compliance costs, may have slowed asset growth by discouraging merger activity or encouraging banks to take other operational steps that limit growth.
In this article, we examine the degree to which four key factors—organic growth, inflation, mergers and acquisitions, and monetary and fiscal policy—influenced asset growth over the post-global financial crisis (GFC) period as well as the degree to which these factors were influenced by regulatory thresholds from the Dodd-Frank Act. First, we find that asset growth at individual banks in the post-GFC period was driven primarily by merger activity. Merger-led growth is particularly striking among midsized, regional banks prior to the onset of the COVID-19 pandemic. Since the pandemic, however, we find that inflation has played a more significant role in cumulative bank asset growth. Second, we find that banks near a key regulatory threshold implemented by the Dodd-Frank Act exhibited faster, long-term nominal growth, on average, predominately by merging with existing banks. Nominal asset growth was slower when banks near this threshold relied exclusively on organic growth opportunities. Our findings suggest that fixed nominal asset thresholds likely incentivize banks to merge into larger, more complex entities as they approach critical thresholds to increase operational efficiencies and lower the average fixed cost of compliance, consistent with prior research.
Section I explores the sources of bank asset growth. Section II examines which of these sources explains growth in the post-GFC period. Section III explores the effect of regulatory thresholds implemented after the GFC on bank balance sheet growth.
I. Sources of Bank Growth
Bank assets can grow for a variety of reasons. For example, loan demand increases when firms increase production by financing new fixed capital. Similarly, loan supply may increase if a bank’s management seeks to boost profitability by expanding credit availability and increasing risk-taking. More generally, we identify four economic forces that can explain aggregate asset growth at individual banks: organic growth, inflation, mergers and acquisitions, and monetary and fiscal policy decisions.
Organic growth
Organic growth is an increase in real asset levels that occurs through a bank’s normal course of operations. Assets may grow organically when banks expand lending into new markets, enhance their product offerings, or lend more aggressively to riskier borrowers. Assets may also grow organically due to broader economic growth. If businesses in a bank’s lending market grow and the population expands, bank loan demand and the customer base will also expand, providing additional opportunities for the bank to lend or provide services. Technological innovation may also drive organic asset growth by allowing banks to better monitor and originate high-quality loans (Pierri and Timmer 2022).
The real U.S. economy has expanded sharply since the end of the GFC, likely requiring bank balance sheets to expand organically to accommodate that growth. Chart 1 shows that the level of real GDP has cumulatively increased over 40 percent since 2010:Q2. This expansion of the real economy has likely fostered similar growth in bank assets. Generally, when the economy expands, loan demand increases: Consumers have more confidence that they will be able to make loan payments in a growing economy, and businesses meet this rising demand by financing capital investments to boost production.
Chart 1: Cumulative Real GDP Growth, 2010–24
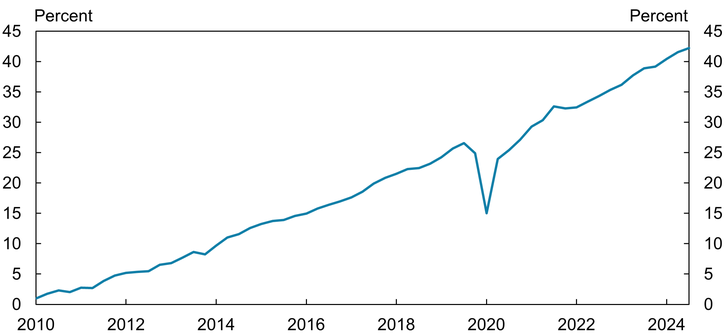
Note: Chart shows cumulative real growth of U.S. gross domestic product since January 2010.
Sources: FRED (Federal Reserve Bank of St. Louis) and authors’ calculations.
Inflation-led growth
In addition to organic growth, inflation—that is, general increases in the price level—can boost nominal bank assets by increasing the size of transactions, even if the number of transactions remains constant. For example, as the prices of goods and services rise, borrowers need larger loans to finance their purchases. As a result, nominal bank assets will rise with inflation even if real loan growth is flat. Importantly, inflation can increase loan sizes over long periods of time even at persistently low rates due to compounding effects.
Bank assets have likely increased in the post-GFC period due to both the compounding effects of inflation as well as periods when price level increases notably accelerated. Since the GFC, the aggregate U.S. price level has cumulatively increased about 40 percent._ However, the rate of inflation has varied substantially.
Chart 2 shows monthly headline and core inflation trends since 2010 as measured by the price index for personal consumption expenditures (PCE). Immediately following the GFC, U.S. inflation levels were subdued. Headline inflation, which is inflation among all goods and services, was volatile but typically remained at levels below 2 percent for most of the decade after the GFC. Core inflation, which excludes food and energy prices, was steadier but also remained below the Federal Reserve’s 2 percent inflation target.
Chart 2: Headline and Core Inflation, 2010–24
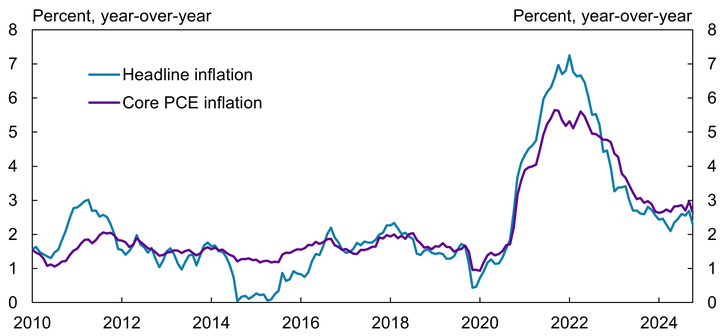
Source: FRED (Federal Reserve Bank of St. Louis).
More recently, inflation surged before cooling to more typical, but still elevated, levels. Imbalances in the economy following the onset of the COVID-19 pandemic caused core inflation to rise to a near 7 percent peak in 2022 (Ball, Leigh, and Mishra 2022). Both headline and core inflation have recently hovered around 3 percent, remaining above the Federal Reserve’s 2 percent target.
Merger and acquisition growth
A third way individual banks’ assets can grow is through mergers and acquisitions (M&A) of other banks. Banks merge for a variety of reasons. For example, small banks may face competitive disadvantages in their local markets against larger banks that enjoy greater economies of scale and scope. To enhance their competitiveness, small banks may choose to increase in size or expand their markets by combining with other small banks. Poorly managed or failing banks may also merge to boost efficiencies or provide shareholders a profitable exit strategy._ Finally, banks without clear management successors may merge when existing management retires. Overall, M&A activity enables banks to quickly expand their balance sheets to increase economic scale and scope without additional organic growth._
Over the past three decades, the banking industry has steadily consolidated through M&A activity, although the pace of mergers has declined steadily. Chart 3 depicts the trend in total bank mergers and failures since 2000._ Prior to the GFC, bank M&A activity occurred at a rapid pace, with mergers reaching a peak of about 440 in 2000 (blue line). Although merger activity slowed considerably during the GFC, the number of mergers stabilized around 200 per year from 2012 to 2020 as banks regained their footing and financial system risks stabilized._ The COVID-19 pandemic sharply slowed merger activity again in 2020 when financial system risk resurfaced.
Chart 3: Bank Mergers and Failures by Year
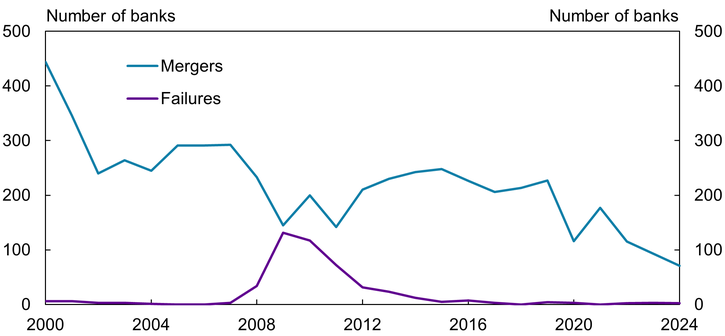
Source: FFIEC National Information Center.
Despite the easing of several pandemic-era risks, merger activity has continued to slow more recently. Increasing interest rates have weighed on bank asset valuations, reducing returns for potential sellers; accordingly, by 2024, mergers reached a trough of 70 per year (Marsh and Laliberte 2023). Even with the steady decline in the acquisition rate, however, consolidation has remained a key driver of bank growth in recent decades, leading to a more concentrated industry that has particularly benefited the four largest banks (Adams and Driscoll 2018).
Monetary and fiscal policy-led growth
Finally, monetary and fiscal policy choices can also affect bank asset levels. An expansion of the Federal Reserve’s balance sheet, for example, creates reserves when banks exchange securities for cash. However, if banks acquire the securities they sell to the Federal Reserve from nonbanks, deposits will expand commensurately (Acharya and Rajan 2024). That is, when banks transact with nonbanks to meet Federal Reserve demand for securities, bank balance sheets expand rather than simply changing the asset composition between reserves and securities.
Fiscal policy programs can also directly expand bank balance sheets. During the COVID-19 pandemic, for instance, stimulus checks to consumers both expanded bank deposits directly and increased loan demand as aggregate output grew. Overall, government spending increased to more than 30 percent of GDP during the pandemic (Committee for a Responsible Federal Budget 2024). Although spending quickly returned to more normal levels, even a temporary spike can create longer-lasting, persistent effects on bank asset growth.
II. Bank Asset Growth Since the Global Financial Crisis
All four drivers of asset growth—organic growth, inflation-led growth, mergers and acquisitions, and monetary and fiscal policy-led growth—may have influenced bank balance sheets after the GFC. However, these drivers are unlikely to have contributed equally, and their contributions may have changed over time. To better understand how these various channels affected bank assets in the post-GFC period, we compare bank asset growth rates that account for nominal growth, inflation, and mergers and acquisitions._ Our sample consists of banks that filed regulatory reports in every quarter from 2010:Q2 to 2024:Q4, many of which acquired banks during this 14-year period._ We then group the surviving banks by their total assets in 2010:Q2 to understand how each mechanism affected banks across the size distribution using standard asset classifications from the academic literature. Table 1 reports compound annual growth rates (CAGRs) for nominal and real asset levels both unadjusted and adjusted for bank mergers._
Nominal, or reported, bank asset growth has varied considerably across institution size since the GFC (Table 1, column 2). Total assets of the median global systemically important bank (GSIBs) increased at a rate of 4.7 percent per year during our sample period. However, the median mid-sized bank grew even more quickly. For instance, the median bank with more than $100 billion in total assets, which might be considered large, but not systemically important, exhibited nominal annual growth of about 5 percent. More extraordinarily, the median bank between $10 billion and $100 billion grew by 6 to 8 percent per year from 2010 to 2024. Smaller community banks, defined as those with less than $10 billion in total assets, grew at about the same rate as systemically important banks, with the median community bank reporting about 4.9 percent average annual growth. Cumulatively, these growth rates imply that the median small or systemically important bank doubled in size since 2010, while mid-sized banks roughly tripled their asset holdings during the same period._
Table 1: Adjusted Growth Rates by Bank Classification, 2010:Q2–2024:Q4
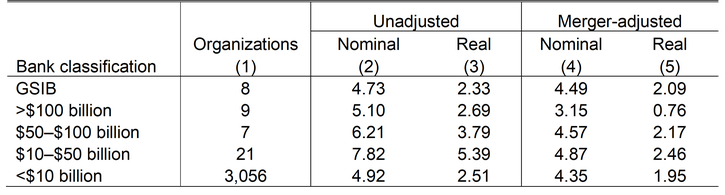
Notes: Chart shows median, annualized, quarterly compound average growth rates (CAGRs) from 2010:Q2 to 2024:Q4 by size group. Asset size thresholds are determined using total banking (Call Report) assets at 2010:Q4 aggregated to the top holder level. Number of banking organizations by top holder are shown in column (1). Real growth rates are based on assets in 2010:Q2 dollars. Global systemically important banks (GSIBs) are consolidated banks under holding companies determined to be systemically important by federal regulators.
Sources: FFIEC, FRED (Federal Reserve Bank of St. Louis), and authors’ calculations.
The compounding effects of inflation have accounted for a non-trivial amount of total asset growth observed in the post-GFC period._In real terms, unadjusted for mergers, annual asset growth is about half its nominal value (Table 1, column 3), suggesting that nearly half of annual growth is related to aggregate price level inflation. However, high inflation is a more recent phenomenon that likely had little effect for much of the post-GFC period. Chart 4 shows nominal and real quarterly bank asset growth since 2010:Q2._ Inflation accounted for little nominal asset growth on a year-over-year basis from 2010:Q2 to the onset of the COVID-19 pandemic in early 2020. However, beginning with the high inflation period in 2022, real bank assets declined while nominal asset growth increased substantially, suggesting inflation was an important driver of bank asset growth.
Chart 4: Bank Asset Growth, 2010–24
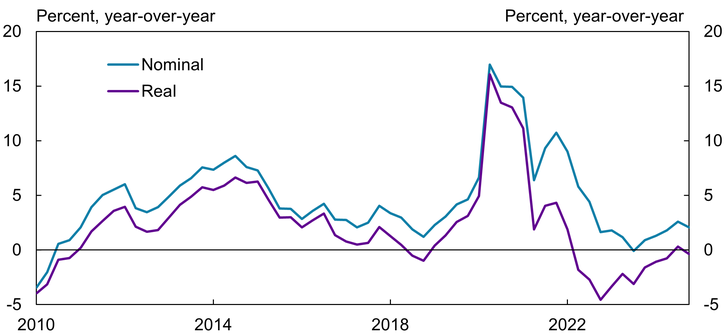
Notes: Chart shows nominal and real quarterly, year-over-year bank asset growth. Real total assets are in 2010:Q2 dollars.
Sources: FFIEC Call Reports and U.S. Bureau of Economic Analysis (FRED).
Mergers also had disproportionate effects on banks in the post-GFC period though these effects varied by asset size. (Table 1, column 4). Mergers had little effect on large, systemically important banks and banks with assets below $10 billion in the post-GFC period. On a nominal basis, merger-adjusted GSIB growth was about 4.5 percent annually compared with 4.7 percent on an unadjusted basis. Similarly, median annual merger-adjusted community bank asset growth was 4.4 percent compared with an unadjusted rate of 4.9 percent. These limited effects are likely due to greater regulatory scrutiny on large bank acquisitions and the fact that small banks are often acquisition targets rather than acquirers. However, mergers were a more significant growth driver at mid-sized banks, where nominal asset growth rates were 1.5 to 3.0 percentage points higher than merger-adjusted growth rates.
Despite these mixed results by bank size, bank mergers have been a significant source of aggregate growth in the post-GFC period. To illustrate, Chart 5 divides our balanced sample of banks with less than $10 billion in total assets in 2010:Q2 into those that experienced at least one merger in the post-GFC period (“acquirers”) and those that did not experience any mergers (“non-acquirers”). Nominal assets at non-acquirer banks increased about 150 percent cumulatively over the 2010:Q2 to 2024:Q4 period, compared with an aggregate increase of nearly 300 percent for acquirer banks. While this simple analysis does not control for other acquirer advantages, such as better technology, greater localized market power, or more strategic management, it does suggest that mergers were a significant source of growth in the post-GFC period for many banks.
Chart 5: Cumulative Asset Growth by Merger Survivor Status, 2010:Q2–2024:Q4
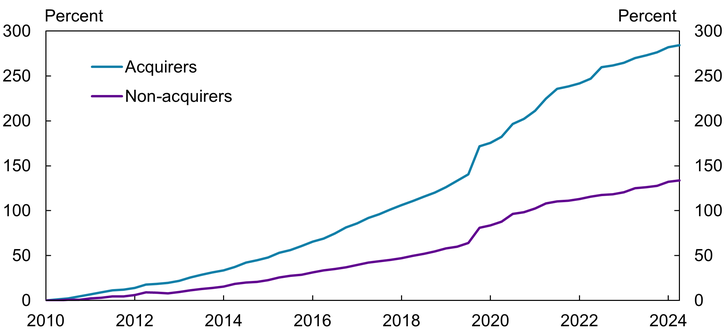
Note: Sample includes only banks with less than $10 billion in consolidated assets in 2010:Q2.
Sources: FFIEC Call Reports, FFIEC National Information Center, and authors’ calculations.
Next, we remove the effects of inflation and mergers to assess real organic growth—that is, asset growth after accounting for inflation and merger activity (Table 1, column 5). Again, the results differ by bank size. Real, merger-adjusted growth at the median large GSIB bank averaged just 2.1 percent annually from 2010:Q2 to 2024:Q4. Banks in the $50 to $100 billion asset class grew at a similar rate. However, large, non-systemically important banks—those with more than $100 billion in real merger-adjusted assets—grew by less than 1 percent annually, suggesting that inflationary effects and merger activity, not organic growth, drove much of their reported nominal growth. Average organic growth at smaller, mid-sized banks—those with assets between $10 and $50 billion—was slightly faster at 2.46 percent per year, while real community bank assets increased at about 2 percent per year.
Finally, pandemic-era policy programs likely had persistent expansionary effects on bank balance sheets, spurring nominal increases in bank assets as well as real organic growth. An economic crisis at the onset of the pandemic in March 2020 compelled monetary and fiscal policymakers to respond strongly to declining aggregate demand, rising unemployment, and collapsing credit availability (Hong and Lucas 2023). In a financial sense, these programs injected household and business deposits into banks, which necessitated greater asset investments. Stimulus checks and expanded unemployment benefits to households also boosted the aggregate savings rate, resulting in deposit growth, while other business support programs, notably the Paycheck Protection Program, effectively provided grants to small businesses which were held as bank deposits (Castro, Cavallo, and Zarutskie 2022; Marsh and Sharma 2024).
Monetary policy actions also contributed to bank asset growth during this time, as the Federal Reserve supplied reserves to the financial system. Chart 6 shows that reserves accumulated across banks of all sizes at the start of the pandemic. However, as the Federal Reserve normalized its operations, reserves drained from smaller banks. A similar effect took place following the GFC, when reserves created through the Federal Reserve’s series of large-scale asset purchases from 2008 to 2012 mostly accumulated to the largest banks. Thus, monetary policy actions typically led to more persistent asset growth at large banks.
Chart 6: Reserves as a Share of Total Bank Assets
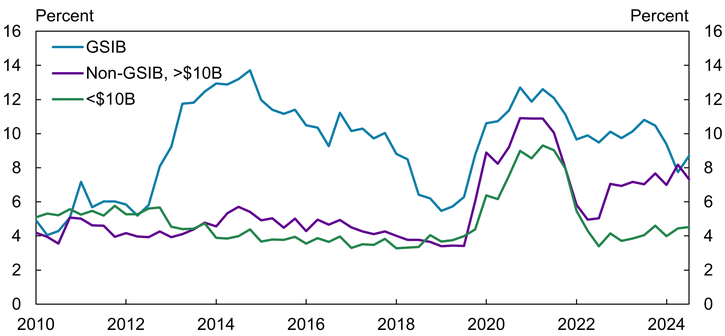
Note: Chart shows money due from the Federal Reserve.
Source: FFIEC Call Reports.
III. Growth Implications of Regulatory Thresholds
Although organic growth, inflation-led growth, mergers and acquisitions, and policy changes can all drive asset growth directly, supervisory and regulatory constraints can affect asset growth indirectly by influencing bank management choices within those channels. One way that supervision and regulation may constrain growth is through the use of asset-based thresholds. Because asset-based thresholds are often used to dictate supervisory and regulatory requirements, a bank approaching an asset-based regulatory threshold may limit growth to avoid higher compliance costs. Over time, however, nominally fixed asset thresholds can ensnare more banks into greater regulatory and supervisory oversight as they grow through organic or inflationary means. While an exhaustive review of all asset-based thresholds used in bank supervision and regulation is outside the scope of this article, we examine cumulative asset growth at banks since the passage of the Dodd-Frank Act in 2010:Q3, which set $10 billion as a key regulatory hurdle._
We first examine how the distribution of banks has changed since the passage of the Dodd-Frank Act. Chart 7 shows that the distribution of asset levels has moved higher since mid-2010, in line with the overall growth trends noted earlier. However, the bank size distribution has most noticeably shifted for banks below about $8 billion in asset size, while there has been little movement for banks closer to $10 billion._ Importantly, most banks were, and remain, far from the $10 billion Dodd-Frank threshold, with 95 percent of banks in the United States reporting total assets of $6 billion or less. This distribution demonstrates that the $10 billion threshold is not a meaningful constraint for most banks.
Chart 7: Bank Size Distribution
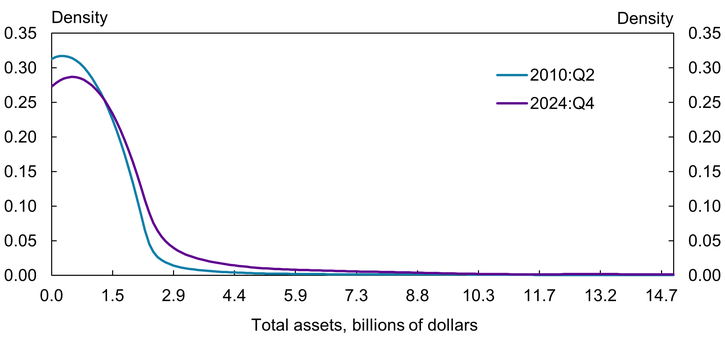
Notes: Chart shows the kernel density of bank assets in 2010:Q2 and 2024:Q4 estimated using banks with $50 billion or less in total assets in each period. Kernel density is estimated from total banking assets consolidated at the top holder level using the Epanechikov kernel and a bandwidth of 1. Estimation sample excludes banks over $50 billion in assets.
Source: FFIEC Call Reports.
Second, we examine cumulative growth trends among banks that had fewer than $10 billion in assets in 2010:Q2. We find that, consistent with our earlier results, mergers are a key driver of rapid growth at small banks. Table 2 restricts our earlier analysis to only banks that had less than $10 billion in assets in 2010:Q2 and shows that, in total, 61 banks crossed the $10 billion threshold by 2024:Q4. Incredibly, four of these banks grew enough cumulatively to cross the $50 billion threshold. For the four fastest-growing banks, median cumulative growth was 17 percent per year on a nominal basis, while median merger-adjusted growth was about 7 percent per year. These figures imply that the banks that grew most rapidly in the post-GFC period did so by both acquiring existing banks and finding organic growth opportunities. However, acquisitions contributed more to overall growth than nominal, organic growth.
Growth at the remaining 57 banks that crossed the $10 billion threshold but did not reach $50 billion was more balanced. Median nominal growth averaged 9.89 percent per year, while merger-adjusted growth averaged 4.6 percent per year, suggesting both acquisitions and organic growth helped small banks grow to become mid-sized banks.
Finally, Table 2 shows little difference between nominal and merger-adjusted growth for banks that did not cross the $10 billion threshold. Median average annual nominal growth was 4.9 percent for small banks, while median average annual merger-adjusted growth was 4.3 percent. This result suggests that mergers were not a meaningful factor driving growth at banks that remained small from 2010 to 2024.
Table 2: Cumulative Community Bank Asset Growth, 2010:Q2–2024:Q4
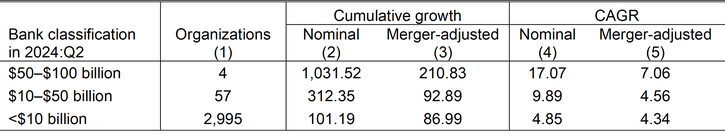
Note: Table includes banks with total consolidated assets of $10 billion or less in 2010:Q2.
Sources: FFIEC Call Reports and authors’ calculations.
These data are consistent with the results from previous studies. For instance, Bouwman, Hu, and Johnson (2018) find that “near below threshold” banks exhibited slower growth and charged higher interest rates on loans than those above the threshold. Alvero, Ando, and Xiao (2023) show that banks tend to bunch around regulatory thresholds and compliance costs rose following the implementation of the Dodd-Frank Act. Morgan and Yang (2016) find similar bunching behavior but note that constraining growth through the use of asset-based thresholds might limit the too-big-to-fail problem in banking._ Ballew, Iselin, and Nicoletti (2021) also find that banks that approached the $10 billion threshold following the Dodd-Frank Act’s implementation exhibited slower growth and lower profitability to avoid increased oversight. However, their analysis also shows that some banks sought to boost profitability by targeting riskier banks for acquisition to reduce the average fixed costs of increased regulatory compliance. Overall, our results demonstrate a similar bifurcation: some banks, when confronted with regulatory thresholds, chose to grow rapidly via mergers and acquisitions, while others appear to have avoided the higher regulatory compliance costs that would be triggered by additional growth.
Conclusion
Our analysis shows that bank size has increased sharply over the last 15 years, driven by several factors whose influence varied over that period. For example, inflation was a strong driver of nominal asset growth after the pandemic. On the other hand, real asset growth net of merger activity has been modest on an annual basis across banks, with typical growth in the 2 to 3 percent per annum range, in line with U.S. GDP growth during this period. Most strikingly, we find that mergers are a significant driver of growth, particularly for banks that grew very rapidly. This finding suggests that banks wishing to scale up their operations are more apt to do so through acquisition rather than through ramping up lending operations or finding scale through more organic means.
Finally, we analyze the role that supervision and regulation plays in influencing asset growth by examining growth trends at banks near a key regulatory threshold. Similar to our overall evidence, we find that banks that increased above the key threshold did so primarily by engaging in acquisitions. However, the handful of banks that grew very rapidly post-GFC did so by combining acquisitions with strong organic growth. At the same time, banks that did not move over the threshold showed slower organic growth and significantly less M&A activity. Our results reveal a duality for banks near regulatory thresholds: Some seek to avoid crossing the threshold by slowing growth and not pursuing acquisitions, while others choose to rapidly grow through either or both means, likely to reduce the fixed cost of increased compliance resulting from moving over the threshold.
Endnotes
-
1 Between 2010:Q2 and 2024:Q4, the Consumer Price Index (CPI) increased by 46 percent, the price index for personal consumption expenditures (PCE) increased by 38.3 percent, and the implicit GDP deflator increased by 40.9 percent.
-
2 Hannan and Pilloff (2006) discuss how merger activity often seeks to transfer assets from less profitable, inefficient banks to larger and more efficient acquirers.
-
3 It should be noted that mergers between banks do not increase aggregate banking assets. Banking system expansions can only be driven by the other three sources of growth.
-
4 Failed bank assets and liabilities are typically acquired by other banks in a fashion similar to a typical M&A transaction. That is, assets and liabilities of failed banks continue to be serviced by an acquiring institution.
-
5 Note that bank consolidation continued to occur during the depths of the GFC due to the acquisition of failed banking assets by surviving institutions.
-
6 Measuring the effect of monetary and fiscal policy is difficult because policy changes arise as part of both organic and inflation-led asset growth. Complications also arise from measuring second-order and multiplier effects that are outside the scope of this article. Therefore, we rely only on the descriptive information presented earlier to inform the reader of these effects.
-
7 We consolidate banks filing the Call Report in each quarter by top holder.
-
8 The CAGR is the quarterly geometric average growth rate needed to increase base period assets to its ending period level over the entire time horizon. Real growth rates are calculated by deflating nominal bank asset levels with the GDP deflator from the Bureau of Economic Analysis via FRED. Real total assets are in 2010:Q2 dollars to measure the effect between the passage of the Dodd-Frank Act and the end of the GFC. See part B of the online appendix for derivations of quarterly and cumulative merger-adjusted growth rates based on the methodology described in English and Nelson (1997). Briefly, merger-adjusted growth rates compare post-merger asset levels—that is, the assets reported by the surviving institution following the merger and the sum of pre-merger assets that form the base period.
-
9 Cumulative real and nominal growth rates are reported in part A of the online appendix.
-
10 Part B of the online appendix shows how the difference between nominal and real growth rates depends on the relative size of the beginning and end period real levels, which accounts for the non-constant differences across bank size groups. Inflationary effects are uniform when growth rates are approximated using log differences, but log differenced growth rates poorly estimate actual growth rates when growth is rapid.
-
11 Table 1 is replicated for the pre- and post-pandemic periods in part A of the online appendix.
-
12 Hou and Warusawitharana (2018) and Labonte and Perkins (2021) provide more general discussions of thresholds put in place by the Dodd-Frank Act. For a detailed account of the supervisory and regulatory changes a bank encounters when it moves above the $10 billion threshold, see Rainbolt (2025).
-
13 We estimate the kernel density using banks with total consolidated assets of $50 billion or less to reduce the influence of very large banks that produce a distribution long tail. The chart shows the estimated distribution truncated at $15 billion to highlight changes among smaller banks.
-
14 “Too-big-to-fail” is the idea that the largest and most systemically important banks will require government funded bailouts should they experience severe stress because any attempted resolution would spark a financial crisis.
Article Citation
Marsh, W. Blake, and Joshua Jacobs. 2026. “What Explains Bank Asset Growth Since the Global Financial Crisis?” Federal Reserve Bank of Kansas City, Economic Review, vol. 111, no. 3. Available at External Linkhttps://doi.org/10.18651/ER/v111n3MarshJacobs
Publication information: Vol. 111, no. 3
DOI: 10.18651/ER/v111n3MarshJacobs
References
Acharya, Viral, and Raghuram Rajan. 2024. “Liquidity, Liquidity Everywhere, Not a Drop to Use: Why Flooding Banks with Central Bank Reserves May Not Expand Liquidity.” Journal of Finance, vol. 79, no. 5, 2943–2991. Available at External Linkhttps://doi.org/10.1111/jofi.13370
Alvero, Adrien, Sakai Ando, and Kairong Xiao. 2023. “Watch What They Do, Not What They Say: Estimating Regulatory Costs from Revealed Preferences.” Review of Financial Studies, vol. 36, no. 6, pp. 2224–2273. Available at External Linkhttps://doi.org/10.1093/rfs/hhac089
Adams, Robert, and John Driscoll. 2018. “How the Largest Bank Holding Companies Grew: Organic Growth or Acquisitions?” Board of Governors of the Federal Reserve System, FEDS Notes, December 21. Available at External Linkhttps://doi.org/10.17016/2380-7172.2282
Ball, Laurence, Daniel Leigh, and Prachi Mishra. 2022. “Understanding U.S. Inflation during the COVID-19 Era.” Brookings Papers on Economic Activity, Fall 2022, pp. 1–80. Available at External Linkhttps://doi.org/10.1353/eca.2022.a901276
Ballew, Hailey, Michael Iselin, and Allison Nicoletti. 2021. “Accounting-Based Thresholds and Growth Decisions in the Banking Industry.” Review of Accounting Studies, no. 27, pp. 232–274. Available at External Linkhttps://doi.org/10.1007/s11142-021-09589-6
Bouwman, Christa H. S., Shuting (Sophia) Hu, and Shane A. Johnson. 2018. “Differential Bank Behaviors Around the Dodd-Frank Act Size Thresholds.” Journal of Financial Intermediation, vol. 34, pp .47–57. Available at External Linkhttps://doi.org/10.1016/j.jfi.2018.01.005
Castro, Andrew, Michele Cavallo, and Rebecca Zarutskie. 2022. “Understanding Bank Deposit Growth During the COVID-19 Pandemic.” Board of Governors of the Federal Reserve System, FEDS Notes, June 3. Available at External Linkhttps://doi.org/10.17016/2380-7172.3133
Committee for a Responsible Federal Budget. 2024. “Government Spending Just Keeps on Growing.” June 21.
English, William, and William Nelson. 1997. “Profits and Balance Sheet Developments at Commercial Banks in 1997.” Federal Reserve Bulletin vol. 84, p. 408.
Hannan, Timothy H., and Steven J. Pilloff. 2006. “Acquisition Targets and Motives in the Banking Industry.” Board of Governors of the Federal Reserve System, Finance and Economics Discussion Series Working Paper No. 2006-40, December. Available at External Linkhttps://doi.org/10.2139/ssrn.951211
Hong, Gee Hee, and Deborah H. Lucas. 2023. “Evaluating the Costs of Government Credit Support Programs during COVID-19: International Evidence.” International Monetary Fund Working Papers, vol. 2023, no. 6. Available at External Linkhttps://doi.org/10.5089/9798400231971.001
Hou, David, and Missaka Warusawitharana. 2018. “Effects of Fixed Nominal Thresholds for Enhanced Supervision.” Board of Governors of the Federal Reserve System, FEDS Notes, July 19. Available at External Linkhttps://doi.org/10.17016/2380-7172.2183
Labonte, Marc, and David W. Perkins. 2021. “Over the Line: Asset Thresholds in Bank Regulation.” Congressional Research Service, May 3.
Marsh, W. Blake, and Brendan Laliberte. 2023. “The Implications of Unrealized Losses for Banks.” Federal Reserve Bank of Kansas City, Economic Review, vol. 108, no. 2, pp. 5–24. Available at External Linkhttps://doi.org/10.18651/ER/v108n2MarshLaliberte
Marsh, W. Blake, and Padma Sharma. 2024. “Loan Guarantees in a Crisis: An Antidote to a Credit Crunch?” Journal of Financial Stability, 72. Available at External Linkhttps://doi.org/10.1016/j.jfs.2024.101244
Morgan, Donald P., and Bryan Yang. 2016. “External LinkFear of $10 Billion.” Federal Reserve Bank of New York, Liberty Street Economics, October 3.
Pierri, Nicola, and Yannick Timmer. 2022. “The Importance of Technology in Banking during a Crisis.” Journal of Monetary Economics, vol. 128, May, pp. 88–104. Available at External Linkhttps://doi.org/10.1016/j.jmoneco.2022.04.001
Rainbolt, David. 2025. “RE: RIN 3064-ZA39 – Regulatory Publication and Review Under the Economic Growth and Regulatory Paperwork Reduction Act.” FDIC, comment letter submitted January 21.
W. Blake Marsh is a senior economist at the Federal Reserve Bank of Kansas City. Joshua Jacobs is a research associate at the bank. The views expressed are those of the authors and do not necessarily reflect the positions of the Federal Reserve Bank of Kansas City or the Federal Reserve System.
Authors

W. Blake Marsh
Senior Economist