Historically, average income in rural areas of the United States has been lower than in urban areas but has grown at a faster rate. If income growth is high enough, income in rural areas could “catch up” or converge over time with urban areas. In recent years, however, average rates of business and population entry and exit have declined across the United States and more so in rural and small urban areas, so rates of income convergence may also have slowed.
Jason P. Brown and Bobby Beckemeyer investigate income growth and convergence in rural and urban areas over the past 50 years. They find that while income in lower-income counties tended to grow faster than in higher-income counties, this “catch-up” effect was significantly higher in rural areas from 1970 to 2010. Moreover, rural counties saw higher rates of income growth and convergence than urban counties regardless of whether they were adjacent to urban counties. However, income convergence in rural areas has slowed over time. From 2010 on, income growth and the rate of convergence were no longer significantly higher in rural counties than urban ones. Thus, the relative gap between average rural and urban incomes is likely to persist unless these trends reverse.
Article Citation
Brown, Jason P., and Bobby Beckemeyer. 2026. “Catching Up or Falling Behind? The Pace of Income Convergence in Rural and Urban America.” Federal Reserve Bank of Kansas City, Economic Review, vol. 111, no. 2. Available at External Linkhttps://doi.org/10.18651/ER/v111n2BrownBeckemeyer
Introduction
Historically, average income in rural areas of the United States has been lower than in urban areas but has grown at a faster rate. In theory, lower-income areas could “catch up” or converge over time with higher-income areas if income growth is high enough. In recent years, however, average rates of business and population entry and exit—indicators of a dynamic economy better able to weather downturns—have declined across the United States and more so in rural and small urban areas. Is income growth in rural areas still on pace to catch up to urban areas, or is the gap between rural and urban areas widening?
We investigate income growth and convergence in rural and urban areas over the past 50 years. We find that while income in lower-income counties tended to grow faster than in higher-income ones, this “catch-up” effect was significantly higher in rural areas from 1970 to 2010. In other words, a county that was both lower income and rural tended to see more income growth compared with a county that was only lower income or only rural. Moreover, rural counties saw higher rates of income growth and convergence than urban counties regardless of whether they were adjacent to urban counties. However, income convergence in rural areas has slowed over time; during the 2010–23 period, convergence in rural counties was roughly half the rate observed between 1970 and 1990. From 2010 on, income growth and the rate of convergence were no longer significantly higher in rural counties regardless of urban area proximity. Thus, the larger declines in dynamism in rural areas have coincided with both slowing income growth and slowing income convergence, and the relative gap between average rural and urban incomes is likely to persist unless these trends reverse.
Section I describes trends in income and income growth in rural and urban areas and introduces a common measure of income convergence. Section II estimates the rate of income convergence in U.S counties over three separate periods and tests for differences in the rate of convergence across rural areas and over time.
I. Income Convergence in Rural and Urban Areas
Average per capita income tends to be lower in rural areas than in urban areas._ Chart 1 shows average annual real income per capita in rural and urban areas from 1970 to 2023. In 1970, average real income per capita was $20,100 in rural areas compared with $24,600 in urban areas—a difference of $4,500. Over the subsequent 50 plus years, incomes in rural and urban areas grew by similar dollar amounts. By 2023, average real income per capita was $44,700 in rural areas compared with $49,400—a difference of $4,700.
Chart 1: The Gap Between Average Rural and Urban Income Has Persisted Over Time
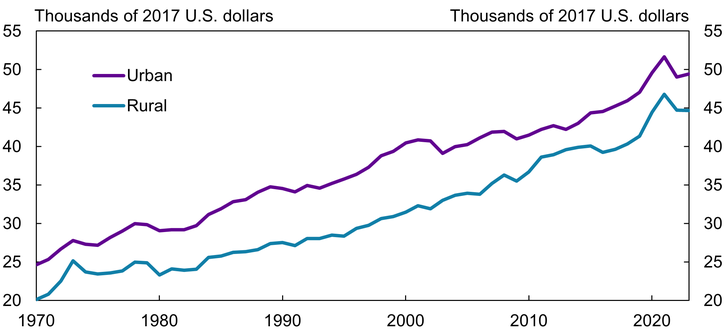
Note: The chart shows average real per capita income in rural and urban areas from 1970 to 2023.
Source: U.S. Bureau of Economic Analysis (BEA).
Despite these similarities in per capita income, income grew at a faster rate in rural areas, increasing from 82 percent of urban income in 1970 to 90 percent of urban income in 2023. This increased share suggests rural incomes may be narrowing the gap and converging to urban incomes over time.
This narrowing gap could reflect “beta convergence,” or the theory that income in poorer areas grows faster than in richer areas. This faster growth eventually closes the gap in per capita income and living standards and is often called the “catch-up effect” (Barro and Sala-i-Martin 1992; Sala-i-Martin 1996). We test beta convergence among U.S. counties to see whether areas with lower initial income (typically rural areas) grow faster than areas with higher initial income (typically urban areas).
Chart 2 shows that beta convergence holds at the county level, with a clear difference between rural and urban areas. The chart shows a scatter plot of U.S. counties’ initial real per capita income in 1970 relative to U.S. counties’ real per capita income growth from 1970 to 2023. Each dot in the plot represents an individual county. The downward sloping trend line indicates a negative relationship, meaning that counties with lower income in 1970 tended to experience higher income growth over the subsequent decades. In particular, rural counties (purple dots) tended to have lower initial income and higher growth compared with urban counties (blue dots).
Chart 2: Areas with Lower Initial Income Tended to Have Higher Income Growth Over Time
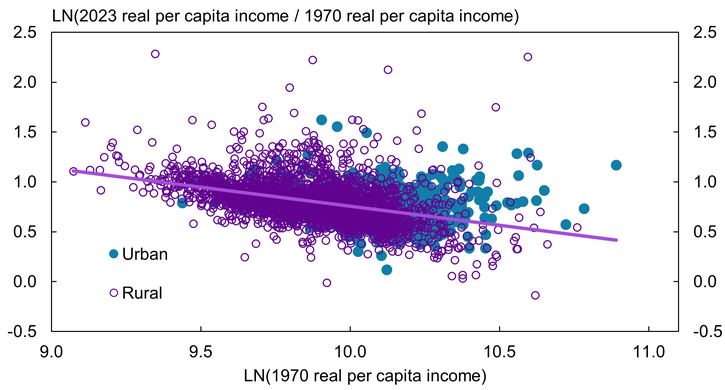
Notes: The chart summarizes the relationship between log real per capita income in 1970 and log real per capita income growth. The trend line indicates a negative relationship, meaning that areas with lower income in 1970 tended to experience higher income growth between 1970 and 2023.
Source: BEA and authors’ calculations.
Although our initial test shows some evidence of beta convergence, the gap in average income between rural and urban areas did not fully close by 2023. This enduring gap may reflect a slowdown in the rate of income convergence or the influence of other factors that can drive income growth. For example, Gennaioli and others (2014) find that areas with higher educational attainment tend to grow faster. McGranahan, Wojan, and Lambert (2011) explore rural growth capacity and find that rural areas with high natural amenities attract more entrepreneurial activity, leading to more jobs and business activity. Ganong and Shoag (2017) find that income convergence has slowed over time, though this slowdown is less pronounced in states with less restrictive housing development policies. In addition, Higgins, Levy, and Young (2006) find that regional differences matter to U.S. income convergence, with higher rates of convergence in the Northeast and South.
One potential factor that has received less attention is the suburbanization of rural areas. Rural counties that are adjacent to urban areas, for example, may have different rates of income convergence than rural counties that are far from population centers. Whether urban adjacency has influenced beta income convergence—and whether the rate of beta convergence has changed over time—is an open question.
II. Estimating the Rate of Income Convergence Over Time in Rural Areas
To estimate both the rate of income convergence across rural and urban areas as well as the factors contributing to convergence over time, we estimate the amount of beta income convergence from county-level growth models for three separate time periods—1970 to 1990, 1990 to 2010, and 2010 to 2023—conditional on local economic factors. Specifically, we use a series of linear models to estimate the growth g in county i. The model is expressed by:
gi = ln(rpcit/rpcit0) = α + β1 ln(rpcii,t0) + β2rurali + β3rurali × ln(rpcii,t0) + θkXk,i,t0 + γsStates + εi,
where the log ratio of final period and initial period real per capita income (rpci) is a function of an intercept term α (which measures the average income growth across counties), the log of initial period real per capita income, an indicator for whether the county is rural, an interaction term between rural classification and the log of initial period income, a vector containing county factors (X) measured in the initial period t0 that are assumed to influence growth, a set of indicators for the state in which the county is located, and an error term that captures omitted factors in the model._ We allow the county designation of “rural” to change with updated classifications provided by the U.S. Department of Agriculture’s Economic Research Service (USDA ERS) in 1974, 1993, and 2013. The set of local conditions we control for in the base year (1970, 1990, and 2010) include population age and racial demographics, educational attainment, natural amenities, the share of employment in goods-producing sectors, and the net migration rate of the county.
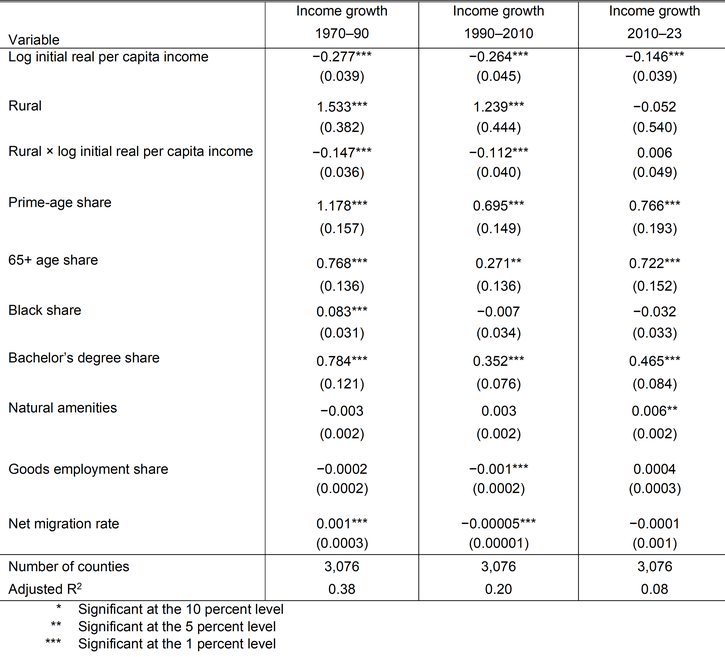
Table 1 shows the results of estimated income growth for all three periods, focusing on whether a county is urban or rural (full results include other factors and are provided in appendix Table A-3). Row 1 of Table 1 provides the beta convergence rate for each period—that is, the percent change in income growth relative to a 1 percent change in initial real per capita income. For example, a 1 percent higher initial income in 1970 is associated with a 0.28 percent decline in the income growth rate over the 1970–90 period. The negative coefficients on initial income in row 1 confirm that, on average, U.S. counties with lower initial income experienced higher income growth over subsequent decades, evidence of conditional beta convergence across the United States in each period.
Table 1: Select Determinants of County Income Growth by Period
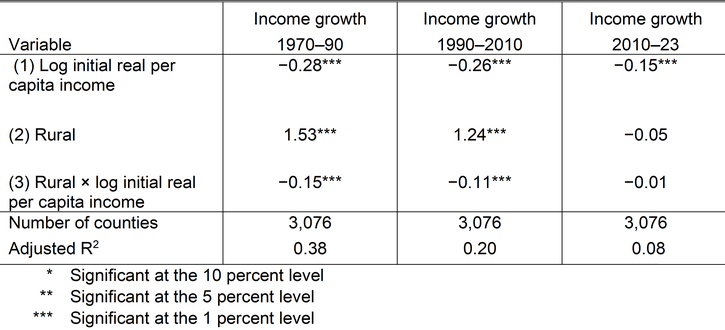
Notes: Models include county-level controls and state fixed effects. See appendix Table A-3 for the complete results.
The results in Table 1 show that while rural counties experienced higher income growth and convergence than the average county in earlier decades, this trend has stalled since 2010. Relative to the U.S. average, rural counties’ income growth was 1.53 percent higher in the 1970–90 period, 1.24 percent higher in the 1990–2010 period, but similar to the average U.S. county in the 2010–23 period (as shown in Table 1, row 2). The negative coefficient for the interaction term in row 3 of Table 1 (for example, −0.15 in 1970–90) means that convergence happened faster in rural counties than in urban ones; while all lower income counties tended to grow faster than higher income ones, the “catch-up” effect was significantly higher in rural areas. In other words, a county that was both lower income and rural tended to have faster income growth than a county that was only lower income or only rural. This higher convergence in rural areas was present in the 1970–90 and 1990–2010 periods but not in the 2010–23 period.
While Table 1 shows a premium in income convergence for rural areas overall, this premium may differ for rural counties by geography. Rural counties bordering cities, for example, often function as extensions of the urban labor market; these counties might see faster income growth if higher-income individuals begin moving into them as far-flung suburbs. In contrast, especially remote counties may rely on internal resources or industry-specific demand to drive growth; these counties might see their income growth vary with ebbs and flows in certain industries.
To account for this potential geographic variation, we separate rural counties based on whether they are adjacent or non-adjacent to urban areas (see Table A-1 for county definitions and their shares over time). To see whether one or both subcategories display higher growth and income convergence, we include an indicator for each subcategory and re-estimate growth over the same periods.
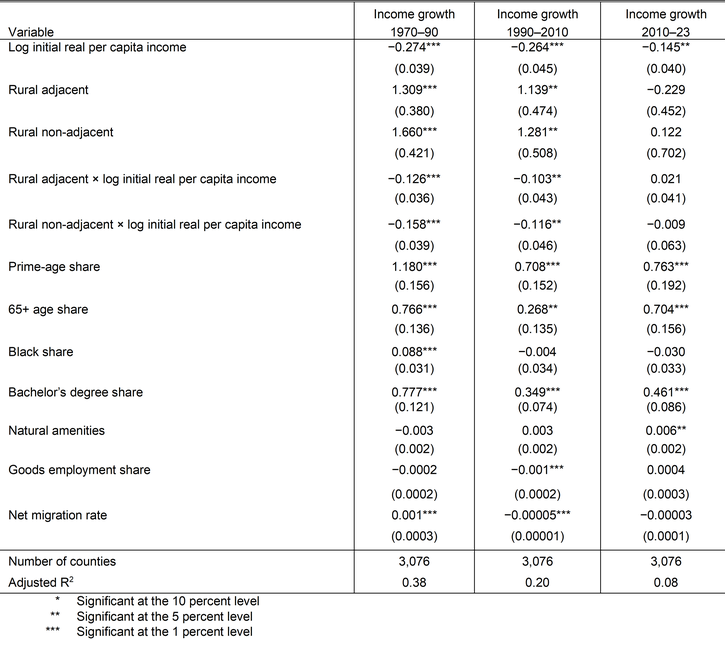
The results in Table 2 show that higher income growth and income convergence occurred in rural counties both adjacent and non-adjacent to urban areas. Row 2 of Table 2 shows that, compared with urban counties, income growth was 1.31 percent higher in rural counties adjacent to urban areas during the 1970–90 and 1990–2010 periods._ This adjacent-county rural growth coincided with growth in urban areas driven by suburbanization (Rappaport 2005). Presumably, rural areas in closer proximity to areas experiencing population growth from suburbanization might also experience income growth if people with higher income moved into nearby rural areas that serve as bedroom communities to urban areas (Partridge and others 2007; Pender, Marré, and Reeder 2012).
Table 2: Select Determinants of County Income Growth, Rural (Adjacent/Non-Adjacent to Urban Areas)
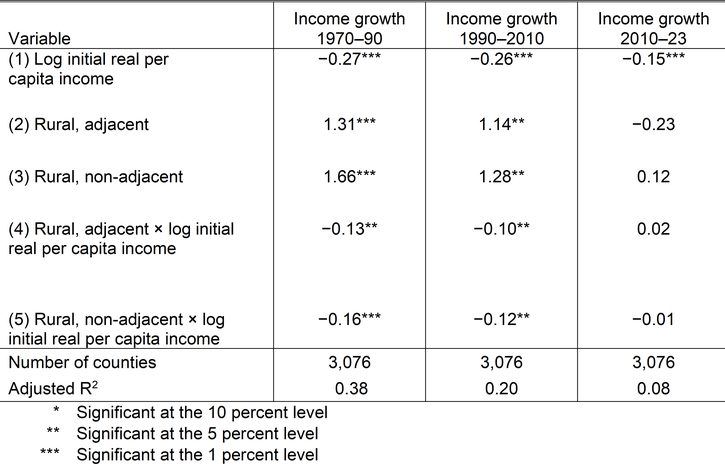
Notes: Models include county-level controls and state fixed effects. See Table A-4 for the complete results.
Table 2 also shows that income (beta) convergence in rural areas adjacent and non-adjacent to urban areas followed similar patterns in growth over time. Row 4 shows that the interaction term between urban adjacency and initial income is only significant in the 1970–90 (coefficient −0.13) and 1990–2010 (coefficient –0.10) periods. The negative coefficient on this interaction means that convergence happened faster in rural counties adjacent to urban counties than in urban counties. The additional beta convergence in these counties coincides with the period of rapid suburbanization. Similarly, row 5 shows a higher rate of beta convergence for rural counties non-adjacent to urban, but the additional catch-up effect is only significant in the 1970–90 period (coefficient −0.16) and the 1990–2010 period (coefficient −0.12). In the last period analyzed, the rate of income convergence was not significantly different in rural areas regardless of proximity to urban population. While the growth rate (1.66 versus 1.31) and beta convergence (−0.16 versus −0.13) was slightly higher in non-adjacent counties versus those adjacent to urban areas, the differences were not statistically significant. Thus, while suburbanization was a likely factor in income growth and convergence of rural areas near urban populations, we find that the convergence rates were similar in rural counties adjacent and non-adjacent to urban areas across all time periods. Taken together, these results suggest that proximity to urban areas—while consistent with the timing of suburbanization—does not fully account for the observed patterns of income growth and convergence across all rural areas.
Instead, the timing of rural growth suggests a parallel role for sectoral restructuring, particularly within manufacturing. Rural communities non-adjacent to urban areas also experienced higher income growth relative to urban areas between 1970 and 1990 (1.66 percent) and 1990 and 2010 (1.28 percent). From the 1970s to mid-1990s, many rural areas experienced substantial growth due to the manufacturing sector, as firms sought to take advantage of cheaper wages and areas perceived to be more business-friendly (Isserman 2001; Wilkerson 2001). The manufacturing sector experienced large declines in employment in subsequent decades primarily due to increased globalization of production, an economic recession in 2001, and the global financial crisis in 2008. These economic and structural changes led to slower growth in rural areas across the board. In 2010–23, income growth was no longer significantly higher in rural areas regardless of proximity to urban areas.
Overall, from 1970 to 2010, rural counties both adjacent and non-adjacent to urban areas saw higher income growth and higher convergence than urban counties, likely influenced by suburbanization and manufacturing shifts. After 2010, structural economic changes led to similar income growth rates across all rural areas.
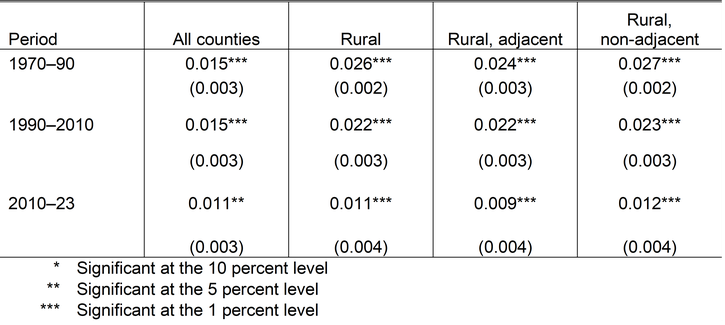
Having established that rural areas experienced income convergence regardless of their proximity to urban centers, we now quantify the rate of this convergence process across different time periods and county types. To do so, we use the results of our county growth models to calculate the annualized rate of convergence over the three periods analyzed for all U.S. counties and all counties in rural areas. The formula for the annualized rate of convergence is R = −(1/T) ∙ ln(1 + β1), where T is the number of years spanning the growth model and β1 is the coefficient on initial income. The formula for rural areas is similar but with an additional term, R = −(1/T) ∙ ln(1 + β1 + β3), where β3 is the coefficient on the interaction term between rural counties and initial income. The last term can be substituted for the coefficient that corresponds to rural adjacent or rural non-adjacent counties.
Chart 3 reports income convergence rates across the three periods for all U.S. counties, all rural counties, and rural counties by proximity to urban areas (adjacent and non-adjacent)._ The light blue bars show that the average convergence rate across U.S. counties declined from 1.5 percent in 1970–90 to 1.1 percent in 2010–23—a 26 percent reduction over the last 50 years.
Chart 3: Income Convergence in Rural Counties Has Declined Over Time
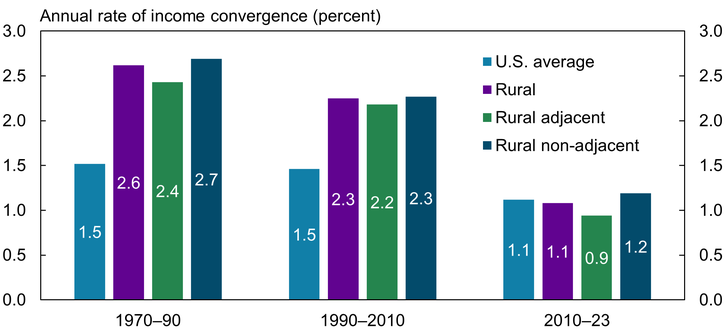
Note: The chart shows the annualized rate of income convergence by county type over time.
Source: BEA and authors’ calculations.
Although income convergence in rural areas was higher from 1970 to 2010, it has also declined the most since. The purple bars in the chart show that annual income convergence in rural areas declined from 2.6 percent in the 1970–90 period to 1.1 percent in 2010–23—a 58 percent decline. This decline—as well as the component declines for rural areas both adjacent to and non-adjacent to urban areas—is substantially larger than the decline for the United States overall (light blue bars). While suburbanization and the competitive advantage of manufacturing may have been important factors in rural growth and income convergence in earlier periods, they were not important contributors to growth in recent decades.
Conclusion
Business and population turnover has declined in the United States, with rural areas seeing greater declines than urban areas (Brown 2018; Brown and Tousey 2020). Labor markets in areas with lower turnover may be more vulnerable to downturns in the economy or to structural changes in the economy. If the gap between rural and urban area dynamics persists or widens further, the gap between their economic fortunes may widen as well.
We calculate income growth in rural and urban areas and estimate the rate of income convergence across U.S. counties over time. From 1970 to 2010, rural areas experienced higher real per capita income growth, and the rate at which lower-income areas were catching up to higher-income areas was also higher in rural areas. However, the rate of income convergence in the United States overall has declined substantially in recent decades and declined significantly more in rural areas. The factors driving growth in rural areas between 1970 and the mid-1990s appear to have shifted. Unless a new competitive advantage for rural areas emerges, the relative gap between average rural and urban incomes is likely to persist.
Appendix
Defining Rural Areas
A county’s classification as rural can change over time due to growth in the county or in neighboring areas. We use the USDA ERS Rural Urban Continuum Codes (RUCC) to designate whether a county is rural or urban. A county with RUCC code between 4 and 9 is considered rural. We update the classification every decade between 1970 and 2010. In Table A-1, we report the share of counties in each category for the years in which we use the rural designation in our county growth models. Over time, more counties are designated as urban and in areas that are adjacent to urban populations.
Table A-1: Share of Counties in Rural Urban Continuum Codes (RUCC)
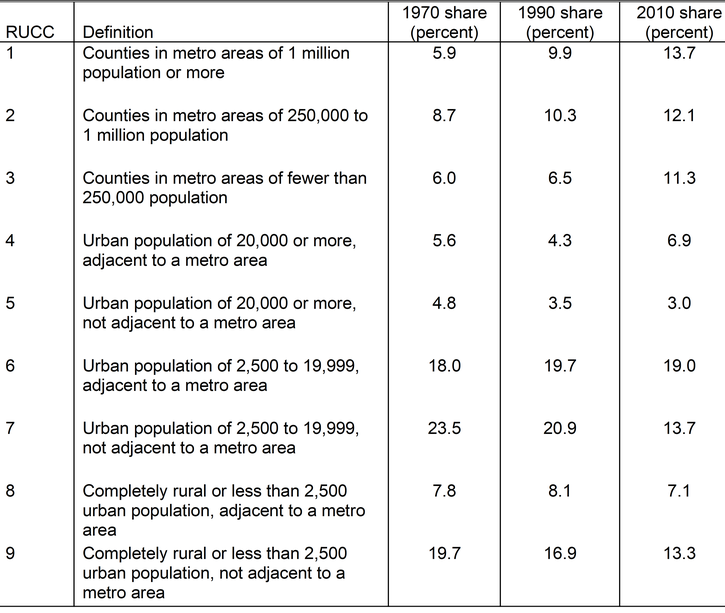
Note: Calculations are based on 3,051 counties.
Source: USDA ERS.
County-Level Measures
Table A-2 contains the list and source of variables used to estimate the county-level growth models over the three separate time periods.
Table A-2: County-Level Measures Used in Growth Models
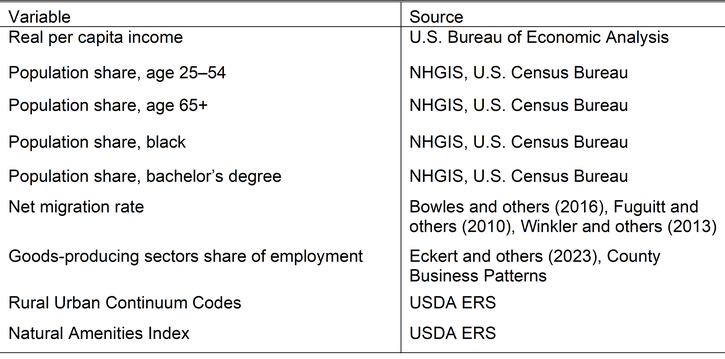
Notes: The number and composition of U.S. counties changes over time. We use the work of Logan, Xu, and Stults (2012) to construct a county-to-county crosswalk that is consistent over time.
Additional Results
Table A-3: Determinants of County Income Growth
Notes: Spatially robust standard errors are in parentheses. Models include state fixed effects.
Table A-4: Determinants of County Income Growth, Rural Adjacent Versus Non-Adjacent to Urban Areas
Notes: Spatially robust standard errors are in parentheses. Models include state fixed effects.
Table A-5: Annualized Rate of Income Convergence by County Type
Endnotes
-
1 We define rural as synonymous with non-metro, which is a county with a Rural Urban Continuum Code (RUCC) of 4-9 according to the U.S. Department of Agriculture's Economic Research Service (USDA ERS). See the discussion in the appendix and Table A-1 for more details.
-
2 Rey and Montouri (1999) and Dall’erba and Le Gallo (2008) find evidence of spatial dependence in county-level models of income convergence in the United States and European Union. Our diagnostic tests show that the omitted factors are spatially correlated, which we adjust for following the method provided by Conley (1999).
-
3 See Table A-4 for the complete results.
-
4 We report the estimates of annualized rates of income convergence in Table A-5 along with standard errors of the estimates.
Article Citation
Brown, Jason P., and Bobby Beckemeyer. 2026. “Catching Up or Falling Behind? The Pace of Income Convergence in Rural and Urban America.” Federal Reserve Bank of Kansas City, Economic Review, vol. 111, no. 2. Available at External Linkhttps://doi.org/10.18651/ER/v111n2BrownBeckemeyer
Publication information: Vol. 111, no. 2
DOI: 10.18651/ER/v111n2BrownBeckemeyer
References
Barro, Robert J., and Xavier Sala-i-Martin. 1992. “Convergence.” Journal of Political Economy, vol. 100, no. 2, pp. 223–251. Available at External Linkhttps://doi.org/10.1086/261816
Bowles, Gladys K., James D. Tarver, Calvin L. Beale, and Everette S. Lee. 2016. “Net Migration of the Population by Age, Sex, and Race, 1950–1970.” Inter-university Consortium for Political and Social Research, May 11. Available at External Linkhttps://doi.org/10.3886/ICPSR08493.v2
Brown, Jason P. 2018. “The Widening Divide in Business Turnover Between Large and Small Urban Areas.” Federal Reserve Bank of Kansas City, Economic Review, vol. 103, no. 3, pp. 5–25. Available at External Linkhttps://doi.org/10.18651/ER/3q18Brown
Brown, Jason P., and Colton Tousey. 2020. “Population Turnover and the Growth of Urban Areas.” Federal Reserve Bank of Kansas City, Economic Review, vol. 105, no. 1, pp. 5–20. Available at External Linkhttps://doi.org/10.18651/ER/v105n1BrownTousey
Conley, T. G. 1999. “GMM Estimation with Cross Sectional Dependence.” Journal of Econometrics, vol. 92, no. 1, pp. 1–45. Available at External Linkhttps://doi.org/10.1016/S0304-4076(98)00084-0
Dall’erba, Sandy, and Julie Le Gallo. 2008. “Regional Convergence and the Impact of European Structural Funds Over 1989–1999: A Spatial Econometric Analysis.” Papers in Regional Science, vol. 87, no. 2, pp. 219–245. Available at External Linkhttps://doi.org/10.1111/j.1435-5957.2008.00184.x
Eckert, Fabian, Ka-leung Lam, Atif Mian, Karsten Müller, Rafael Schwalb, and Amir Sufi. 2023. “Early County Business Pattern Files: United States, 1946–1974.” Inter-university Consortium for Political and Social Research, December 4. Available at External Linkhttps://doi.org/10.3886/ICPSR38834.v1
Fuguitt, Glenn V., Calvin L. Beale, and Paul R. Voss. 2010. “County-Specific Net Migration Estimates, 1980–1990 [United States].” Inter-university Consortium for Political and Social Research, April 2. Available at External Linkhttps://doi.org/10.3886/ICPSR26761.v1
Ganong, Peter, and Daniel Shoag. 2017. “Why Has Regional Income Convergence in the U.S. Declined?” Journal of Urban Economics, vol. 102, pp. 76–90. Available at External Linkhttps://doi.org/10.1016/j.jue.2017.07.002
Gennaioli, Nicola, Rafael La Porta, Florencio Lopez De Silanes, and Andrei Shleifer. 2014. “Growth in Regions.” Journal of Economic Growth, vol. 19, pp. 259–309. Available at External Linkhttps://doi.org/10.1007/s10887-014-9105-9
Higgins, Matthew J., Daniel Levy, and Andrew T. Young. 2006. “Growth and Convergence Across the United States: Evidence from County-Level Data.” Review of Economics and Statistics, vol. 88, no. 4, pp. 671–681. Available at External Linkhttps://doi.org/10.1162/rest.88.4.671
Isserman, Andrew M. 2001. “Competitive Advantages of Rural America in the Next Century.” International Regional Science Review, vol. 24, no. 1, pp. 38–58. Available at External Linkhttps://doi.org/10.1177/016001701761013006
Logan, John R., Zengwang Xu, and Brian J. Stults. 2012. “Interpolating U.S. Decennial Census Tract Data from as Early as 1970 to 2010: A Longitudinal Tract Database.” Professional Geographer, vol. 66, no. 3, pp. 412–420. Available at External Linkhttps://doi.org/10.1080/00330124.2014.905156
McGranahan, David A., Timothy R. Wojan, and Dayton M. Lambert. 2011. “The Rural Growth Trifecta: Outdoor Amenities, Creative Class and Entrepreneurial Context.” Journal of Economic Geography, vol. 11, no. 3, pp. 529–557. Available at External Linkhttps://doi.org/10.1093/jeg/lbq007
Partridge, Mark, Ray D. Bollman, M. Rose Olfert, and Alessandro Alasia. 2007. “Riding the Wave of Urban Growth in the Countryside: Spread, Backwash, or Stagnation?” Land Economics, vol. 83, no. 2, pp. 128–152. Available at External Linkhttps://doi.org/10.3368/le.83.2.128
Pender, John, Alexander Marré, and Richard Reeder. 2012. “Rural Wealth Creation: Concepts, Measures, and Strategies.” American Journal of Agricultural Economics, vol. 94, no. 2, pp. 535–541. Available at External Linkhttps://doi.org/10.1093/ajae/aar076
Rappaport, Jordan. 2005. “The Shared Fortunes of Cities and Suburbs.” Federal Reserve Bank of Kansas City, Economic Review, vol. 90, no. 3, pp. 33–60.
Rey, Sergio J., and Brett D. Montouri. 1999. “U.S. Regional Income Convergence: A Spatial Econometric Perspective.” Regional Studies, vol. 33, no. 2, pp. 143–156. Available at External Linkhttps://doi.org/10.1080/00343409950122945
Sala-i-Martin, Xavier X. 1996. “The Classical Approach to Convergence Analysis.” The Economic Journal, vol. 106, no. 437, pp. 1019–1036. Available at External Linkhttps://doi.org/10.2307/2235375
Wilkerson, Chad. 2001. “Trends in Rural Manufacturing.” Federal Reserve Bank of Kansas City, Main Street Economist, December.
Winkler, Richelle, Kenneth M. Johnson, Cheng Cheng, Paul Voss, and Katherine J. Curtis. 2013. “County-Specific Net Migration by Five-Year Age Groups, Hispanic Origin, Race and Sex: 2000–2010.” Inter-university Consortium for Political and Social Research, September 5. Available at External Linkhttps://doi.org/10.3886/ICPSR34638.v1
Jason P. Brown is a vice president and economist at the Federal Reserve Bank of Kansas City. Bobby Beckemeyer is a research associate at the bank. The views expressed are those of the authors and do not necessarily reflect the positions of the Federal Reserve Bank of Kansas City or the Federal Reserve System.
Authors

Jason P. Brown
Vice President and Economist