Bank operations have changed significantly in the last 20 years, particularly with respect to the use of data, technology, and marketing. Banks have increased their focus on back-end technological capabilities related to their core systems as well as consumer-facing applications such as online and mobile banking._ Chart 1 illustrates this shift by plotting aggregate shares of bank spending on labor, physical premises (such as bank branches and office buildings), and IT and marketing._ While labor (purple area) remains the largest expenditure for banks, the share of spending on IT and marketing (blue area) has more than doubled from 4 percent in 2004 to 19 percent in 2025. Moreover, the sector anticipates continued growth in IT investment, as banks and financial services firms rank among the leading adopters of AI technologies.
Chart 1: Bank spending on IT and marketing has grown substantially
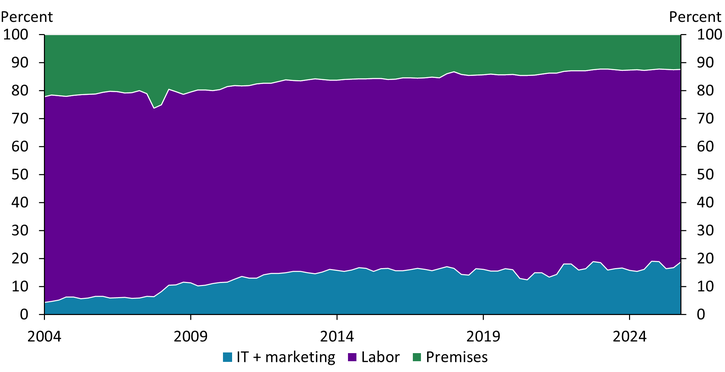
Note: Chart shows aggregate spending shares for all commercial banks for physical premises, labor, and spending on IT and marketing.
Source: FFIEC Call Reports (Board of Governors of the Federal Reserve System).
Increased spending on IT and data processing may deliver value for banks through many channels. For example, technological improvements may increase customer retention, facilitate cross-selling of additional bank products, attract new customers, and reduce acquisition costs. While we do not isolate any single channel, we focus our analysis on the relationship between IT spending and a bank’s overall profitability, as well as the pricing and performance of bank deposits and loans—all of which are affected by these channels.
To that end, we estimate the dynamic relationship between IT spending and bank-level outcomes while controlling for bank-specific and macroeconomic factors._ Specifically, we ask what happens over a five-year period when a bank increases its IT spending share from 20 percent to 40 percent. Chart 2 shows that doubling IT spending is associated with an initial increase in the bank’s return on equity from its average baseline of 8.2 percent (dotted black line) to 9.1 percent (blue line). This increase is sustained over the following five years.
Chart 2: Spending on IT is associated with higher bank profitability
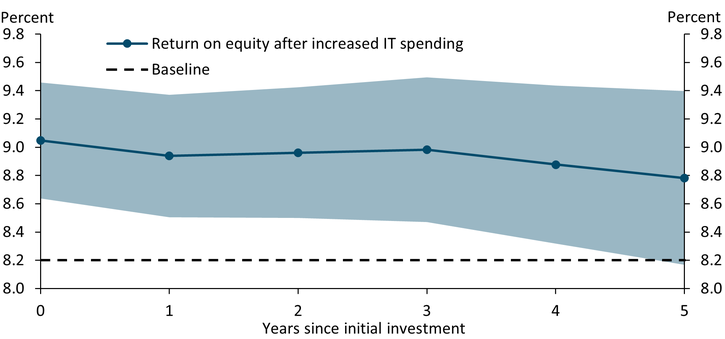
Notes: The dashed “baseline” represents the return on equity for a bank that did not increase its IT spending. The blue line represents the return on equity if the same bank increased its IT spending from 20 percent to 40 percent. Dots represent point estimates for the relationship between IT spending and bank return on equity over a five-year period, while the shaded band represents a 95 percent confidence interval for the estimates.
Source: FFIEC Call Reports (Board of Governors of the Federal Reserve System).
Although we find a strong relationship between IT spending and bank profits, spending could translate into profits in multiple ways. Higher profits could be the result of higher bank productivity from technology, for example, or the bank could be charging higher prices on its products to fund IT spending. We examine banks’ deposit spread—that is, income generated from paying below-market rates on deposit accounts—as well as income from account fees._ In our dataset, the typical bank generates $184 in annual income (from both spread and fees) from a deposit account. Chart 3 shows that under the same IT spending scenario used in Chart 2, we observe an increase in deposit account income, peaking at $194 in the third year. Although consumers may pay higher fees or receive lower deposit rates, increased IT investment may also improve the customer experience around their deposit accounts and associated services, so the net effect on consumer well-being is unclear.
Chart 3: Increased IT spending drives up bank income from deposit accounts
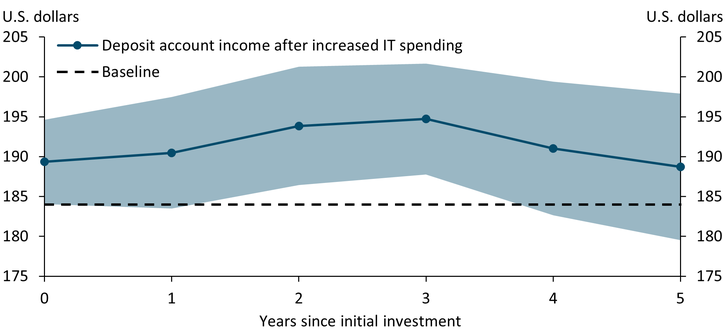
Notes: The dashed “baseline” represents income from a deposit account for a bank that did not increase its IT spending. The blue line represents income from a deposit account if the same bank increased its IT spending from 20 percent to 40 percent. Dots represent point estimates for the relationship between IT spending and deposit account income over a five-year period, while the shaded band represents a 95 percent confidence interval for the estimates.
Source: FFIEC Call Reports (Board of Governors of the Federal Reserve System).
A bank’s profits are also determined by interest on loans. When we calculate loan rates under our increased IT spending scenario, we do not find significant results, but we do find that an increase in bank IT spending is associated with an almost 25 percent drop in loan default rates.5 These results suggest that bank technology improvements help banks either screen new loan applicants better or monitor existing borrowers more effectively.
Together, our results suggest that by increasing spending on technology and marketing, banks can achieve higher profitability through increased deposit income and better loan performance. One important aspect not captured in this analysis is the timing and source of technology and data services for banks. Integrating technological improvements requires substantial upfront costs, so this type of investment is infeasible for most banks, particularly smaller community or regional banks. Smaller institutions must rely on third-party providers that offer limited customization and charge fees. This cost structure creates competitive headwinds for smaller banks and may increase consolidation pressures for the industry as a whole.
Endnotes
-
1 For a more detailed summary of bank spending and investment in core systems, see Alcazar and others (2024).
-
2 In constructing expense shares, we do not include other non-interest expense items (such as telecommunications or interchange) and instead focus only on physical capital, labor, and IT/marketing as the primary inputs to bank production.
-
3 Specifically, we use a statistical regression method known as local projections, similar to Jordà (2005), which allows us to understand the relationship between bank spending and bank outcomes over time. The main explanatory variable is the expenditure share for bank IT spending which varies at the bank-year level. We estimate robust standard errors, clustered at the bank level.
-
4 See Gödl-Hanisch and Pandolfo (2025).
-
5 Specifically, in the scenario in which a bank doubles its IT spending, loan default rates fall from a baseline of 0.29 percent to 0.22 percent.
Article Citation
Désiré, Thomas, and Jordan Pandolfo. 2026. “How Banks’ Technology Spending Affects Performance.” Federal Reserve Bank of Kansas City, Economic Bulletin, March 6.
References
Alcazar, Julian, Sam Baird, Emma Cronenweth, Fumiko Hayashi, and Ken Isaacson. 2024. “External LinkCore Banking Systems and Options for Modernization.” Federal Reserve Bank of Kansas City, Payments System Research Briefing, February 28.
Gödl-Hanisch, Isabel, and Jordan Pandolfo. 2025. “External LinkMonetary Policy Transmission, Bank Market Power, and Income Source.” Federal Reserve Bank of Kansas City, Research Working Paper no. 25-02, April.
Jordà, Òscar. 2005. “External LinkEstimation and Inference of Impulse Responses by Local Projections.” American Economic Review, vol. 95, no. 1, pp. 161−182.
The views expressed are those of the authors and do not necessarily reflect the positions of the Federal Reserve Bank of Kansas City or the Federal Reserve System.
Authors

Jordan Pandolfo
Economist