U.S. employment growth has slowed substantially over the past year, from an average of 170,000 per month in 2024 to only 75,000 per month through August 2025. Understanding the key drivers of this recent decline in job growth is important for policymakers as they seek to balance the Federal Reserve’s dual mandate of maximum employment and price stability. Indeed, even as inflation remains above the Federal Open Market Committee’s (FOMC) 2 percent target, focus has increased of late on slowing employment growth and downside risks to the labor market.
Several changes are buffeting the economy and likely affecting the pace of job growth, including rapid developments in AI as well as an aging demographic and reductions in immigration. Recent increases in tariff rates could also affect job growth. In principle, tariffs can increase or decrease labor demand. Tariff expenses increase input costs unless they are fully absorbed by foreign producers. As a result, import-dependent firms may scale back on hiring to reduce expenses elsewhere, particularly when firms can only partially pass on higher input costs to consumers. However, tariffs also protect U.S. firms from foreign competition, which makes U.S. firms more profitable. In turn, domestic firms that compete with foreign firms in the United States may be inclined to hire more workers.
We attempt to estimate which of these tariff effects has been more quantitatively important for U.S. employment growth. We do not attempt to measure any potential indirect effects of tariffs on employment. Although tariffs may slow down economic activity more broadly even for firms not directly exposed to tariffs—as firms may be more pessimistic about the overall economic outlook—these indirect effects are difficult to disentangle from other concurrent events. Further, it is important to note that our analysis only estimates the short-term effect of tariffs on employment. In the long run, firms could seek to avoid tariffs by shifting production capacity to the United States, which would increase labor demand. Tariffs could further lead to a reallocation of workers across sectors from services toward manufacturing (Rodríguez-Clare, Ulate, and Vasquez 2025).
To estimate the direct effect of tariffs on employment growth across sectors so far in 2025, we examine each sector’s import exposure, which has been shown to be a good proxy for the tariff burden of each sector (Bangert-Drowns 2025). Chart 1 shows that jobs in sectors with higher import exposure grew more slowly than jobs in sectors with lower import exposure, suggesting tariffs may have weighed on employment. Specifically, the dots in Chart 1 portray individual sectors and highlight their import share and job growth in 2025 relative to the 2022–23 average, which controls for pre-existing sectoral trends._ The dots below the zero line show that job growth in almost all sectors in 2025 has been lower than in 2022–23, which reflects both the strong post-pandemic recovery in those earlier years and the recent broad slowdown in hiring, the latter of which can be attributed to several factors beyond tariffs, as previously discussed. The solid blue line highlights the relationship between relative job growth and the import share, and the dashed lines show 1 standard error predictive bands. The blue line suggests that sectors more exposed to imports faced a greater decline in job growth, which we attribute to the direct tariff effect. Therefore, tariffs have likely reduced employment growth, though there is considerable uncertainty around the exact effect, and we cannot rule out that tariffs had no direct effect on employment growth._
Chart 1: Sectors more exposed to imports were subject to a larger decline in job growth
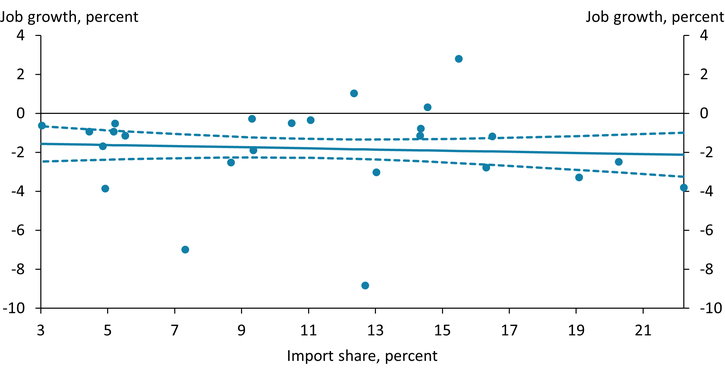
Notes: Chart plots employment growth in 2025 relative to 2022–23 average (annualized). Each dot represents one sector. The solid blue line plots the linear relationship between relative sectoral job growth and the import share of the sector. The blue dashed lines indicate 1 standard error predictive bands. The import shares are calculated based on 2024 input-output tables and merged with sectoral Current Employment Statistics.
Sources: U.S. Bureau of Labor Statistics (Haver Analytics), Organisation for Economic Co-operation and Development, and authors’ calculations.
Chart 2 quantifies how many more jobs might have been added to the economy absent direct tariff effects. The green bar shows that the economy could have added 19,000 more jobs each month, on average, from January through August 2025, without the direct tariff effects, though there is again considerable uncertainty around this estimate, as indicated by the black lines._ Focusing on the average effect, this figure suggests that, holding the size of the labor force constant, tariffs may also have raised the unemployment rate by 0.1 percentage points.
Chart 2: Average monthly job growth could be 19,000 higher without direct tariff effects
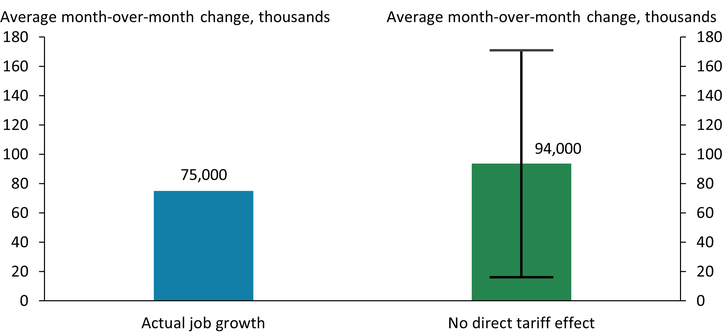
Notes: Average monthly job growth is calculated from January through August 2025, excluding preliminary benchmark revisions. The upper and lower bounds of the black line indicate 1 standard error bands around the mean estimate.
Sources: U.S. Bureau of Labor Statistics (Haver Analytics) and authors’ calculations.
Overall, our findings suggest that—at least thus far—domestic firms might have added fewer jobs in response to tariffs, similar to the employment effects of the 2018 tariffs (Flaaen and Pierce 2024, Javorcik and others 2025).
Endnotes
-
1 The following sectors are included in the analysis, with the import share in parentheses: Motor Vehicles & Parts (22.2), Electrical Equipment & Appliances (20.3), Machinery (19.1), Primary Metals (16.5), Computer & Electronic Products (16.3), Textiles (15.5), Chemicals including Pharmaceuticals (14.6), Repair & Maintenance (14.3), Fabricated Metal Products (14.3), Construction (13.0), Mining (12.7), Plastics & Rubber Products (12.4), Wood Products (11.1), Printing & Related Support Activities (10.5), Utilities (9.3), Nonmetallic Mineral Products (9.3), Food Products, Beverages and Tobacco (8.7), Other Transport Equipment (7.3), Education & Health Services (5.5), Transportation & Warehousing Services (5.2), Information Services (5.2), Accommodation & Food Services (4.9), Professional & Business Services (4.9), Wholesale and Retail Trade (4.4), and Financial Services (3.0).
-
2 The job numbers exclude the recent preliminary benchmark revisions. The final benchmark revision will be incorporated into official estimates with the publication of the January 2026 Employment Situation news release in February 2026. The relationship between job growth and the import share is not weighted by sectoral employment. Weighting by employment leads to a more negative and statistically significant relationship between job growth and the import share.
-
3 To construct the estimate in Chart 2, we first assume that the negative relationship between the import share and the relative employment growth in Chart 1 is due to tariffs and construct a sector-specific and tariff-related job growth gap equal to the difference between the solid line and the hypothetical relative decline job growth when the import share equals zero. We then add this gap to the sectoral job growth rates and aggregate across sectors. To obtain confidence bands, we repeat the previous steps for the upper and lower bound of the predictive interval instead of the solid line.
Article Citation
Matschke, Johannes, and Mariia Dzholos. 2025. "Higher Tariffs Might Have Created Headwinds to Employment Growth in 2025." Federal Reserve Bank of Kansas City, Economic Bulletin, December 12.
References
Bangert-Drowns, Christopher. 2025. “External LinkTariffs Impact U.S. Industries Differently, with Manufacturing the Most Exposed.” Washington Center for Equitable Growth, July 29.
Flaaen, Aaron, and Justin Pierce. 2024. “External LinkDisentangling the Effects of the 2018–2019 Tariffs on a Globally Connected U.S. Manufacturing Sector.” Review of Economics and Statistics, September 16.
Javorcik, Beata, Benjamin Kett, Katherine Stapleton, and Layla O’Kane. 2025. “External LinkDid the 2018 Trade War Improve Job Opportunities for U.S. Workers?” Journal of International Economics, vol. 158, no. 104125.
Rodríguez-Clare, Andrés, Mauricio Ulate, and Jose P. Vasquez. 2025. “External LinkThe 2025 Trade War: Dynamic Impacts Across U.S. States and the Global Economy.” Federal Reserve Bank of San Francisco, working paper no. 2025-09, May.
Johannes Matschke is a senior economist at the Federal Reserve Bank of Kansas City. Mariia Dzholos is a research associate at the bank. The views expressed are those of the authors and do not necessarily reflect the positions of the Federal Reserve Bank of Kansas City or the Federal Reserve System.
Authors

Johannes Matschke
Senior Economist