The Russian-Ukraine war has substantially disrupted the supply of Russian oil and gas. In June, the European Union adopted oil sanctions that are expected to substantially curtail the flow of Russian oil into the region. Since late July, gas flows from Russia have declined sharply due to shutdowns and curtailments in the Nord Stream 1 pipeline, the largest pipeline between Russia and Germany. Moreover, the Nord Stream pipelines suffered damage from explosions in late September, forestalling any resumption of gas flows in the near future. Given the EU’s heavy dependence on Russian oil and gas, a natural question is how this reduction in Russian energy supply could affect output in the EU in general and in individual EU countries and sectors._
We use international input-output tables, which comprehensively capture the connections between Russian oil and gas and European production networks, to assess how sudden supply shortages in Russian oil and gas could affect the supply chain of various EU countries and industries._ Given the wide range of views regarding how much the Russian supply of oil and gas may decline this year, we estimate the potential effects under three different assumptions: a “small disruption,” in which the Russian oil and gas supply declines by 10 percent in 2022; a “medium disruption,” in which the supply declines by 20 percent; and a “large disruption,” in which the supply declines by 30 percent. The “medium disruption” reflects the current level of energy disruption while incorporating offsetting efforts by EU countries, such as filling reserves and turning to alternative sources of energy (see Deutsche Bundesbank 2022). This 20 percent reduction also corresponds to the middle of the range of disruptions explored in several recent studies (see, for example, Lan, Sher, and Zhou 2022). All three scenarios assume that the disruption is temporary and that the oil and gas supply from Russia returns to pre-war levels after one year.
Chart 1 shows that EU output declines much more severely as the disruption to the Russian oil and gas supply increases. For example, under the small disruption scenario (orange line), EU output declines by only 0.4 percent in 2023. However, this decline grows nearly tenfold under the medium disruption scenario (green line) to 3.3 percent. One possible explanation for this outsized effect is that existing oil and gas inventories in EU countries can offset only a small portion of a reduction in Russian oil supply, leading larger disruptions to show up fully in production and output. The chart also shows that it takes time for EU countries to fully absorb these negative effects: indeed, under the medium and large disruption scenarios, EU output continues to decline in 2024, two years after the initial shock.
Chart 1: EU output declines more steeply as disruption to Russian energy supply grows
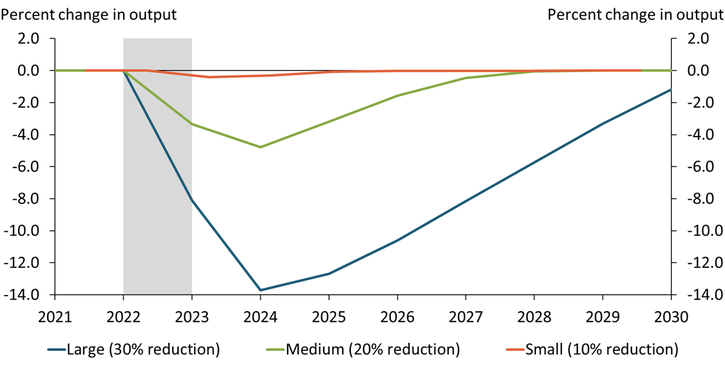
Note: Gray shaded region indicates the period of disruption to the supply of Russian oil and gas.
Source: Authors’ calculations.
These effects on output differ significantly across EU countries based on their relative dependency on Russian energy and whether they consume Russian oil and gas directly or indirectly (for example, through refined products such as gasoline). Chart 2 shows the estimated output decline for selected EU economies under the medium disruption scenario. Although Germany (green line) experiences a 2.5 percent reduction in output, Bulgaria (light green line), which is more singularly dependent on Russia for energy, experiences a much larger reduction of over 10 percent. The timing of these reductions also varies by country. In Germany, a country that consumes large amounts of Russian oil and gas directly, output declines only during the supply disruption (shaded gray region) and begins to recover once the disruption has ended. However, in France (purple line) and the UK (orange line)—countries that are more likely to consume Russian oil and gas indirectly—output continues to decline after the supply disruption and does not begin to recover until one year after the disruption has ended.
Chart 2: Countries that indirectly consume Russian energy respond more slowly to a supply disruption
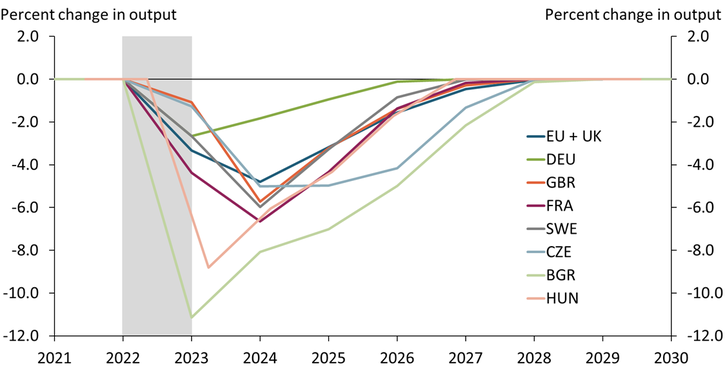
Note: Chart shows response under a medium disruption scenario of a 20 percent decline in Russian energy supply.
Source: Authors’ calculations.
The effects on output may also vary across industries within the same economy. Chart 3 shows how the medium disruption scenario affects output in key economic sectors in Germany. Services (orange line) appear to be hit the hardest, followed by manufacturing (blue line). In contrast, the supply disruption appears to have little effect on the agriculture sector (green line). Two factors may explain these differences: a sector’s reliance on oil and gas and its typical inventory levels. Generally, sectors that maintain larger inventories are better able to compensate for temporary supply disruptions. Our model assumes that the services sector maintains the lowest inventory levels, while manufacturing and agriculture maintain larger inventory levels.
Chart 3: In Germany, supply disruptions affect output in services most, followed by manufacturing

Note: Chart shows response under a medium disruption scenario of a 20 percent decline in Russian energy supply.
Source: Authors’ calculations.
Although our analysis primarily focuses on European countries, which rely on Russian oil and gas more than other countries, our model can also estimate the effects of a decline in Russian oil and gas supply on other regions. Chart 4 compares how the medium disruption scenario affects output in Europe (defined as the sum of the EU and UK, blue line) with the rest of the world (green line). While aggregate production in the EU and UK declines by about 5 percent over the course of two years, the effect on the rest of the world is much smaller—only about 1.5 percent. Moreover, the effect on the rest of the world occurs one year after the supply disruption, suggesting disruptions to the Russian oil and gas supply affect the rest of the world more indirectly. Overall, the results from our model suggest that disruptions to Russian oil and gas will have a much greater effect on output in the EU than the rest of the world; however, the size of this effect will depend on the severity of the disruption and is likely to vary across EU countries and sectors.
Chart 4: Supply disruptions affect output in the EU more than output in the rest of the world
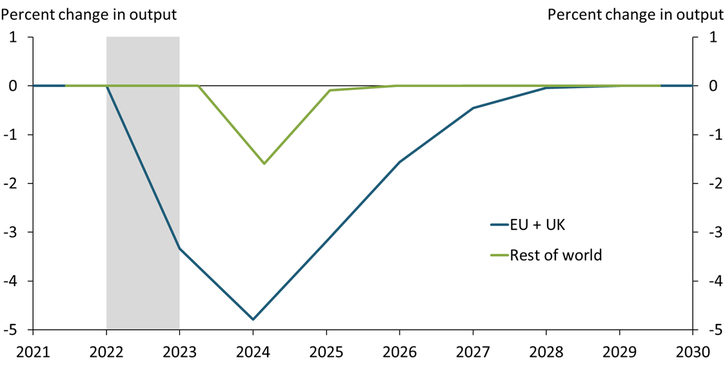
Note: Chart shows response under a medium disruption scenario of a 20 percent decline in Russian energy supply.
Source: Authors’ calculations.
Endnotes
-
1 For our analysis, we include the UK as part of the EU because the UK has followed the EU and United States in its implementation of sanctions against Russia.
-
2 Specifically, we use the 2021 OECD Inter-Country Input-Output Tables to construct a Leontief input-output model that captures supply shock propagation through European production networks. Our model is structured similarly to models described in Pichler and others (2021) and Inoue and Todo (2019), but also reflects international supply chains in the EU and UK. Unlike other analyses that study this issue (Schnittker 2022; Lan, Sher, and Zhou 2022; Bachmann and others 2022), our model focuses primarily on supply-chain consequences based on production connections at the industry level across countries.
References
Bachmann, Rüdiger, David Baqaee, Christian Bayer, Moritz Kuhn, Andreas Löschel, Benjamin Moll, Andreas Peichl, Karen Pittel, and Moritz Schularick. 2022. “External LinkWhat If? The Economic Effects for Germany of a Stop of Energy Imports from Russia.” EconPol Policy Report, vol. 6, no. 36, March 7.
Deutsche Bundesbank. 2022. “Outlook for the German Economy for 2022 to 2024.” Deutsche Bundesbank Monthly Report, June, pp. 23–24.
Inoue, Hiroyasu, and Yasuyuki Todo. 2019. “External LinkFirm-Level Propagation of Shocks through Supply-Chain Networks.” Nature Sustainability, vol. 2, no. 9, pp. 841–847.
Lan, Ting, Galen Sher, and Jing Zhou. 2022. “External LinkThe Economic Impacts on Germany of a Potential Russian Gas Shutoff.” IMF Working Papers, vol. 2022, no. 144.
Pichler, Anton, Marco Pangallo, R. Maria del Rio-Chanona, François Lafond, and J. Doyne Farmer. 2021. “External LinkIn and Out of Lockdown: Propagation of Supply and Demand Shocks in a Dynamic Input-Output Model.” SSRN, February 19.
Schnittker, Christian. 2022. “The Impact of Gas Shortages on the European Economy.” Goldman Sachs Economics Research, March 7.
Thomas R. Cook is a data scientist at the Federal Reserve Bank of Kansas City. Amaze Lusompa is an economist at the bank, and Jun Nie is a senior economist at the bank. The views expressed are those of the authors and do not necessarily reflect the positions of the Federal Reserve Bank of Kansas City or the Federal Reserve System.
Authors

Thomas R. Cook
Data Scientist