After a decade of relatively subdued productivity growth in the 2010s, U.S. output per hour, a measure of labor productivity, has strengthened since 2022, renewing interest in whether the economy is entering a more durable higher-productivity chapter (Çakır Melek and Gallin 2024). Chart 1 shows that labor productivity has remained above its pre-pandemic trend (dashed blue line) and has risen further above that baseline since late 2022 (dashed purple line). The clear upward climb from 2022:Q3 to 2025:Q2 (purple area) coincides with the commercial emergence of widely used generative AI tools. Notably, this period looks less like a continuation of the 2010s and more like the start of a period of stronger productivity growth._
Chart 1: Labor productivity has moved farther above its pre-pandemic trend since late 2022
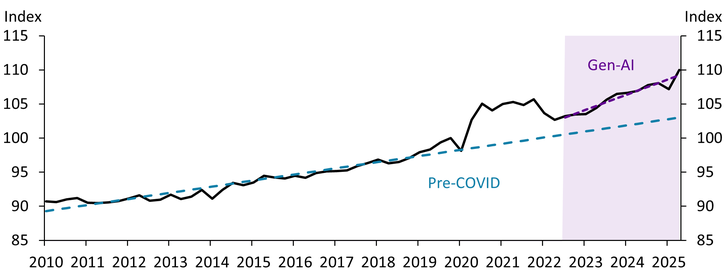
Notes: The solid line shows output per hour in the private nonfarm business sector, indexed to 2019:Q4 = 100. Trends are fitted over 2010:Q1–2019:Q4 (pre-pandemic) and 2022:Q3–2025:Q2 (gen-AI).
Sources: Federal Reserve Bank of Chicago and authors’ calculations.
A sustained pickup in productivity growth could support faster noninflationary expansion. To assess whether gen-AI could be ushering in a new chapter for labor productivity, we examine whether the pickup is broad-based across industries and whether cross-industry patterns line up with AI adoption. We then ask whether AI adoption helps explain which industries drove the aggregate pickup. Specifically, we combine the Chicago Fed’s quarterly industry-level labor productivity data (QILP) with the U.S. Census Bureau’s Business Trends and Outlook Survey (BTOS) measure of the share of firms reporting they use AI.
Aggregate labor productivity can rise because many industries improve together, or because gains are initially concentrated in a smaller set of industries—something that often occurs early in major technology diffusion episodes. To disentangle these narratives, we decompose aggregate labor productivity growth into industry contributions, which combine an industry’s productivity growth rate and its value-added share (Hobijn and others 2025).
Panel A of Chart 2 compares industries’ average annual contributions to aggregate labor productivity growth in the pre-pandemic era (2010:Q1–2019:Q4) versus the gen-AI era (2022:Q3–2025:Q2). The picture is uneven: A few industries account for most gains in both eras, while several contribute little or even switch from positive to negative contributions across eras (such as wholesale trade). However, two patterns stand out. First, the top four contributors in the gen-AI era—retail trade, information, professional/scientific/technical services (PSTS), and real estate/rental/leasing—also led contributions in the pre-pandemic era, but their contributions nearly doubled on average. Second, several industries, such as mining and nondurable goods, shifted from small or negative contributions in the pre-pandemic era to meaningful positive contributions in the gen-AI era.
Chart 2: Industry contributions to productivity growth have increased but are driven by a smaller set of industries
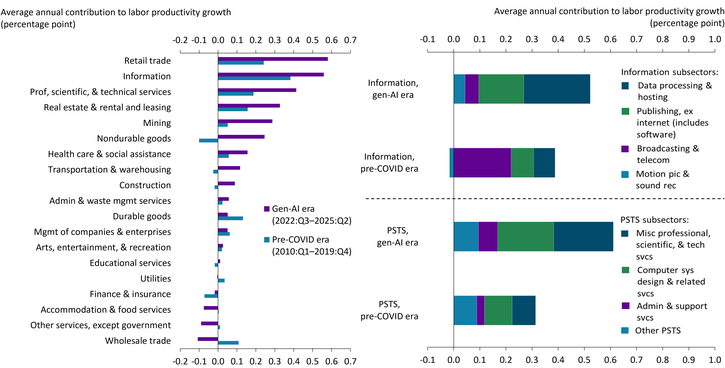
Notes: “PSTS” denotes professional, scientific, and technical services. “Data processing and hosting” denotes data processing, internet publishing, and other information services. “Other PSTS” combines legal services and management of companies and enterprises.
Sources: Federal Reserve Bank of Chicago and authors’ calculations.
Panel B of Chart 2 zooms in on two sectors that have made major contributions to labor productivity in the gen-AI era: information and PSTS. These sectors are not monoliths. Within the information sector, productivity contributions shifted away from broadcasting/telecommunications and toward data processing/hosting and publishing. Within PSTS, gains have been concentrated in computer systems design and miscellaneous professional services. Overall, the gains appear driven by specific slices of information services and business-facing professional activities, rather than being evenly spread across the entire sector.
To assess breadth more systematically, we follow Hobijn and others (2025) in ranking detailed industries from lowest to highest contributors and cumulate contributions over their cumulative value-added share. Chart 3 plots the resulting curves for the pre-pandemic era (blue line) and gen-AI era (purple line)._
Chart 3: The post-2022 pickup in productivity growth is larger but less broad-based across industries
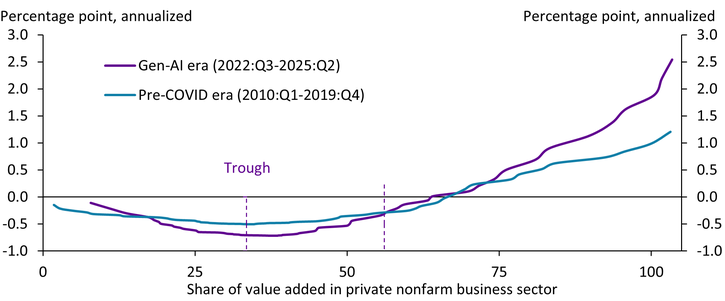
Sources: Federal Reserve Bank of Chicago, Hobijn and others (2025), and authors’ calculations.
If productivity gains were broadly shared across industries, the curve would rise more smoothly. Chart 3 shows gains in the gen-AI era are more concentrated than the pre-pandemic era: The purple curve stays below zero for much of the distribution and then climbs sharply near the right tail. The curve does not turn positive until roughly 64 percent of the economy’s value added is included, implying that a relatively small set of high-contributing industries has driven most of the net pickup. Despite being less broad-based, the overall pickup is larger: The gen-AI era endpoint is about 2.5 percentage points (annualized), more than double the 1.2 percentage point endpoint in the pre-pandemic era. Whether this pickup is fragile or sustainable may depend on whether the pickup remains confined to a narrow set of industries or whether it simply reflects early diffusion, with gains appearing first among early adopters and broadening over time—echoing the early phases of the IT era (Brynjolfsson, Rock, and Syverson 2021; Fernald and Wang 2015).
Chart 4: Higher AI adoption aligns with faster productivity growth, but explains only a small share of the aggregate shift
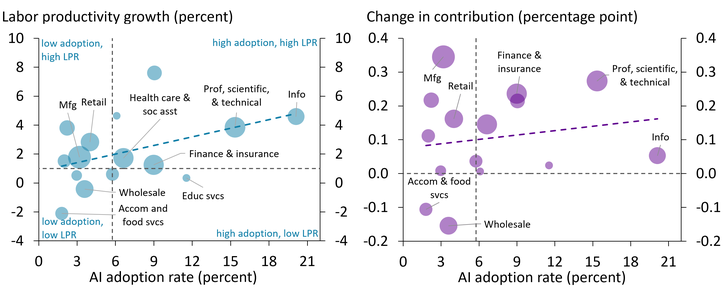
Notes: Panel A shows annualized labor productivity growth by industry in the 2023:Q4–2025:Q2 period; Panel B shows the change in industry contributions to aggregate labor productivity growth relative to the 2010:Q1–2019:Q4 period. Bubble size represents average value-added share in the 2023:Q4–2025:Q2 period. Fitted lines: Panel A, y = 0.1986x + 0.8029 (R-squared = 0.1905); Panel B, y = 0.0043x + 0.0754 (R-squared = 0.0267).
Sources: U.S. Census Bureau, Federal Reserve Bank of Chicago, and authors’ calculations.
To help answer this question, Panel A of Chart 4 first illustrates industries’ AI adoption rate along with their labor productivity growth. The fitted relationship is significant and slopes upward: Higher-adoption industries tend to have faster productivity growth, consistent with AI contributing to the post-2022 productivity pickup, alongside other forces._ Panel B then asks whether AI adoption helps explain which industries drove the aggregate pickup—and shows the relationship is weak. High-adoption industries are not always the ones with the largest increases in contributions to aggregate productivity growth. For example, manufacturing’s contribution has risen more than information’s despite lower reported AI use. This weaker relationship highlights that contributions to productivity depend on both growth and industry size and can also reflect sector-specific dynamics or measurement effects. Overall, AI appears linked to within-industry gains, but its aggregate footprint is still limited, consistent with adoption still spreading across industries.
Labor productivity has moved notably above its pre-pandemic trend, but the pickup is not yet broad-based: A smaller share of industries accounts for most of the net gain, even as cumulative contributions have more than doubled. Does this pickup reflect a durable increase due to the adoption of gen-AI? We find that although AI adoption aligns with faster productivity growth across industries, it explains little of the aggregate gain in productivity. Whether the pickup can be sustained depends on whether productivity gains broaden and endure enough to support faster noninflationary growth, or remain concentrated among a small set of industries. The larger pickup and the positive AI adoption-growth link point to upside potential as adoption spreads, but the cross-industry pattern suggests diffusion is still incomplete.
Endnotes
-
1 BLS data show nonfarm business labor productivity accelerated in 2025:Q3 relative to 2025:Q2, suggesting the post-2022 pickup continued. This Bulletin uses QILP, a quarterly, industry-level output-per-hour dataset produced by the Federal Reserve Bank of Chicago, aligned to BEA GDP-by-industry classifications and running through 2025:Q2 (Hobijn and others 2025).
-
2 In Chart 3, value-added shares may not sum exactly to 100 due to industry coverage differences and rounding in the underlying dataset.
-
3 The fit is moderate (R2 = 0.19). The relationship is suggestive rather than definitive: Causality can run both ways, and other factors may move with adoption.
Article Citation
Çakır Melek, Nida, and Sydney Miller. 2026. “A New U.S. Productivity Chapter? What Industry Data Say About AI.” Federal Reserve Bank of Kansas City, Economic Bulletin, February 11.
References
Brynjolfsson, Erik, Daniel Rock, and Chad Syverson. 2021. “External LinkThe Productivity J-Curve: How Intangibles Complement General Purpose Technologies.” American Economic Journal: Macroeconomics, vol. 13, no. 1, pp. 333–372.
Çakır Melek, Nida, and Alex Gallin. 2024. “The Future of U.S. Productivity: Cautious Optimism amid Uncertainty.” Federal Reserve Bank of Kansas City, Economic Review, vol. 109, no. 9.
Fernald, John, and Bing Wang. 2015. “External LinkThe Recent Rise and Fall of Rapid Productivity Growth.” Federal Reserve Bank of San Francisco, FRBSF Economic Letter no. 2015-04, February 9.
Hobijn, Bart, Martí Mestieri, Nicolas Werquin, and Jing Zhang. 2025. “External LinkQuarterly Industry-Level Labor Productivity Data for the U.S.” Federal Reserve Bank of Chicago, Economic Perspectives, no. 1, January.
Nida Çakır Melek is a senior economist at the Federal Reserve Bank of Kansas City. Sydney Miller is a research associate at the bank. The views expressed are those of the authors and do not necessarily reflect the positions of the Federal Reserve Bank of Kansas City or the Federal Reserve System.
Authors

Nida Çakır Melek
Senior Economist
