Movements in gasoline prices have long been associated with changes in household inflation expectations. Gasoline is a highly visible and frequently purchased good, making it a natural reference point for consumers assessing broader price pressures._ Over much of the past four decades, periods of rising gasoline prices have coincided with increases in short-term inflation expectations; similarly, declines at the pump have been accompanied by easing inflation expectations. Recent data, however, suggest this relationship weakened markedly and actually reversed in 2025.
Chart 1 reports the correlation between average gasoline prices and one-year-ahead inflation expectations across individual decades. The relationship strengthened notably in the decade following the Great Recession, with correlations rising close to 0.8 during the 2015–24 period. During this decade, movements in gasoline prices and inflation expectations tended to align closely. In 2025, that relationship broke down. The correlation turned negative, indicating that inflation expectations increased even as gasoline prices softened. This reversal of a pattern observed over several previous decades points to a change in the signals households used to form their inflation expectations.
Chart 1: Correlation between gasoline prices and inflation expectations diminished in 2025

Notes: Monthly inflation expectations are measured as what consumers expect inflation to be one year ahead according to the University of Michigan survey. Gasoline prices are the average wholesale price in each month.
Sources: Wall Street Journal and University of Michigan (both accessed through Haver Analytics).
To put this recent shift into a broader context, Chart 2 shows the relationship between monthly gasoline prices and one-year-ahead inflation expectations using monthly data from 1985 to 2024. Historically, higher gasoline prices have been associated with higher expected inflation, as evidenced by the upward-sloping relationship (dotted line). Importantly, this chart provides a historical benchmark for how inflation expectations would be expected to move, on average, given changes in gasoline prices. Gasoline prices were 10 cents lower at the end of 2025 than at the beginning of the year. If the historical relationship between gasoline prices and inflation expectations shown in Chart 2 had held, one-year-ahead inflation expectations would be expected to fall by 0.03 percentage points.
Chart 2: Historical relationship between gasoline prices and inflation expectations, 1985 to 2024

Notes: Monthly inflation expectations are measured as what consumers expect inflation to be one year ahead according to the University of Michigan survey. Gasoline prices are the average wholesale price in each month. The dotted trend line is an estimation of the linear relationship between gasoline prices and expected inflation.
Sources: Wall Street Journal and University of Michigan (both accessed through Haver Analytics).
However, inflation expectations did not fall but instead increased, suggesting this historical relationship has broken down. Chart 3 compares recent movements in gasoline prices and inflation expectations. The dotted purple line represents the counterfactual path of inflation expectations had they continued to respond to gasoline prices based on the historical relationship shown in Chart 2. Instead, observed inflation expectations in 2025 (solid purple line) remained well above this implied path. Averaged across each month in 2025, actual inflation expectations were 1.5 percentage points higher than their counterfactual level. Even as gasoline prices drifted lower, expectations stayed elevated and volatile, indicating that households were responding to factors beyond energy prices alone.
Chart 3: Gasoline prices and inflation expectations recently diverged from historical relationship
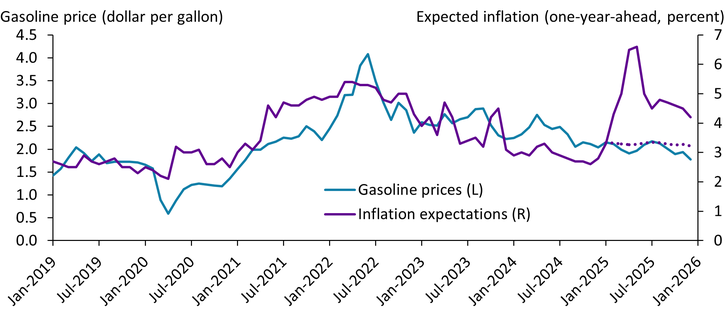
Notes: Monthly inflation expectations are measured as what consumers expect inflation to be one year ahead according to the University of Michigan survey. Gasoline prices are the average wholesale price in each month. The dotted purple line is a counterfactual measure of expected inflation if the historical relationship with gasoline prices held during 2025.
Sources: Wall Street Journal and University of Michigan (both accessed through Haver Analytics).
Survey evidence suggests that trade policy and tariff concerns played a central role in shaping inflation expectations in 2025. Respondents to the University of Michigan’s Surveys of Consumers explicitly cited tariffs and the broader trade environment as reasons for elevated inflation expectations, even as gasoline prices declined (Reuters 2025). The Michigan survey’s June 2025 release noted that while tariff fears had softened somewhat, expectations remained elevated relative to late 2024, with tariffs continuing to be viewed as an upside risk to inflation (University of Michigan 2025).
Tariff risk differs from gasoline price movements in ways that can weaken their historical link to inflation expectations. Unlike energy prices, tariffs are perceived to affect a broad set of goods rather than a single category of spending. They are also viewed as policy-driven and potentially persistent, introducing uncertainty about future costs across supply chains. Finally, heightened media attention to trade policy may cause households to overweight tariffs relative to gasoline prices when forming expectations about future inflation. Indeed, Bloomberg reported that increases in consumer inflation expectations coincided with heightened discussion of tariffs and their potential pass-through to consumer prices (Rovella 2025).
The 2025 break in the relationship between gasoline prices and inflation expectations highlights that energy prices are not always a dominant signal shaping household inflation expectations. When consumers perceive broader sources of price pressure—such as tariffs—expectations can remain elevated even as energy prices decline.
Endnotes
-
1 Several papers have provided consumer-level and macro evidence of the role gasoline prices play in the forming of inflation expectations. See, for example, Coibion and Gorodnichenko (2015), Binder (2018), Kilian and Zhou (2022), and Jo and Klopack (2025).
Article Citation
Brown, Jason P. 2026. “A Break in the Link Between Gasoline Prices and Inflation Expectations.” Federal Reserve Bank of Kansas City, Economic Bulletin, February 20.
References
Binder, Carola Conces. 2018. “External LinkInflation Expectations and the Price at the Pump.” Journal of Macroeconomics, vol. 58, pp. 1–18.
Coibion, Olivier, and Yuriy Gorodnichenko. 2015. “External LinkIs the Phillips Curve Alive and Well After All? Inflation Expectations and the Missing Disinflation.” American Economic Journal: Macroeconomics, vol. 7, no. 1, pp. 197–232.
Jo, Yoon Joo, and Ben Klopack. 2025. “External LinkFueling Expectations: The Causal Impact of Gas Prices.” Journal of Monetary Economics, vol. 153, July.
Kilian, Lutz, and Xiaoqing Zhou. 2022. “External LinkOil Prices, Gasoline Prices, and Inflation Expectations.” Journal of Applied Econometrics, vol. 37, no. 5, pp. 867–881.
Reuters. 2025. “External LinkU.S. Consumer Sentiment Drops as Inflation Expectations Surge.” February 7.
Rovella, David. 2025. “External LinkU.S. Consumer Inflation Expectations Spike to a 30-Year High.” Bloomberg News, February 21.
University of Michigan Institute for Social Research. 2025. “External LinkConsumer Sentiment Drops as Inflation Worries Escalate.” Surveys of Consumers news release, February 2025.
Jason P. Brown is a vice president and economist at the Federal Reserve Bank of Kansas City. The views expressed are those of the author and do not necessarily reflect the positions of the Federal Reserve Bank of Kansas City or the Federal Reserve System.
Author