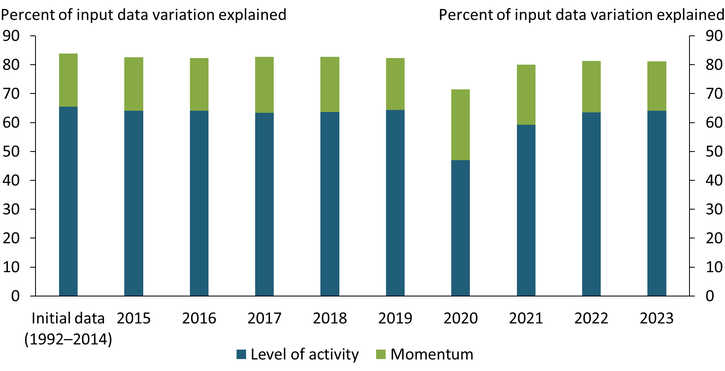
Notes: Chart shows how much of the variance in the LMCI input data is explained by the level of activity and how much by the momentum series. As a baseline, we calculate the explained variance from 1992 to 2014, the period used for the LMCI’s first release. We then add each subsequent year of data to this baseline dataset separately and re-calculate the explained variance. For instance, to calculate the explained variance for 2023, we use data from January 1992 to December 2014 and January 2023 to December 2023, omitting the years in between.
Sources: Federal Reserve Bank of Kansas City and authors’ calculations.
The Kansas City Fed’s Labor Market Conditions Indicators (LMCI) summarize the information of 24 labor market variables into two measures: the level of activity and momentum. Typically, these two indicators explain about 80 percent of the variation in their input series, reflecting the well-defined and stable relationships between labor market variables. During the pandemic, these relationships were disrupted and the LMCI’s explanatory power dropped. However, by 2021 the percent of variation explained by the LMCI recovered, suggesting the labor market variables tracked by the LMCI are now behaving much as they were prior to the pandemic (albeit at much tighter levels).
See more research from Charting the Economy.