Colorado’s unemployment rate surpassed the U.S. over much of the past year, something that only occurred one other time in the last fifty years. The state’s most recent rise in unemployment was driven by a downturn in a couple key industries, technology and construction. While the state’s unemployment rate has been declining for several months, a sign of improvement, local conditions remain soft relative to the U.S. labor market. This Rocky Mountain Economist investigates the key sectoral drivers behind Colorado’s relatively higher unemployment rate and some of the structural factors underpinning the state’s labor market. Colorado benefits from a mobile, highly engaged, and educated labor force, poising the local labor market for improvement if conditions were to strengthen in the sectors currently facing headwinds.
Colorado unemployment rose higher than the U.S.
Colorado’s unemployment rate surpassed the national average by a notable margin in recent quarters, which hasn’t occurred since the late 1980’s (Chart 1). Starting in early 2024, Colorado’s unemployment rate (blue) ticked above the national average (purple). Colorado’s unemployment rate historically remained below the U.S. – averaging 5.2 percent since the 1970’s compared to 6.1 percent for the U.S. – and the state’s unemployment rate only persistently exceeded the national average one other time in the last half century.i In the late 1980’s (1986 -1989), Colorado’s economy was hit hard by an oil price downturn at a time when state employment was more highly concentrated in the oil and gas industry. Notably, that heightened unemployment episode in Colorado occurred outside of a recession (grey bars) when the U.S. economy was growing at a healthy pace.
Chart 1: Colorado’s Unemployment rate was persistently higher than the U.S. for the second time in the last 50 years.
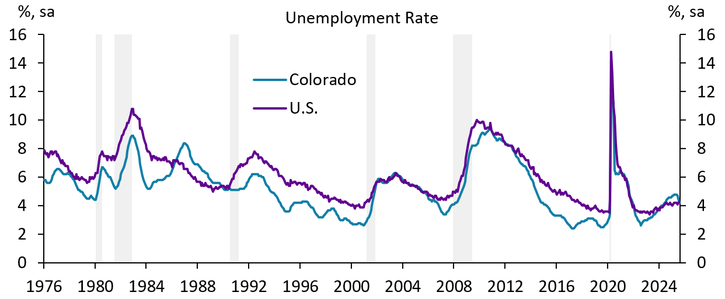
Notes: Gray bars indicate recession periods.
Source: Bureau of Labor Statistics, Haver Analytics
Higher state joblessness is driven by weakness in certain industries
Like the 1980’s, the recent episode of heightened unemployment (2024 to present) is also marked by a downturn in key industries where Colorado is more concentrated. Colorado’s relatively higher unemployment rate was driven primarily by a downturn in the technology and construction industries. Unemployment insurance claims in these sectors rose meaningfully in Colorado over the last several years, causing softer labor market conditions in the state compared to the U.S. (Chart 2 – Panels A and B). Technology-related unemployment insurance claims in the state were up over 62 percent in 2025 relative to their 2017-19 average and construction claims rose 42 percent. Over the same period, the U.S. saw a more modest rise of 19 percent for technology and a decline in construction related claims (Department of Labor).
Colorado is more concentrated in technology and construction employment compared to the U.S., making the state’s economy more susceptible to a decline in those industries. Colorado’s technology industry made up 12.5 percent of employment on average from 2022 to 2024 compared to 8.8 percent in the U.S. The tech industry started facing headwinds in late 2022, coinciding closely with softening labor conditions in the state (Greene et al. 2023; BLS 2025a). Similarly, Colorado has 6.3 percent of state employment in construction compared to 5.1 percent for the U.S. (BLS 2025a). Recent declines in residential and commercial development activity put Colorado’s construction industry in the doldrums. Overall, Colorado’s economy has been harder hit by these select industries (i.e., technology and construction) where it is more concentrated, weighing on labor conditions.
Chart 2: Technology and construction industries contributed most to Colorado unemployment claims.
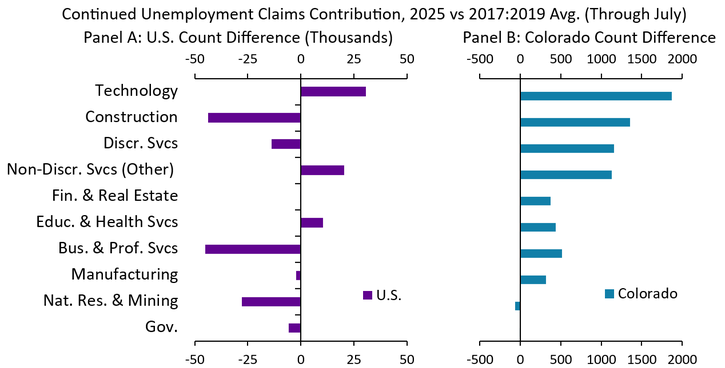
Source: Department of Labor, Haver Analytics, Staff Calculations
Notes: The technology industry combines two North American Industry Classification (NAICS) industries that have a high concentration of technology workers: Information (51) and Professional, Scientific, and Technical Services (54). The other industry categories on this chart are the following NAICS codes: Construction (23), Discretionary Services (44-45, 71-72), Non-Discretionary Services (Other) (22, 42, 48-49, 81), Finance & Real State (52, 53), Education & Health Services (61, 62), Business and Professional Services (55-56), Manufacturing (31-33), Natural Resources & Mining (11, 21), and Government (92). We use the 2017-2019 average as a baseline for comparing current labor markets, as that period was marked by a strong labor market, moderate growth, and stable economic conditions.
Higher unemployment and softer labor conditions
Higher unemployment and waning labor demand in Colorado contributed to softer overall labor market conditions in the state compared to the U.S. The ratio of the number of job vacancies (labeled V) to the number of unemployed (labeled U) is a measure of labor market tightness commonly reported as V/U. As an indicator of the relative slack in the labor market compared to the U.S., the V/U ratio in Colorado (blue) dipped below the national average (purple) in late 2024 (Chart 3). Historically, the V/U ratio for Colorado is higher than the national average, indicating that Colorado typically has a tighter labor market than the nation.
While the years following the pandemic were marked by historically tight labor conditions (high V/U) both in Colorado and in the U.S., labor market tightness relaxed during the last couple years (lower V/U). The unemployment rate in Colorado trended downward in recent months (Chart 1) – a sign of improving labor market conditions – but the V/U ratio continued moving lower (Chart 3), signaling slackening labor conditions. Job openings in Colorado fell by roughly 13 percent this year (through July) compared to a roughly four percent decline for the U.S., suggesting softer labor demand in the state compared to the nation (BLS 2025b). This atypical decline in Colorado’s V/U ratio below the national average indicates the state now has more slack labor conditions than the nation and unemployed workers may face greater difficulty in finding employment locally than in years past.
Chart 3: Labor markets softer in Colorado relative to the U.S.
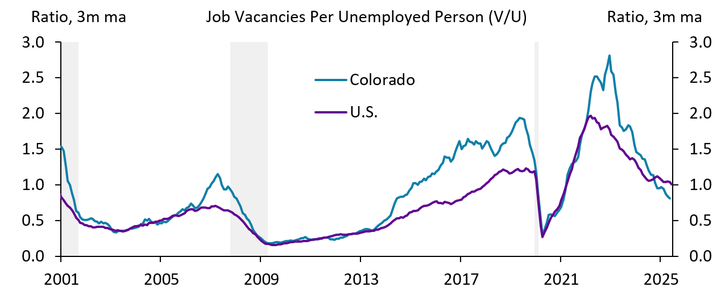
Notes: Smoothed using a 3-month moving average. Gray bars indicate recession periods.
Source: Bureau of Labor Statistics, Haver Analytics, Staff Calculations
Labor market attachment and broader context
While industry-specific job losses contributed to Colorado’s recent rise in unemployment, it is important to place the state’s current conditions in the context of several strong features of its labor market structure. Colorado has a growing, highly engaged, and educated labor force. Colorado’s labor force grew by roughly 12 percent since 2017 compared to roughly seven percent for the U.S. over the same period (Chart 4), an indicator of growing labor capacity and a contributing factor to economic growth in recent years. The growing labor force is largely driven by historically positive net-migration, adding skilled employees to the state’s workforce (Colorado Demography Office; Felix 2018). Additionally, Colorado has a significantly higher labor force participation rate than the national average – 67.7 percent for Colorado compared to 62.4 percent for the U.S. in 2025 (BLS 2025c). This means the state has a higher fraction of state population working or actively seeking work. The state typically has fewer discouraged workers – those who are not employed and not actively looking for work – than the national average, contributing to the state’s high labor force participation (BLS 2025d). Lastly, Colorado’s workforce has above average education attainment, raising the skill level of workers in the state (Census 2024). Not only does Colorado have growing labor capacity, but also a highly engaged and skilled labor force.
Chart 4: Labor force size grew faster in Colorado than the U.S.
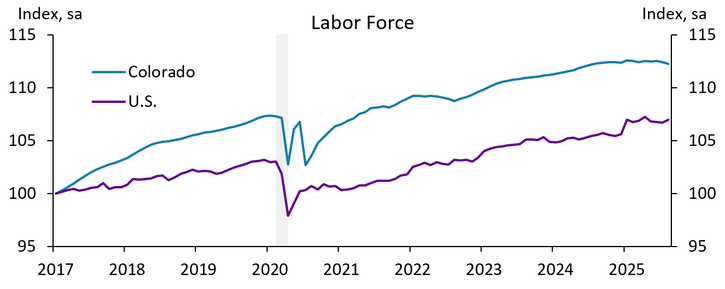
Notes: Gray bars indicate recession periods.
Source: Bureau of Labor Statistics, Haver Analytics, Staff Calculations
Conclusion
Colorado’s unemployment rate surpassed the U.S. in the last year, which only happened one other time in the last 50 years. Recent weakness in Colorado’s labor market can be attributed to a downturn in the technology and construction industries. While Colorado’s unemployment rate is trending downward in recent months, the state continues to face softer labor conditions than the national average. Despite relatively soft labor market conditions, Colorado’s highly engaged labor force may place the state at a longer-term advantage, positioning the state for growth if economic conditions in the challenged sectors of Colorado’s economy were to improve.
____________________
i While there were a few episodes over the last 50 years where Colorado’s unemployment rate intermittently moved above the national average for several months, the 1980’s downturn was the only other period when the unemployment rate in Colorado persistently exceeded the nation by more than 30 basis points.
References
Bureau of Labor Statistics (BLS). 2025a. External LinkState and Metro Area Employment, Hours, & Earnings; Current Employment Statistics (CES) program.
Bureau of Labor Statistics (BLS). 2025b. External LinkJob Openings and Labor Turnover Survey.
Bureau of Labor Statistics (BLS). 2025c. External LinkCurrent Population Survey (CPS).
Bureau of Labor Statistics (BLS). 2025d. External LinkLocal Area Unemployment Statistics (LAUS).
U.S. Census Bureau (Census). 2024. External LinkAmerican Community Survey 1-Year Estimates, S1501 Educational Attainment.
Colorado Demography Office. External LinkColorado Migration Flows: Migration Flows Dashboard.
Department of Labor. External LinkCharacteristics of Unemployment Insurance Claimants. 2025.
“Educational Attainment and Labor Market Outcomes in the Rocky Mountain States”. Felix, Alison. 2018. Federal Reserve Bank of Kansas City, Rocky Mountain Economist, June 28.
“Will Rocky Mountain Job Losses Be Worse Than When the Tech Bubble Burst?”. Greene, Bethany, David Rodziewicz and Nicholas Sly. 2023. Federal Reserve Bank of Kansas City, Rocky Mountain Economist, May 10.
The views expressed are those of the authors and do not necessarily reflect the positions of the Federal Reserve Bank of Kansas City or the Federal Reserve System.
Authors

Juan David Munoz Henao
Research Associate II