The External LinkInfrastructure, Investments and Jobs Act (IIJA), passed in November 2021, includes $65 billion to connect all Americans to high-speed broadband. Most of the funding will go directly to states and U.S. territories through the Broadband Equity, Access, and Deployment (BEAD) Program. To build broadband to areas that need it, state leaders need to know where those areas are. And where broadband is available, leaders must also understand why some residents don’t subscribe to it. Limited data make these seemingly simple tasks quite difficult. This report seeks to help address both challenges.
While this report is focused on Missouri, the same methodology could be used for any state or territory in the United States.
For a PDF version, click here.
A note about the increased need for speed
Internet speed is measured by how quickly data can be downloaded (think retrieving an email or watching an online tutorial) and how quickly data can be uploaded (sending a work email or uploading a classroom assignment). Internet speed is measured in megabits per second (Mbps).
The Federal Communications Commission (FCC) sets the minimum internet speed for what can be advertised as broadband. In 2010 the External LinkFCC’s broadband minimum was 4 Mbps “down” and 1 Mbps “up.” In 2015, the FCC raised the broadband minimum to 25 Mbps down and 3 Mbps up to meet the increased speed needed for newer internet uses. The current 25/3 is again insufficient for the demands of the average American household, which often has multiple devices connected, each running high-bandwidth programs. That’s why the BEAD program requires new projects to deliver at least 100 Mbps down and 20 Mbps up. This will ensure money spent on broadband today will meet future speed demands.
Methodology
In this report we map the following:
- Largest population clusters in Missouri where high-speed broadband is not available: Extending broadband service in these areas will reach more people per mile, which means more customers and revenue per dollar invested. Internet service providers (ISPs) that expand service here should become profitable faster with smaller government subsidies than in areas with lower population density.
To create this map, we combined responses from the 2019 American Community Survey (ACS) five-year estimates and the FCC’s 2019 Form 477 data. This shows census tracts where providers do not offer internet speeds of at least 100 Mbps down and 20 Mbps up. We include only tracts where at least 5,000 residents (not households) lack internet at these speeds. - Least densely populated parts of Missouri: Extending broadband service in these areas will reach fewer people per square mile. These residents still deserve affordable broadband, but it may cost more to reach them. The intent of this map is to identify which areas may be less profitable for ISPs and therefore may require larger government subsidies, alternative business models, or both. We use data from the 2020 ACS to identify census tracts with the lowest population densities.
- Areas where broadband is available, but people aren’t subscribed: This could be due to internet subscription cost, reliability of service, or a variety of other factors. It is also possible that broadband speed internet isn’t available here, External Linkdespite ISPs saying otherwise. We use the ACS 2020 five-year survey to identify areas with the highest concentration of people who say they don’t have a broadband subscription.
Where are the most Missourians who cannot access broadband?
Answering this question is more complicated than you might expect. The Federal government requires ISPs to report where they provide service and at what speed. It is widely accepted that these data are inaccurate due to how the information is collected.
An article in the External LinkNational Law Review explains the issue in greater detail, and what the FCC is doing to fix it. In short, the FCC is changing how ISPs report their coverage. The changes are expected to reduce data inaccuracy and the revised maps are expected in late 2022.
In our first map below, we add data from the ACS to the FCC’s Form 477 data. The ACS collects information from around 3.5 million households annually. The survey includes the following question about internet use:
Do you or any member of this household have access to the Internet using a:
- Cellular data plan for a smartphone or other mobile device?
- Broadband (high speed) Internet service such as cable, fiber optic, or DSL service installed in this household?
- Satellite Internet service installed in this household?
- Dial-up Internet service installed in this household?
- Some other service?
We combine responses to this question and the FCC data for Missouri to get a clearer picture of where broadband doesn’t exist, and how many people live there.
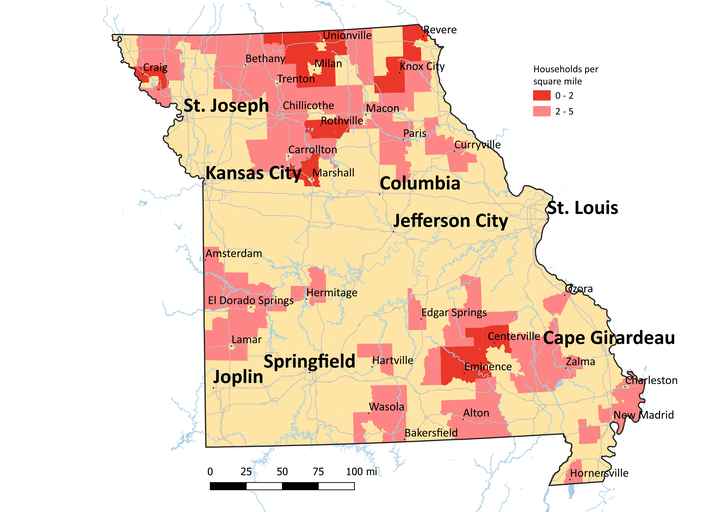
Map 1: Where are the most Missourians who cannot access broadband?
The areas highlighted in red represent nearly 100,000 households without access to broadband. With more people per square mile, expanding broadband in these areas could get more people access per dollar invested. In these areas of relatively high population density, ISPs would likely reach profitability faster than in less populated areas.
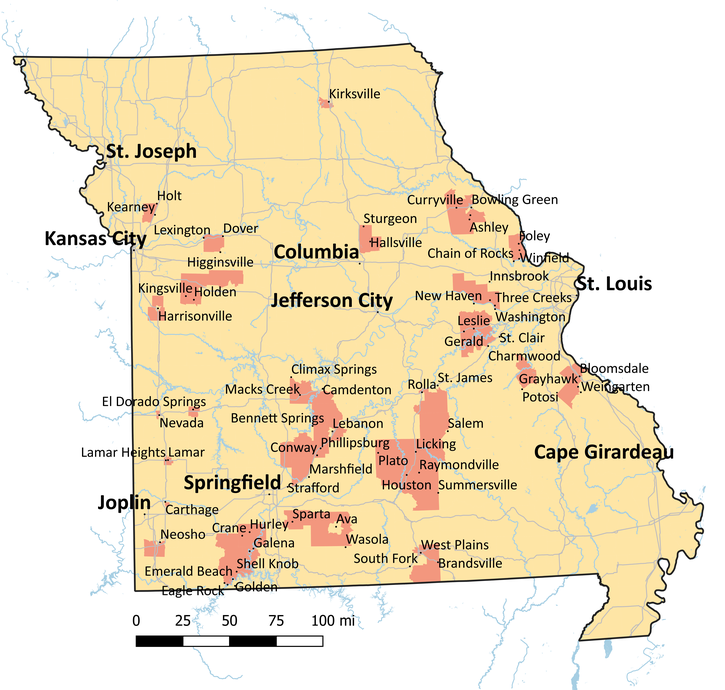
Which Missourians could be the hardest to reach?
It costs more per person to connect households in the most rural areas. For example, if it costs $25,000 to install one mile of broadband along a road and there are 10 homes along the road, that comes out to $2,500 per home. But if there are only two homes along that road it will cost $12,500 per home.
Traditional for-profit ISPs have a harder time making a profit in such low-density areas. Nonprofits, like co-ops, don’t have the same financial pressure to make a profit and may be better positioned for success in these areas. Both co-ops and for-profit ISPs will likely need greater state and federal subsidies to build broadband here than in more densely populated parts of the state.
Limited ACS and FCC data make it more difficult to tell where broadband exists in the most rural areas, so we only look at population densities in this map. However, given the business model challenges in providing broadband service in low density areas, it is more likely that Missourians living in these areas cannot access broadband.
Map 2: Which Missourians could be the hardest to reach?
Map 2 shows the least densely populated areas in Missouri, with two-to-five households per square mile in pink, and zero-to-two households per square mile in red.
Just because broadband is available doesn't mean everyone can or will use it
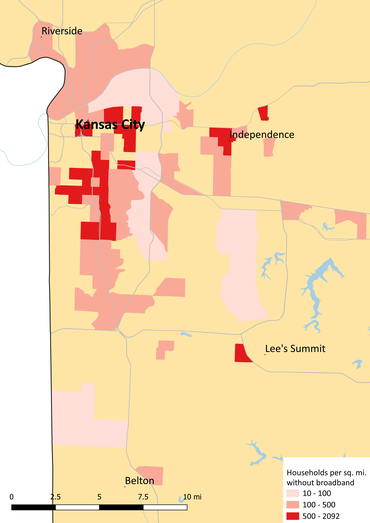
Cities have the population density that should make it possible for all households to have broadband. To see how true this is we looked at the 2020 ACS to identify the number of households per square mile that do not have a broadband connection. Map 3 below highlights such households in the Kansas City area (other Missouri cities are included in maps 4-9 at the end of this report).
Map 3: Kansas City area households without a broadband subscription
Three likely reasons why some residents lack broadband subscriptions
- Despite what the maps say, broadband speed internet may not exist in some lower-income neighborhoods. Some call that digital redlining.
In External Linksimple terms, this means that some ISPs offer slower and less reliable service in lower-income areas than they do in wealthier neighborhoods. Despite what’s indicated on the FCC maps, these areas may not have internet available at broadband speeds. What service is available may be too slow and unreliable to use yet cost just as much as higher speed service available in wealthier neighborhoods. Broadband investment is therefore likely needed in these neighborhoods.
2. Affordability
Purchasing a computer and a $70 monthly internet subscription may be unrealistic for families living paycheck to paycheck. The newly created External LinkAffordable Connectivity Program (ACP) provides subsidies to qualifying households to help cover the cost of an internet subscription and the purchase of a computer. Income guidelines for the ACP are 200% of the poverty line. Since the program is relatively new, many who qualify may not know of it. Other households, such as a single parent making $37,000 a year, make too much to qualify for the ACP yet still may struggle to cover a $50-$70 internet plan.
3. Lack of digital knowledge and skills
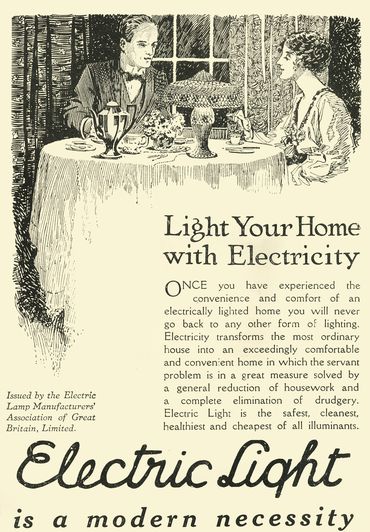
In the early and middle 1900s, utility companies and appliance makers promoted the many uses of electricity. Electricity, they said, could improve a family’s standard of living, but only if the family understood how.
As was true with electricity back then, people today are more likely to use broadband if they understand features and benefits of things like telehealth services, online shopping, and video chat.
How to connect the disconnected
Trusted community partners—nonprofits, schools, churches — can inform their communities about programs like the ACP and External Linkhelp people subscribe. These organizations also play a vital role in digital skills training but may lack the funding or technical know-how. That’s
why the IIJA External Linkincludes $2.75 billion to fund digital skills
and affordability programs.
Limitations and recommendations for additional research
This report is not meant to be conclusive regarding broadband needs. Rather, the intent is to identify where more in-depth research is needed, and where different interventions may be most effective.
The FCC acknowledges the need for more accurate information on broadband availability and is changing how the data are collected and reported. This new data will provide more detailed information and are expected to be available in late 2022.
The other data source used in this report comes from the 2019 and 2020 ACS. Data from the 2021 ACS are expected early next year.
Once available, the above data sets could provide a clearer picture of where broadband isn’t available.
Another limitation of this report comes from the wording of the ACS question on internet use, which likely overstates the number of households with a broadband subscription. Respondents are asked what type of internet connection they have, with one response option being, “Broadband (high speed) Internet service such as cable, fiber optic, or DSL service installed in this household?”
The issue here is that External LinkDSL speed ranges from 5 to 35 Mbps down and 1 to 10 Mbps up. This means that at least some households with a DSL connection have internet speeds well below the current 25/3 Mbps broadband definition. The ACS question, however, considers those households as having a broadband subscription.
Summary
The Federal and state governments are investing unprecedented levels of funding to expand broadband access across the country. Limited data means state leaders must do their own investigation to know where broadband is needed and why it hasn’t already been built. They must further understand why residents who should be able to subscribe have not done so. In each of these areas, policymakers should engage the community to validate what’s preventing people from using broadband. This report is intended to advance those conversations.
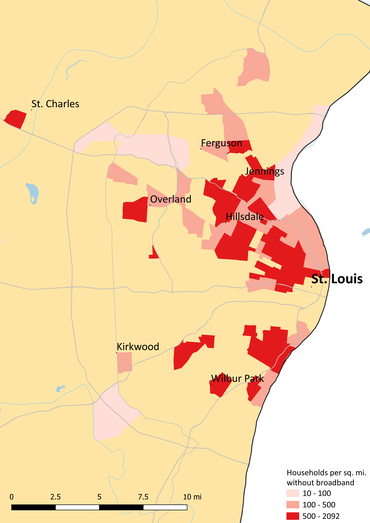
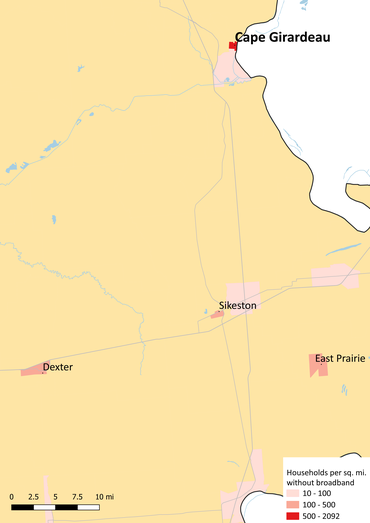
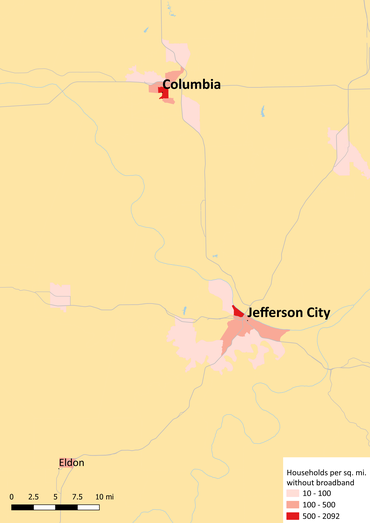
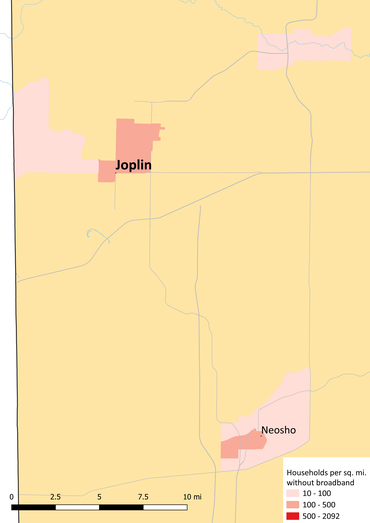
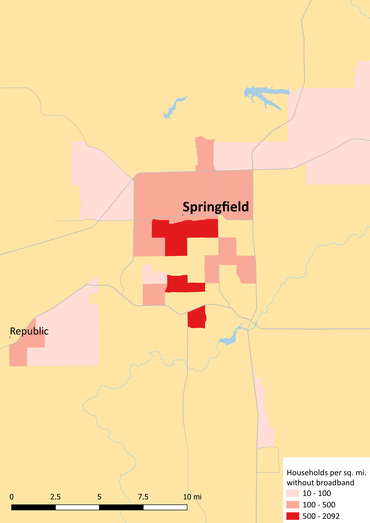
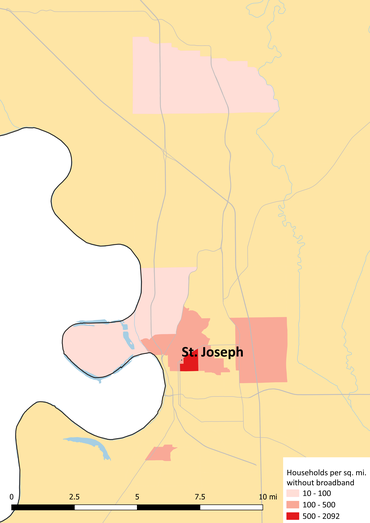
Maps of other Missouri metro areas show where people are unsubscribed from broadband
Map 4: Cape Girardeau, Missouri
Map 5: Jefferson City and Columbia, Missouri
Map 6: Joplin, Missouri
Map 7: Springfield, Missouri
Map 8: St. Joseph, Missouri
Map 9: St. Louis, Missouri